
Abstract
Background:
Many children in rural and remote areas do not have access to professionals providing literacy interventions. However, delivery of services through videoconferencing would increase access and choice for end users.
Introduction:
This pilot study investigated the efficacy of videoconferencing literacy interventions. As videoconferencing platforms become easier and cheaper to use, this form of telehealth delivery is increasing in popularity. However, there is currently no strong evidence base to support this practice.
Materials and Methods:
We studied 18 children, aged 7–12 years, with poor reading and/or spelling, and whose literacy interventions were videoconferenced into their homes and/or schools. Children were tested on three reading measures: (1) reading words, (2) reading nonwords, and (3) letter–sound knowledge, twice before their interventions commenced and once after their intervention concluded.
Results:
Children's raw and standardized scores on 2 of 3 outcome measures increased significantly more during the intervention than in the no-intervention period before their training commenced.
Discussion and Conclusions:
This study demonstrates that videoconferencing is a promising delivery mode for literacy interventions, and the results justify running a larger, randomized controlled trial.
Introduction
An estimated 5–17% of children have significant difficulties learning to read. 1,2 This can limit academic performance and vocational opportunities. 3,4 Poor literacy is also associated with poor self-esteem, 5 school dropout, and even attempted self-harm. 6,7
A growing evidence base shows that certain interventions can alleviate reading and spelling impairments in children. 8,9 These literacy interventions are typically delivered as in-person sessions, with the child and clinician located in the same room. Such in-person treatment is feasible for children who live close to their clinician. However, it can be impossible for some families who live in rural and remote regions. It can also be difficult for families who live in cities where the ability to visit a clinic multiple times per week is impeded by poor public transport or daily traffic congestion. In addition, as the world has just learned, in-person treatment is also impossible during lockdown situations that are triggered by worldwide pandemics such as COVID19.
Some clinicians have tackled this problem by livestreaming their services using internet-based systems such as Skype, Zoom, FaceTime, Google Hangouts, and Adobe Connect. Anecdotally, this approach appears both successful and popular. However, the scientific evidence supporting videoconferencing of literacy interventions is extremely limited. One well-controlled, single-case intervention study has shown that a child with reading impairment made significant gains in reading through videoconferencing literacy intervention. 10 However, the effect of videoconferencing literacy intervention has never been tested in multiple poor readers, and no study has compared the efficacy of a videoconferencing literacy intervention with in-person literacy intervention to test if it is equally effective. 11 Two trials have shown that videoconferencing literacy assessments produce similar results to in-person literacy assessments, but no intervention component was included in these studies. 12,13
There is more substantial evidence to suggest that non-in-person interventions, including videoconferencing, can be effective for treatment of other developmental disorders, including speech and spoken language impairments. 14 –17 While encouraging, this evidence cannot be generalized to literacy intervention because different areas of cognition require different intervention protocols. For example, the Lidcombe stuttering program works with verbal feedback to verbal responses. 18 Many literacy interventions require the presence of written materials in the treatment room (e.g., printed words and books) or writing down words on a piece of paper. Hence, it is important to examine the relative efficacy of different types of interventions directly.
This study tested whether a literacy intervention delivered through videoconferencing can improve literacy skills in a group of 18 children with poor reading and spelling. Three assessments were conducted: one at the start of the study (time 1; T1), the second after a median of 15.6 weeks of no intervention (time 2; T2), and the third after a median of 11 weeks of the videoconferencing reading/spelling intervention. The gains made by children during the intervention (i.e., from T2 to T3) were compared with any gains during the no intervention period (i.e., from T1 to T2) to determine if the literacy intervention through videoconferencing was more effective than no training (which included children's usual school routines). Note that the break between T1 and T2 represents the time that children waited to start their intervention, mostly due to the clinic running at capacity.
Materials and Methods
PARTICIPANTS
Eighteen children (8 females and 10 males) with reading/spelling difficulties participated in the study. Children were minors enrolled at the Macquarie University Reading Clinic (MURC), whose parents/guardians gave written informed consent to their children's data being used for research. They also opted to receive the intervention through videoconferencing and scored below the average range (i.e., below a standard score of 85) for their age or grade on at least one of four tests—nonword reading accuracy, 19 irregular word reading accuracy, 19 nonword spelling accuracy, 20 and irregular word spelling accuracy. 21 We chose these measures because they test the fundamental ways of translating written language into spoken language (reading) and spoken language into written language (spelling) (see the Eligibility Measures section and Progress/Outcome Measures section below for a description of these tests). These fundamental pathways are also referred to as nonlexical and lexical pathways. 19,21
All children were 7–12 years old, in grades 2–7 at school, and had normal hearing and normal or corrected-to-normal vision. All but one had previously reveived reading interventions at or out-of school. The children varied in their performance across the eligibility tests (Supplementary Table S1). As such, the study sample is relatively heterogeneous, which is typical for a clinical caseload at a clinic or literacy center.
PROCEDURE
In the first assessment session (T1), children were administered the eligibility measures (see description below) as well as three progress/outcome measures by a clinician who only conducts assessment at the clinic (see the Progress/Outcome Measures section below.) Note that because children entered this study as clients of the MURC, they were given the standard assessment battery of the clinic, which includes additional reading, spelling, and spoken language tests, to gain a complete overview of the child's abilities in this area. However, these tests are not reported here because they were not used to determine eligibility or measure progress in this study. At T2 and T3, children only completed the progress/outcome measures.
Testing at T2 and T3 was conducted by a clinician who also conducted the treatment. T1 took 2–3 h to complete, while T2 and T3 took 10–15 min to complete. At T1, participants were tested individually in a quiet room at the MURC. They completed T2 and T3 at the MURC or from home through videoconferencing (at the participant's request). As mentioned above, two studies have found no differences between in-person and videoconference versions of literacy assessments similar to those used in this study. 12,13 This was confirmed by outcomes of the current study, which showed that there were no systematic losses or gains over the no-training period for children who switched from in-person assessment at T1 to assessment through videoconferencing at T2 (Supplementary Table S2). Across the 44 T1–T2 comparisons (33 of which were a switch to videoconference sessions), only 7 were significant (6 of these were a switch to videoconference sessions). Three changes showed a decrease and 4 an increase in scores. No child showed a significant change on more than one test. We will return to this point in the Discussion section below.
Participants' verbal responses were recorded on a digital voice recorder. Tests were scored online and then rescored against the recording. A randomly selected 10% of tests at T2 and T3 were blind-scored by a trained clinician who did not know the purpose of testing or the time of testing (i.e., whether a test was taken before [T2] or after [T3] the intervention). Inter-rater agreements between the initial tester and the blind scorer were very high (96%).
ELIGIBILITY MEASURES
Nonword and irregular word reading
The Castles and Coltheart reading Test-2 (CC2) 19 was used to assess nonlexical and lexical reading accuracy. This test consists of 40 regular words, 40 irregular words, and 40 nonwords. For each word type, accurate responses are summed to create a raw score. Raw scores were converted into age-based standard scores by converting the published percentiles. The test has good reliability and validity. 22,23
Nonword spelling
The nonword spelling-to-dictation task from the Queensland Inventory of Literacy (QUIL) 20 was used to assess nonlexical spelling. It consists of 24 nonwords that increase in length and complexity. Correct responses are summed and form the raw score that was converted into a grade-based standard score based on the published percentiles. The test manual reports good reliability, internal consistency, and inter-rater reliability.
Irregular word spelling
The Diagnostic Spelling Test-Irregular words (DiSTi) 21 was used to assess lexical spelling. This spelling-to-dictation task consists of 74 irregularly spelled words (e.g., good, enough, and language). Correct responses are summed to create a raw score that was converted into a grade-based standard score based on the published percentiles. The test has good internal consistency, construct validity, and test–retest reliability. 21
PROGRESS/OUTCOME MEASURES
Word reading
Word reading was measured using the Test of Word Reading Efficiency-Sight Word Efficiency subtest (TOWRE SWE). 24 Children are asked to read aloud as many words as they can within 45 s. The number of words read correctly was summed and then converted into a grade-based standard score based on Australian norms. 25 Torgesen et al. 24 report good internal consistency for the TOWRE SWE, and Australian norms have high inter-rater reliability. 25
Nonword reading
Nonword reading was measured using the Test of Word Reading Efficiency-Phonemic Decoding Efficiency subtest (TOWRE PDE). 24 Children are asked to read aloud as many nonwords as they can in 45 s. Correct responses, as defined by the published pronunciation guide, 25 were summed to form a raw score that was converted into a grade-based standard score based on Australian norms. 25 The test has good internal consistency, 24 and Australian norms have high inter-rater reliability. 25
Letter–sound knowledge
Letter–sound knowledge was assessed with the Letter–Sound Test (LeST). 26 Children are asked to sound out single letters and multigraphs. Correct responses were defined by the test description and summed to produce a raw score. Raw scores were converted into percentiles provided by Larsen et al. 26 and then translated into standard scores. Note that published norms go up to grade 3. For children in our dataset who were in higher grades, we used the oldest comparison group available. The test has good criterion validity, test–retest reliability, and inter-rater agreement. 26
INTERVENTION
Trained clinicians from the MURC delivered 30 intervention sessions to each child (three weekly sessions on average), each lasting 30–45 min. The intervention was delivered at each child's home or school using the videoconference platforms, Skype, Zoom, or FaceTime. Children were equipped with whiteboards, whiteboard markers, whiteboard erasers, and books, and clinicians were equipped with testing and training materials. Clinicians recorded children's oral and written responses on the training items to monitor progress on the training programs. Children's progress was discussed in weekly meetings between the clinician and first author.
While all interventions were delivered through videoconferencing, they differed in content. As is best practice, each child was trained in the reading and spelling skills that were below the 25th percentile at T1 through the eligibility measures. As evident from their scores at the initial assessment (Supplementary Table S1), the children required intervention in phonics reading/spelling and sight word reading/spelling. These interventions are summarized in the following sections.
PHONICS READING AND SPELLING INTERVENTION
Reading and spelling were trained using phonics interventions similar to those demonstrating significant effects in group 8,9 and single-case studies. 27 We used the MURC Reading Gap Training and the MURC Spelling Gap Training, which are explicit, systematic, synthetic phonics programs. 28,29 The programs were individually tailored to meet each child's instructional needs and only targeted letter–sound and sound–letter rules that the children did not know at the beginning of their intervention. Training for phonics-focused reading and spelling took around 20–30 min to complete.
SIGHT WORD READING AND SPELLING
Sight word reading and spelling were targeted with interventions similar to those demonstrating significant effects on word reading/spelling abilities in group studies 22,30 and individual case studies. 31 –33 The MURC Sight Word Program 34 focuses on reading and spelling of commonly occurring words, which the child was unable to produce correctly at the beginning of the training. Training included repeated exposure to the written and spoken word, 22,30 repeated reading aloud, 22,30 copying techniques, 32,33 letter probing, 35 and delayed copying. 32,33 The sight word training in each session took around 5–10 min to complete.
TEXT READING INTERVENTION
All bar one child received the text reading intervention to practice phonics knowledge and sight word recognition at the text level. 36 Text reading sessions also focused on careful reading (i.e., not skipping or misreading small words like “the,” “and,” and “so”), breaking up longer words into syllables and/or morphemes, and self-monitoring, including correction techniques when incorrectly sounding out irregular words. 37 While children were asked comprehension questions about the text, no explicit comprehension training program was included in these interventions. About 10 min per session were dedicated to the text reading practice.
Results
Table 1 shows the group's mean raw and standard scores (with standard deviations) on each outcome measure at T1, T2, and T3. We used weighted statistics rate of change statistics 38 —designed to cater for small sample sizes—to determine if gains in raw or standard scores over the intervention period (i.e., from T2 to T3) were statistically significantly greater than gains over the no-training period (i.e., T1 to T2). Note that by choosing this particular design, children acted as their own waitlist control before the start of the intervention. Significant improvements were evident for raw scores and standard scores on measures of nonword reading and letter–sound knowledge, but not the word reading task. The group's mean standard scores on nonword reading and letter–sound knowledge fell either within the average range (i.e., within one standard deviation of the mean grade score) after the intervention or very close to it. The word reading standard scores remained below the average range.
Group Mean Raw Scores, Standard Scores (Standard Deviations), and Sample Size (N) for Each Outcome Measure at T1, T2, and T3, as Well as West-ROC Statistics (t-Values and One-Tailed p-Values)
We reran the analysis, taking out children who showed a significant change from T1 to T2 and who had switched to livestreaming at T2: t(7) = 9.12 p < 0.0001 (one-tailed).
We reran the analysis, taking out children who showed a significant change from T1 to T2 and who had switched to livestreaming at T2: t(7) = 7.83 p < 0.001 (one-tailed).
We reran the analysis, taking out children who showed a significant change from T1 to T2 and who had switched to livestreaming at T2: t(11) = 2.72 p = 0.010 (one-tailed).
We reran the analysis, taking out children who showed a significant change from T1 to T2 and who had switched to livestreaming at T2: t(11) = 1.68 p = 0.060 (one-tailed).
LeST, letter–sound test; West-ROC, weighted statistics rate of change; SD, standard deviation; StSc, standard scores; TOWRE PDE, Test of Word Reading Efficiency Phonemic Decoding Efficiency subtest; TOWRE SWE, Test of Word Reading Efficiency Sight Word Efficiency subtest.
Figures 1 –3 display the mean scores of the group as well as scores of the individual children that generated the means. The figures were computed using Cumming's ESCI. 39 In the figures, individual participants' data points are plotted as open dots (blue in the colored version), while group scores are depicted as filled dots (black in the colored version). There are three important data points: (1) gains in performance before training (change scores from T1 to T2 [T2–T1]), (2) gains during training (change scores from T2 to T3 [T3–T2]), and (3) the difference in gains before training versus during training, which are plotted against the right-hand y-axis (depicted as [pink] triangles in the figures; open triangles for individuals and a filled triangle for the group). These figures show that gains made by the majority of individuals are consistent with the group means. This indicates that for most (but not all) children in the sample, the group mean was a reasonable reflection of improved performance.
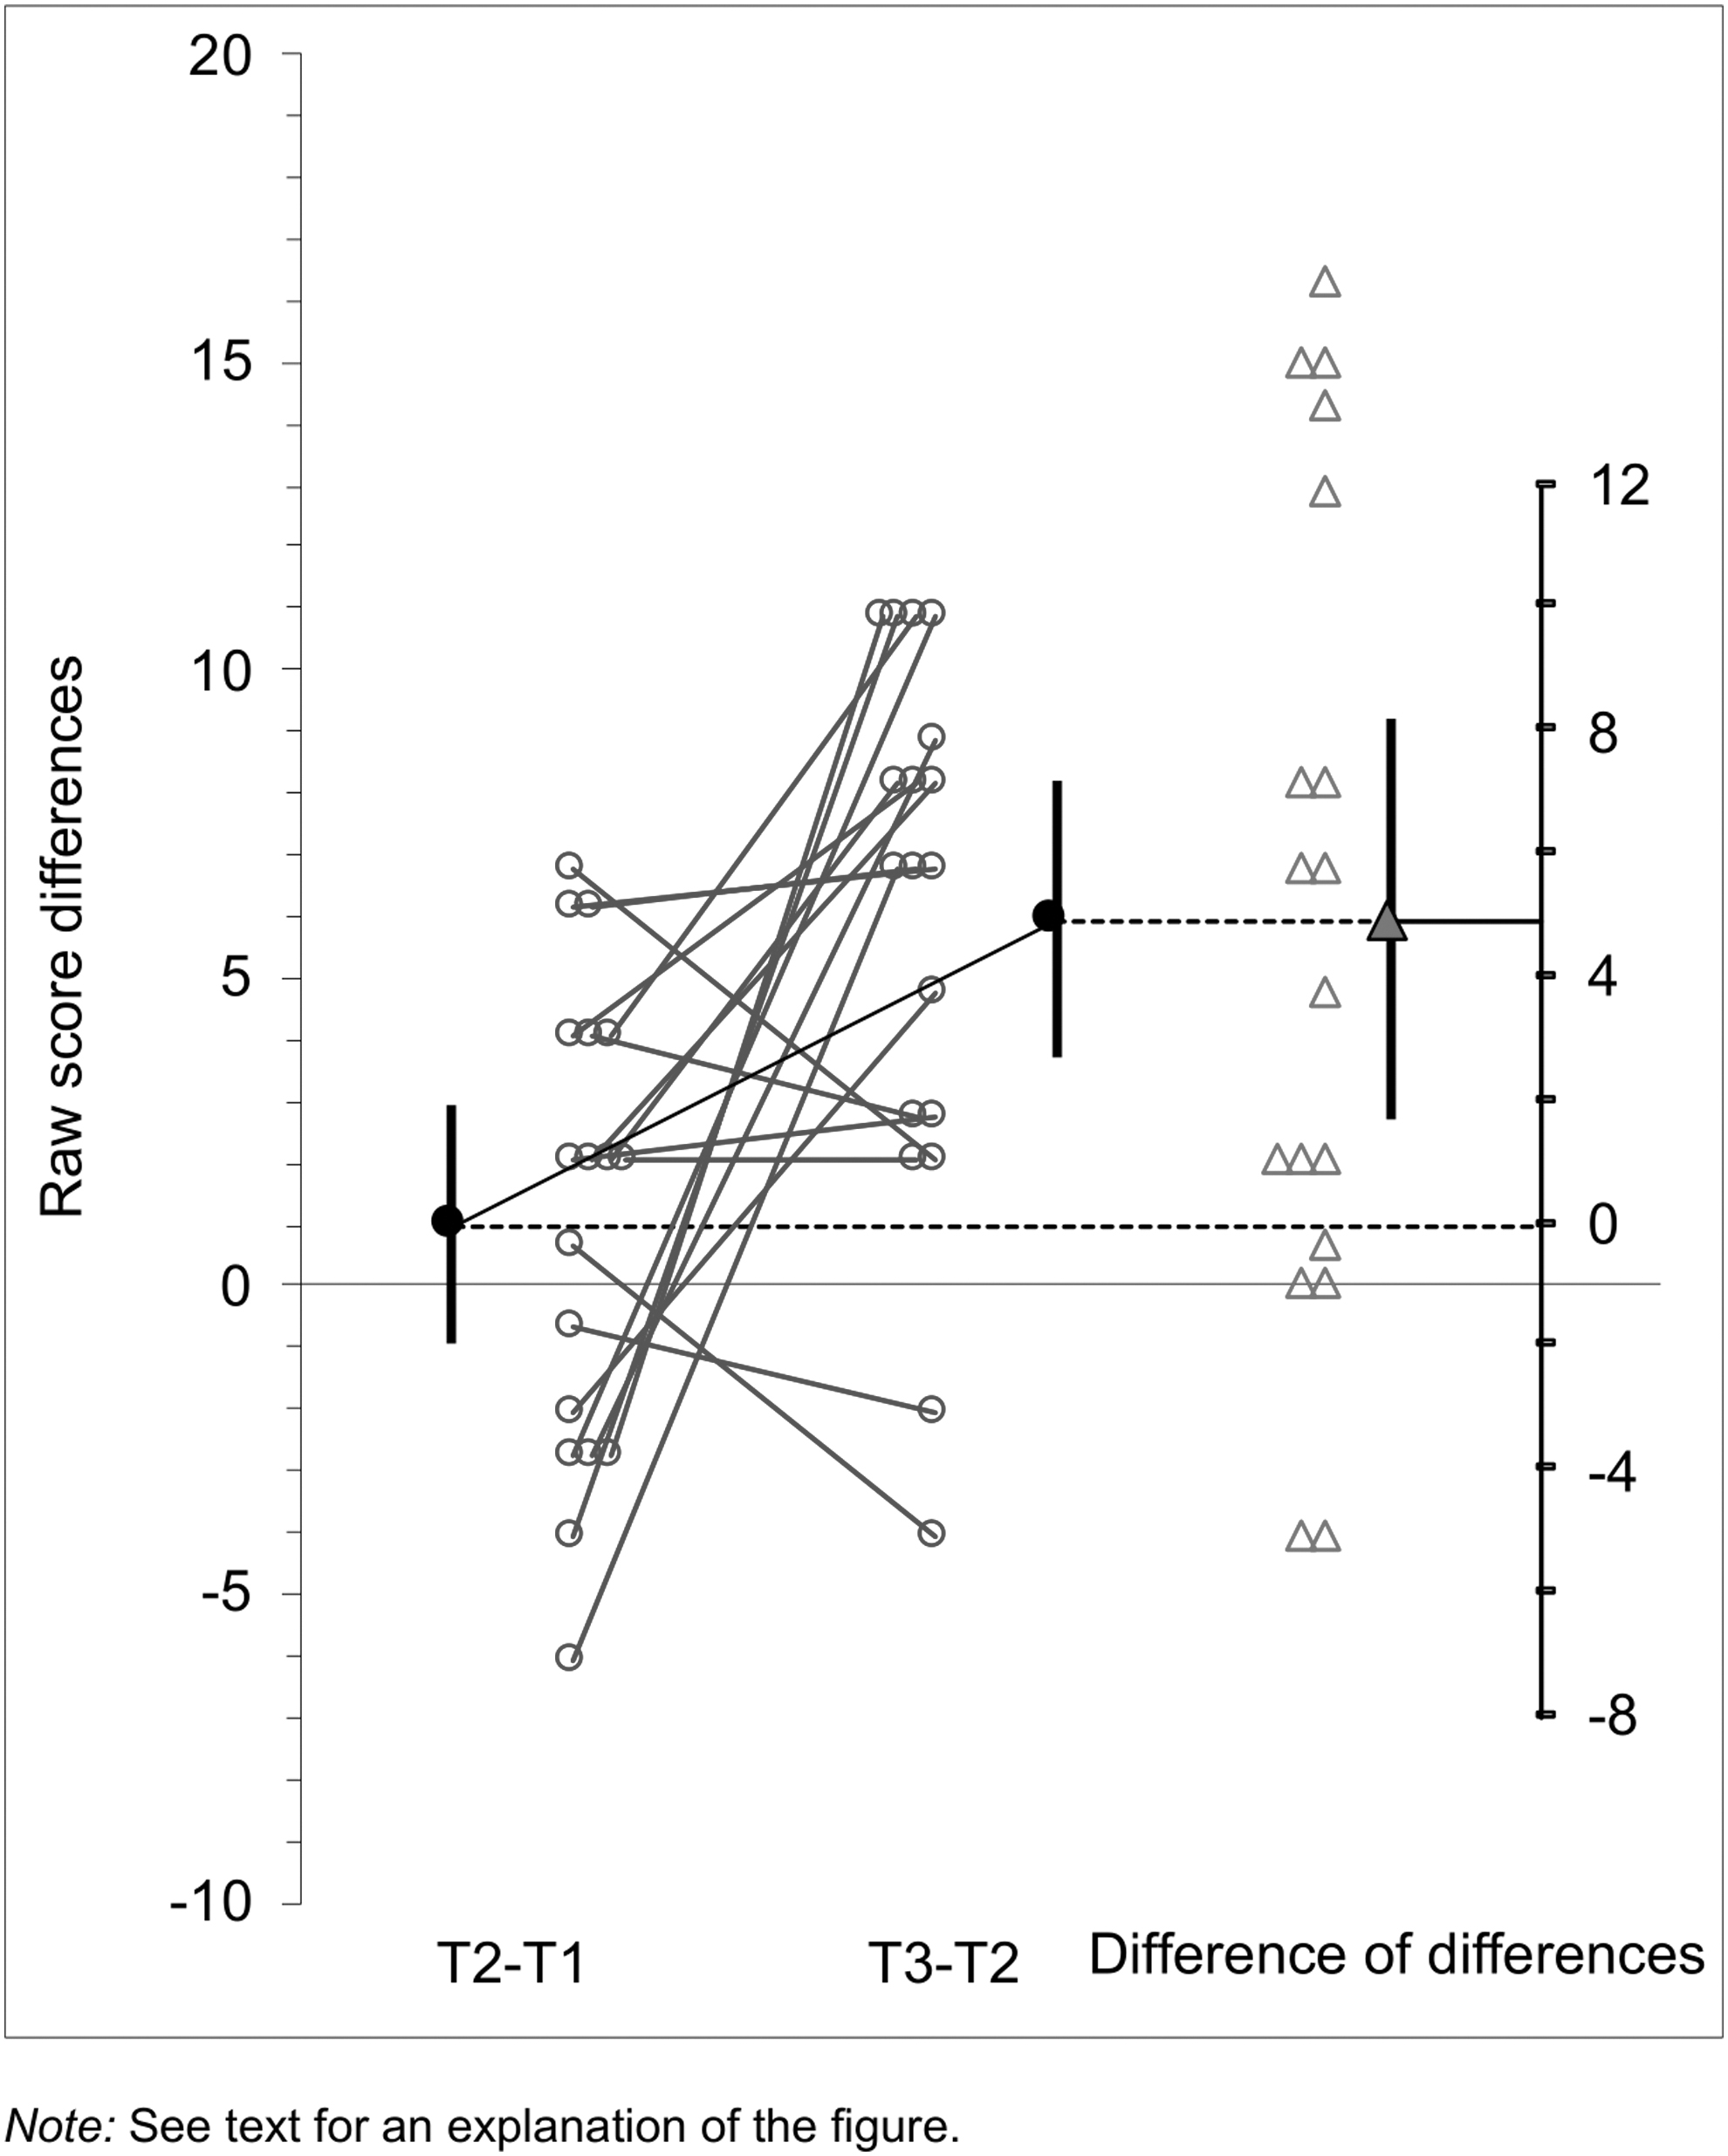
Raw score changes on the TOWRE PDE (reading nonwords aloud). TOWRE PDE, Test of Word Reading Efficiency Phonemic Decoding Efficiency subtest.
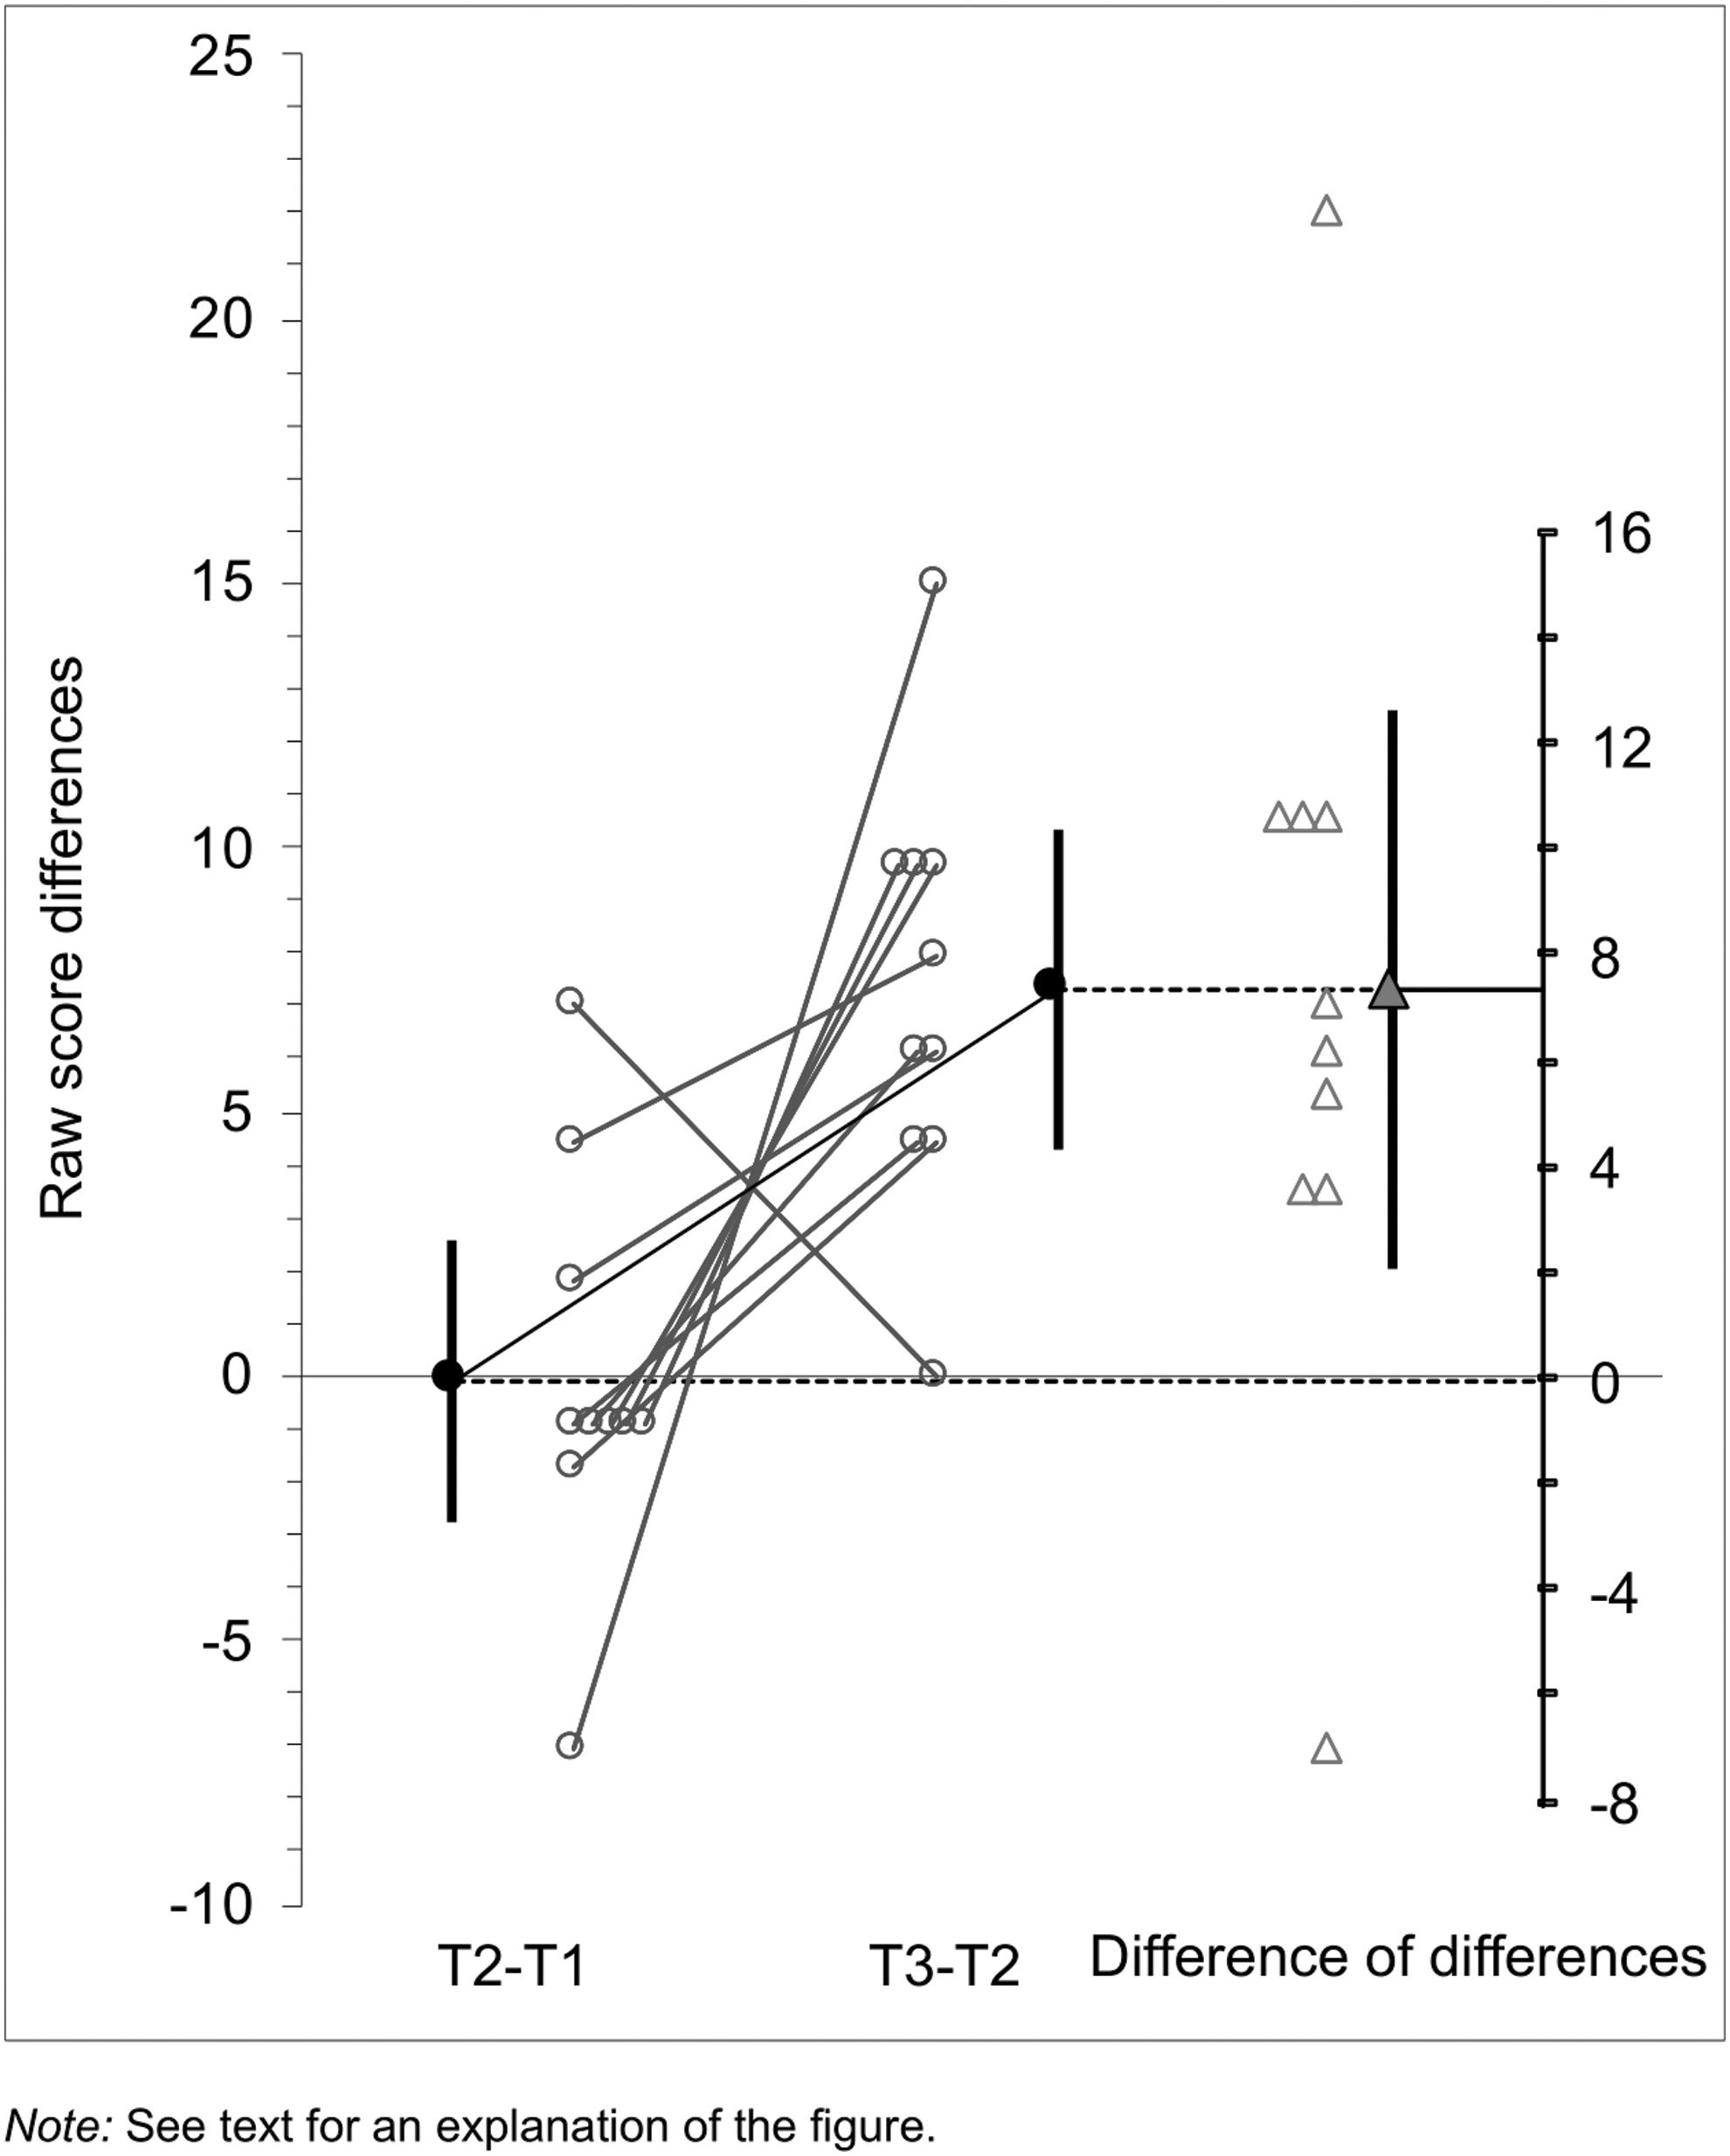
Raw score changes on the LeST (sounding out graphemes). LeST, Letter–Sound Test.
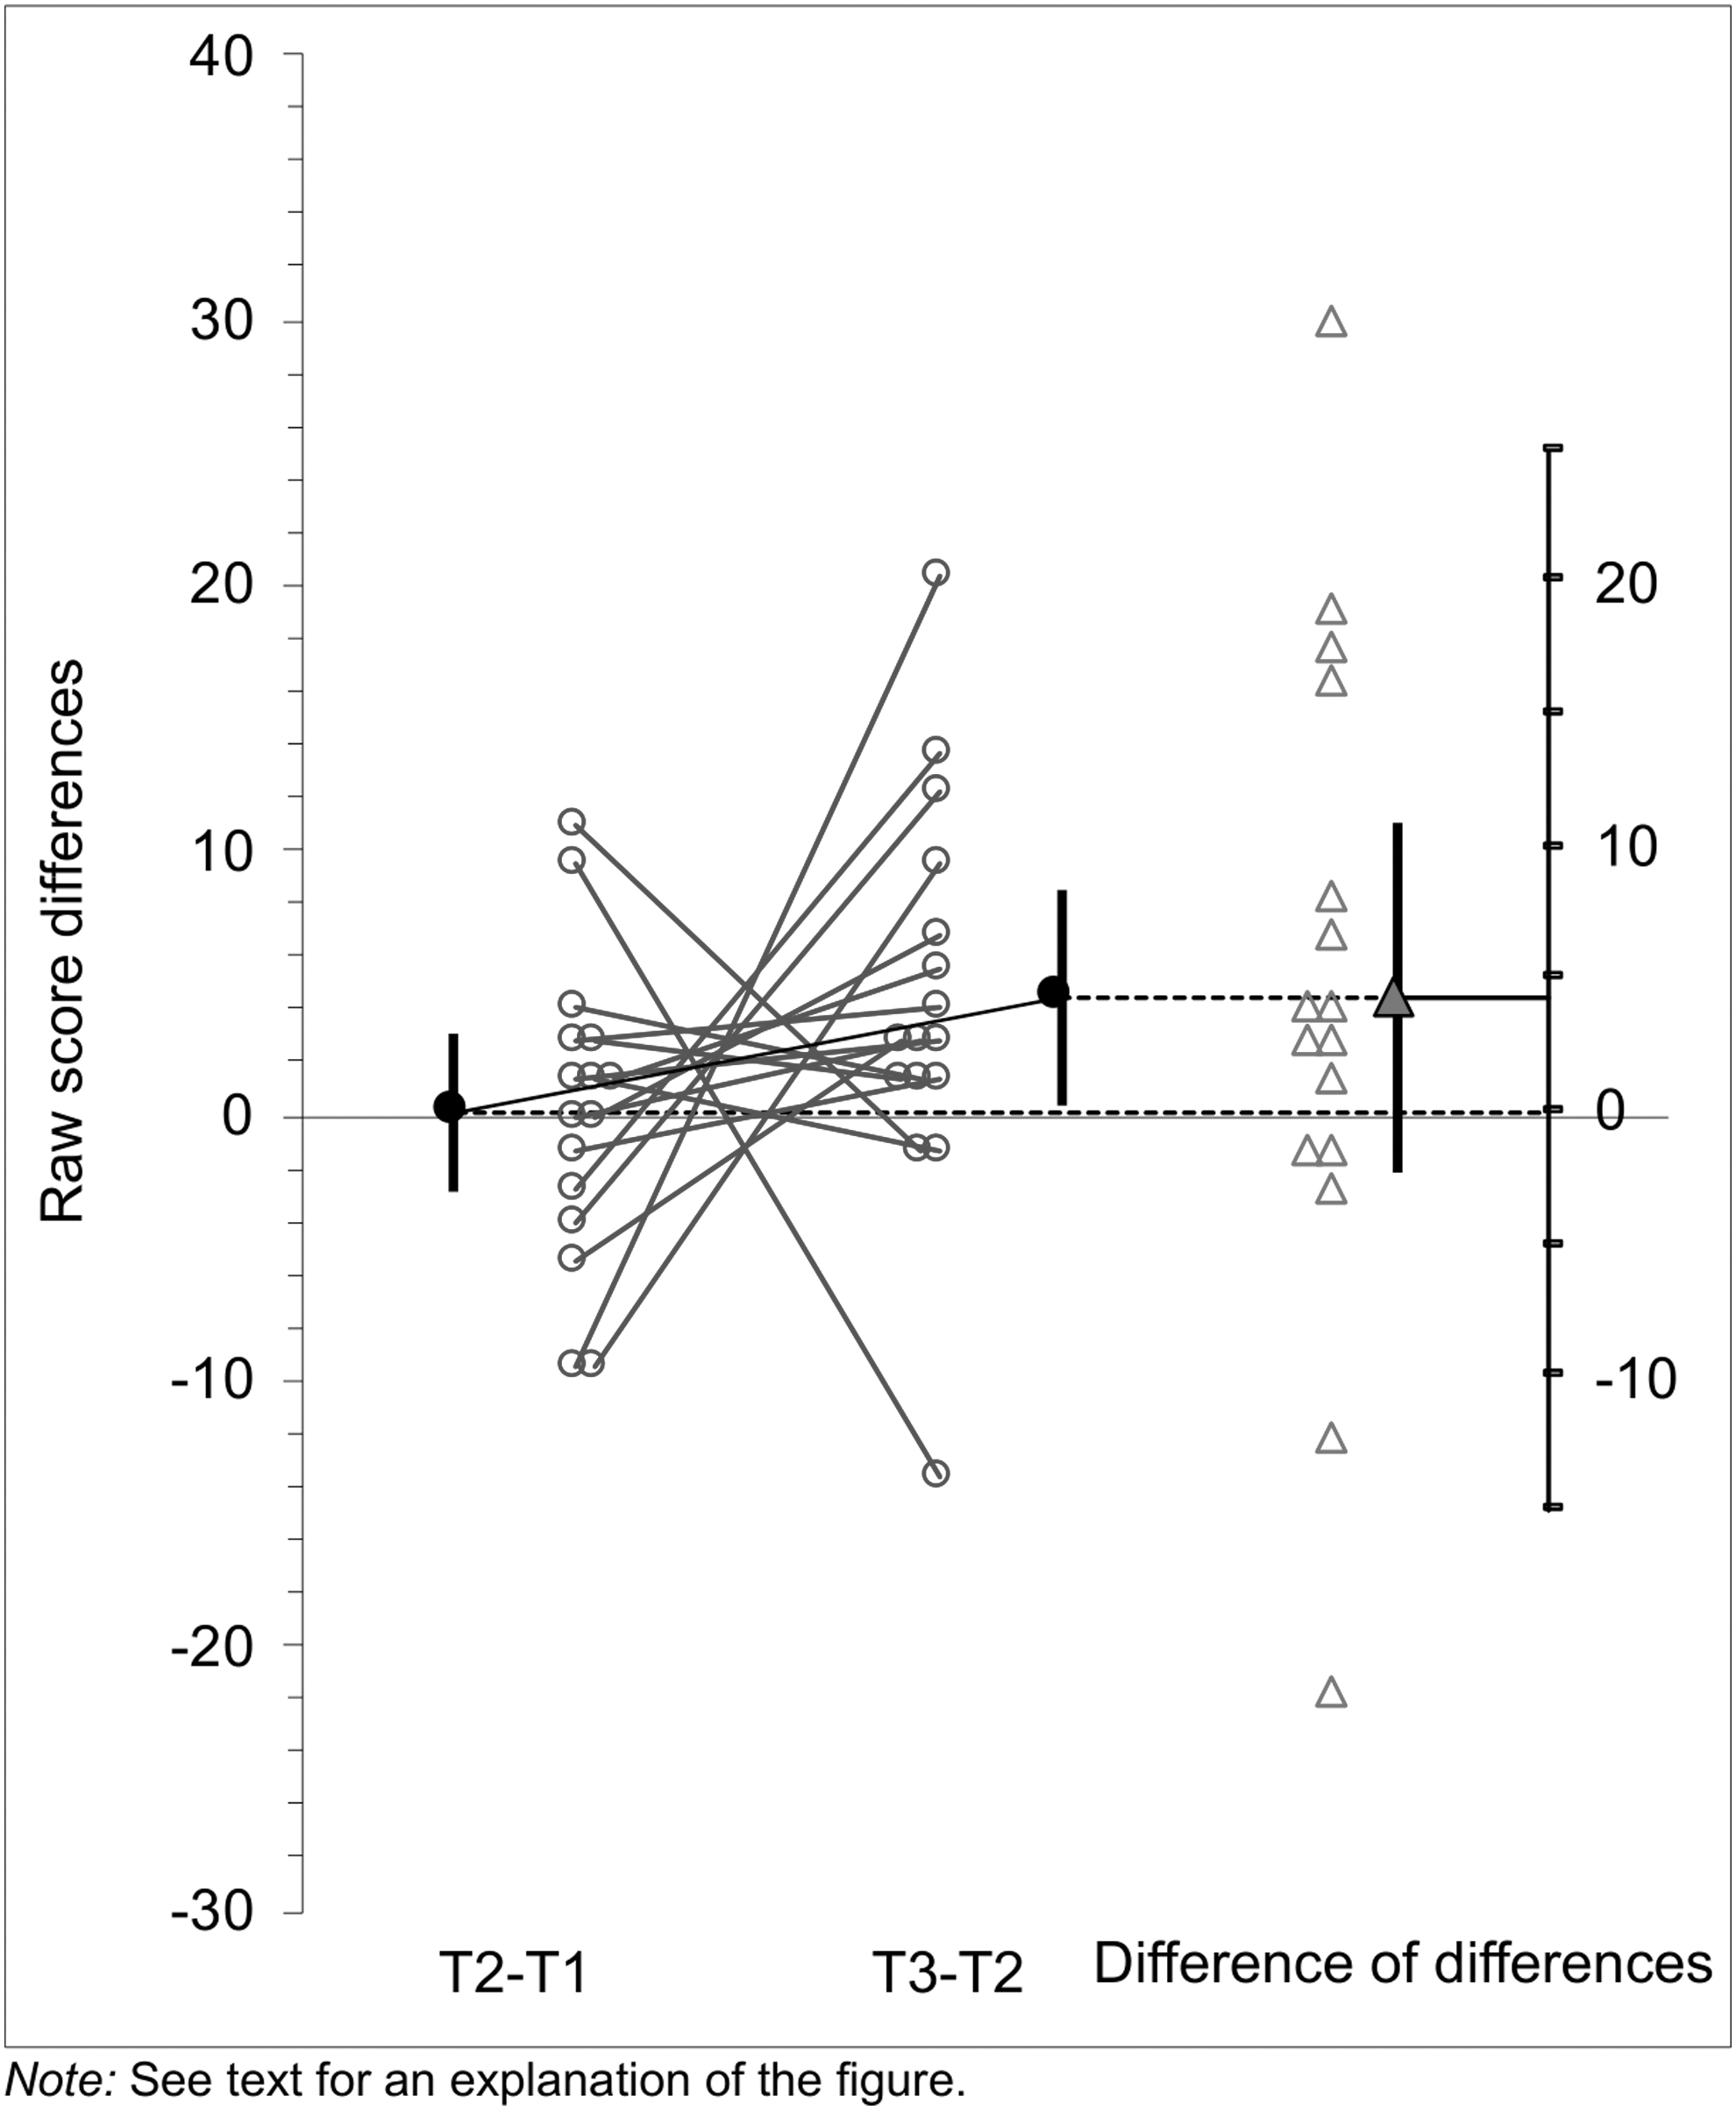
Raw score changes on the TOWRE SWE (reading words aloud). TOWRE SWE, Test of Word Reading Efficiency Sight Word Efficiency subtest.
Discussion
The aim of this study was to investigate whether delivering the reading and spelling intervention through videoconferencing can improve reading scores for children with poor reading/spelling. We found that this was the case. There were improvements in raw and standard scores at the group level in all three reading measures, which were significant for nonword reading and letter–sound knowledge. The changes in standard scores at the group level indicated that children were beginning to catch up with their peers. One progress/outcome measure (letter–sound knowledge) included some trained items, indicating that children were able to apply what they had learned within the sessions in a more formal test situation. The remaining two progress/outcome measures (word and nonword reading) did not include directly trained items. The children's improvement in untrained items indicates that they were able to generalize newly learned knowledge to new contexts. Overall, the treatment programs and delivery mode used in this study can increase reading scores for poor readers/spellers.
The results of this study provide sufficient evidence to justify running a larger, randomized controlled trial. This kind of study could evaluate whether the positive effects of the current study can be replicated in a larger cohort, with random allocation to treatment conditions. This trial would ideally include an in-person condition to measure if one of the two treatment modes is more successful than the other.
A larger trial may also be able to determine if the delivery mode interacts with learner characteristics. Some children (e.g., those with additional hearing impairments, difficulty discriminating sounds, severe and unmanaged behavior, and attention difficulties) may benefit more from in-person delivery. There may be other learners (e.g., those with additional social anxiety) who benefit more from videoconferencing. However, there are currently no studies that have investigated these hypotheses experimentally.
Despite these overall positive effects, not all children improved as a consequence of the intervention. While this is probably typical of most group studies, this fact can often be hidden when only group averages are presented. Poor readers may need as many as 150–300 h of intervention to catch up with their peers. 40 The intervention described here, while intensive at three sessions a week, was nonetheless relatively short (around 20 h). Hence, it is possible that some children would have shown greater progress if training had been delivered for longer (especially since all but one of the children had already completed other remedial reading programs). However, even with more sessions, there are likely to be some students who will not make the desired gains. 41 While progress is being made in this area, predicting response to intervention remains a challenge. 42 –44
The limitations to this study should be noted. First, the assessors were not blinded to the treatment protocol. This introduces possible bias and future studies should employ blinding. However, we were able to show a high level of agreement (96%) between the initial scorer and a blind scorer, likely indicating that the results are valid.
Second, many participants in this study switched from in-person testing at T1 to testing through videoconferencing at T2. There were no systematic changes in the data, suggesting that this change does not compromise the interpretation of results. We also reran the analyses without children who had switched to videoconferencing and showed significant changes from T1 to T2. In these reanalyses, t-values increased. This indicates that including children who switched assessment modes did not overestimate the treatment effect (if anything, the opposite is true). Future studies should try to keep the testing delivery mode constant across testing points.
Third, this study only implemented MURC's training programs rather than a variety of different literacy interventions. Some may wonder if the results can be generalized to other training programs. The two studies to date that have explored the effects of videoconferenced interventions have used different interventions (our own and that of Wright et al.). 10 The interventions in both studies are representative of best practice since they are based on the outcomes of scientific studies. At this early stage, this suggests that videoconference adaptations of best-practice in-person programs have a good chance of being successful.
Summary and Conclusions
Overall, the data presented here are promising. This study was conducted with the largest cohort to date, suggesting that literacy interventions delivered through videoconferencing can lead to improvements in children with poor reading and/or spelling. This is important information for clinicians, teachers, and families. What is required now is a double-blind and randomized controlled trial to test the relative benefit of videoconferenced interventions versus in-person delivery in a larger sample.
Footnotes
Acknowledgments
The authors would like to thank the participants and their parents who so generously donated their time and efforts to this project. The authors would also like to thank their highly skilled clinicians who carried out the assessments and treatments, especially Erika Contini, Elena Badcock, Kristina Barisic, Leslie Hurd, Maia Zucco, Stuart Heath, and Ruya Mahmood.
Disclosure Statement
No competing financial interests exist.
Funding Information
This project was supported by a Macquarie University Restart Grant 63955718 to S.K.
Supplementary Material
Supplementary Table S1
Supplementary Table S2
References
Supplementary Material
Please find the following supplemental material available below.
For Open Access articles published under a Creative Commons License, all supplemental material carries the same license as the article it is associated with.
For non-Open Access articles published, all supplemental material carries a non-exclusive license, and permission requests for re-use of supplemental material or any part of supplemental material shall be sent directly to the copyright owner as specified in the copyright notice associated with the article.