
Abstract
Introduction:
Teleneurology has become widely adopted during severe acute respiratory syndrome coronavirus 2 pandemic. However, provider impressions about the teleneurology experience are not well described.
Methods:
A novel questionnaire was developed to collect provider impressions about video teleneurology encounters. All providers in the University of Pennsylvania Health System (UPHS) Neurology Department (N = 162) were asked to complete a questionnaire after each video teleneurology patient encounter between April and August 2020. Individual patient and encounter-level data were extracted from the electronic medical record.
Results:
One thousand six hundred three surveys were completed by 55 providers (response rate of 10.12%). The history obtained and the ability to connect with the patient were considered the same or better than an in-person visit in almost all encounters. The quality of the physician–patient relationship was good or excellent in 93%, while the overall experience was the same as an in-person visit in 73% of visits and better in 12%. Sixty-eight percent of respondents reported that none of the elements of the neurological examination if performed in person would have changed the assessment and plan. Assessment of the visit as the same or better increased from 83% in April to 89% in July and 95% in August. Headache (91%), multiple sclerosis and neuroimmunology (96%), and movement disorder (89%) providers had the highest proportion of ratings of same or better overall experience and neuromuscular providers the lowest (60%).
Conclusions:
Provider impressions about the teleneurology history, examination, and provider–patient relationship are favorable in the majority of responses. Important differences emerge between provider specialty and visit characteristics groups.
Introduction
Teleneurology is neurological care delivered through telephone or videoconference electronic communication. 1 Before 2020, the proportion of neurological outpatient visits that were performed virtually was small in comparison with in-person visits, 2 and most were conducted to overcome lack of access to specialized care due to geographical or physical barriers.
Telestroke, the most successful implementation of teleneurology, 3,4 has improved acute stroke management, and patients treated through telestroke have outcomes similar to in-person neurological care. 5 –7 Teleneurology models have been proposed in neurocritical care, 8 epilepsy, 9 movement disorders, 10 headache, 11 multiple sclerosis, 12 traumatic brain injury, 13 and dementia. 14 However, none have been widely implemented in part due to the cost of implementation, challenges in reimbursement, and regulatory barriers. 15 In addition, few studies have reported the provider impressions of teleneurology visits.
The severe acute respiratory syndrome coronavirus 2 (SARS CoV-2) pandemic led to a dramatic increase in teleneurology out of necessity to ensure continuity of care and the safety of patients and providers. Among neurology providers in the University of Pennsylvania Health System (UPHS), three teleneurology visits were conducted during the first 2 weeks of March 2020 before the SARS CoV-2 outbreak in Philadelphia. In contrast, an average of 1,079 visits per week were conducted between April and July 2020. 16 This sudden rise in teleneurology provided an opportunity to capture information from neurology providers about the teleneurology experience in a hypothesis-generating, quality-improvement approach. Here, we present provider impressions of teleneurology at UPHS during the SARS CoV-2 pandemic from individual encounters by videoconference teleneurology.
Methods
Survey Design and User Testing
A novel teleneurology provider questionnaire was developed by all authors. Key concepts included adequacy of technology, assessment of the history and physical examination, and overall impressions from individual teleneurology encounters comparing teleneurology in-person visits. An initial draft of the questionnaire was written (L.W.) and edited by all coauthors. REDCap was used to administer the questionnaire. It was designed to be completed rapidly and self-administered by each provider after each individual teleneurology patient-encounter. Six providers (C.P., D.J., K.Y., M.S., T.F.T., and Christina Blum, MD) conducted a pilot over the course of 3 days including 48 patient encounters and provided feedback on survey usability. Suggestions were incorporated, and a final questionnaire was created. Pilot-phase data are excluded from the final dataset as the wording of questions differed between the initial and final questionnaires.
Individual patient and encounter-level identifiers were collected allowing a direct link between the questionnaire response and the patient encounter for future research. The questions and responses are shown in Table 1.
Teleneurology Provider Questionnaire
Provider name, survey timestamp, and date of visit were also recorded. Responses were required unless otherwise noted.
Survey Distribution and Data Collection
Data were collected in real time and managed using REDCap electronic data capture tools hosted at UPenn. 17 One hundred sixty-two adult neurology providers including physicians, resident physicians, fellows, nurse practitioners, and genetic counselors across the University of Pennsylvania Health System (UPHS) were asked to complete a questionnaire for each completed teleneurology videoconference patient-encounter. Resident physicians completed surveys for patients in their continuity clinic; attending physicians did not complete surveys for these encounters. Telephone-only encounters and attempted encounters with a technology failure were excluded to focus on videoconference encounters. Throughout the study period, patients and providers were given the flexibility to determine the need for in-person visits based on patient and provider comfort level or lack of access to technology necessary for teleneurology visits. Because of the COVID-19 pandemic providers were encouraged to use telemedicine as the default modality. As a result, 59.14% (15,839 of 26,784 visits) of all completed outpatient visits in the neurology department were conducted through videoconference, and an additional 10.82% (2,898 visits) were conducted through telephone. Each week an e-mail reminder was sent to all providers to complete the questionnaire; a hyperlink and QR code to the REDCap survey were also distributed. Responses recorded >14 days after the visit were removed from the analysis as this was considered to be too long to recall details necessary to reliably answer survey questions. Questionnaires were requested between April 25 and August 6, 2020.
Statistical Analysis
Data were analyzed, and summary statistics were determined using Stata (StataCorp. 2015. Stata Statistical Software: Release 14; StataCorp LP, College Station, TX, USA). Figures were created in Prism (GraphPad Software, San Diego, CA;
Standard Protocol Approvals, Registrations, and Patient Consents
This project was reviewed and determined to qualify as quality improvement by the University of Pennsylvania's Institutional Review Board. Therefore, informed consent was not obtained.
Results
Survey Completion Summary
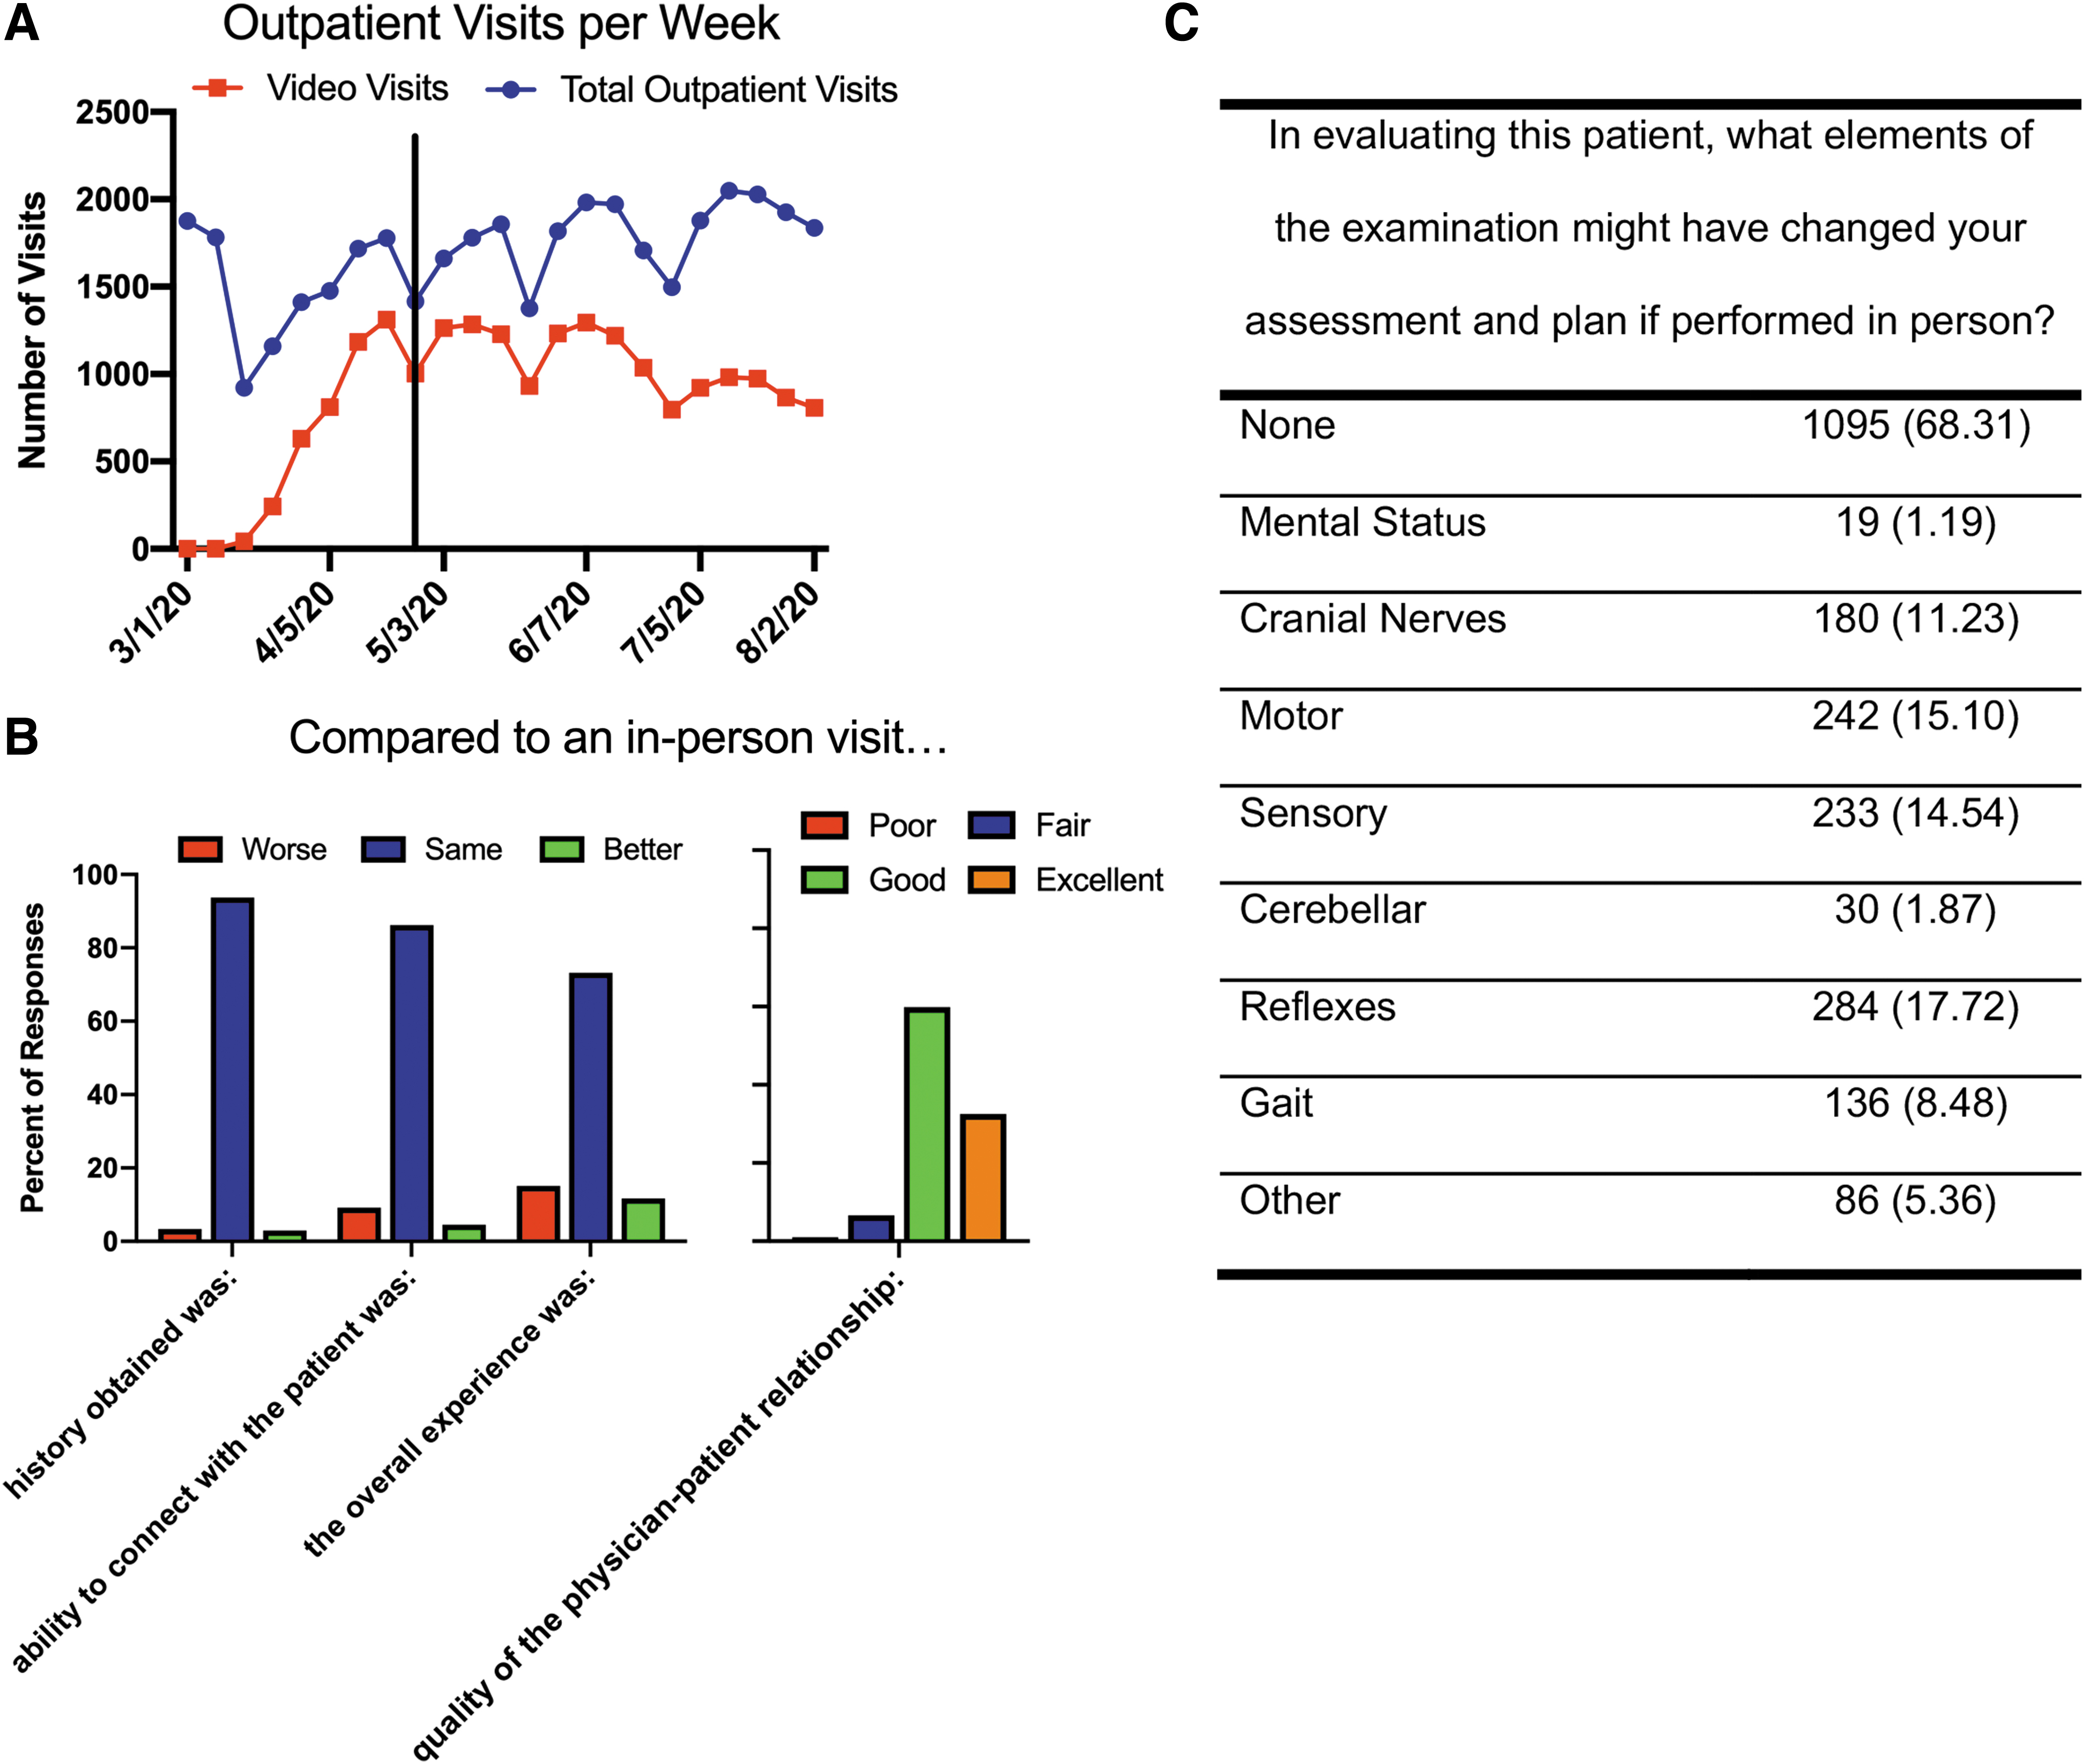
Surveys were completed between the period of April 25 and August 6, 2020. During this time period, 15,839 teleneurology video visits were conducted throughout the neurology department, and 1,697 surveys were completed. Figure 1A shows the weekly number of total outpatient and teleneurology outpatient visits completed during March to August 2020. Nonvideo visits were comprised of in-person and telephone-only visits. Survey records were removed from this analysis for the following reasons: no shows (N = 2, 0.12%), telephone-only entries (N = 20, 1.78%), incomplete entries (N = 1, 0.06%), duplicate entries (N = 29, 1.71%, the first completed survey was retained), responses >2 weeks after the visit (N = 16, 0.94%), and inpatient encounters (N = 26, 1.53%). Ninety-four entries (5.54% of total entries) were removed leaving 1,603 surveys of completed, outpatient, videoconference encounters, representing 10.12% of the total teleneurology video visits.
Teleneurology visits and provider impressions across the University of Pennsylvania Hospital System.
Provider and Encounter Summary
Fifty-five providers completed the survey at least once representing 33.95% of the providers requested to complete the survey. Among providers, 31 (56.36%) were male, and 24 (43.63%) were female. Four Certified Registered Nurse Practitioners (7.27% of providers who responded to the survey), 1 genetic counselor (1.81%), 8 resident physicians (14.54%), and 42 attending physicians (76.36%) completed the survey. The median years of provider experience (calculated as the time in years since terminal degree graduation) was 11 years (interquartile range [IQR] 7–24.5 years). Providers are represented from 10 different departmental divisions, including MS (N = 6, 10.91% of providers who responded to the survey), Headache (N = 1, 1.82%), Vascular (N = 10, 18.18%), Cognitive (N = 2, 3.64%), Movement Disorders (N = 8, 14.55%), General Neurology (N = 12, 21.82%), Neuromuscular (N = 2, 3.64%), Neuro-ophthalmology (N = 1, 1.81%), Epilepsy (N = 5, 9.09%), and Traumatic Brain Injury (N = 1, 1.81%), and 7 (12.72%) are neurology residents. Five providers completed >100 surveys, each accounting for 43.61% of the total data; 27 providers completed <10 surveys each. The median number of survey responses per provider was 9 (IQR 4–34.5, range 1–173). The top five responders were all providers with no prior telemedicine experience.
Seventy-four percent of entries were completed on the same day as the encounter, and 98% were completed within 1 week. The longest difference between visit date and data entry date was 12 days. Three hundred thirty-nine (21.21%) of the encounters were new patient or consultation visits, 1,259 (78.79%) were established patient visits, and 4 (0.25%) had missing billing or no charges associated. One hundred (6.23%) survey responses were completed for patients who were seen more than once during the survey collection period; one patient was seen four times and 48 patients were seen twice during the study period. Providers from the MS division completed 266 surveys (16.59% of all surveys recorded), 94 from Headache (5.86%), 160 from Vascular (9.98%), 106 from Cognitive (6.61%), 404 from Movement Disorders (25.20%), 358 from General Neurology (22.33%), 120 from Neuromuscular (7.49%), 1 from Neuro-ophthalmology (0.06%), 37 from Epilepsy (2.31%), 8 from Traumatic Brain Injury (0.50%), and 49 from neurology residents (3.06%).
Patient Characteristics
One thousand six hundred three survey responses were recorded from 1,548 unique patients. Eight hundred sixty-nine survey responses (56.14%) were from encounters with female patients (four were missing sex information). Patients had a mean age of 53.22 (± 17.93), with a range of 18–95 years. Patients self-reported their race as follows: 1,112 (71.83%) White, 218 (14.08%) Black or African American, 38 (2.45%) Asian, 4 (0.26%) American Indian or Alaskan Native, and 176 (11.37%) other or not reported. Forty (2.58%) patients self-reported Hispanic Latino ethnicity. The majority of the visits (79%) were with established patients known to the providers. Fewer examinations in new patients were rated as “none” for the elements of the examination that might have changed the assessment and plan if performed in person. New and established visits were rated similarly when combining good/excellent or same/better responses, but excellent and better ratings favored established patients.
Technical Aspects Summary
Bluejeans, the UPHS preferred platform during the pandemic, was the videoconference platform used most frequently (1,534 encounters, 95.70% of survey responses). Use of FaceTime (33, 2.06%), Doximity (33, 2.06%), Vidyo (1, 0.06%), and Zoom (1, 0.06%) was also reported. Platform was missing for one survey. Patient device was reported for 1,144 survey responses. Smart phones (654 encounters, 57.17% of survey responses) and laptops (319, 27.88%) were the most commonly used devices; tablet computer (110, 9.62%) and desktop (61, 5.33%) were reported less frequently. The video quality was adequate for 1,461 (91.14%) of encounters, while audio quality was adequate for 1,482 (92.45%) of encounters. The time required to complete each visit compared with an in-person examination was reported to be less in 32.56% (522 responses), the same in 61.63% (988 responses), and more in 5.80% (93 responses). Incomplete encounters, encounters converted from videoconference to telephone, and cancelled appointments due to technical problems were not captured in this survey.
Provider Impression Survey
Providers' overall impressions are summarized in Figure 1B, and impressions about the teleneurology examination are summarized in Figure 1C. The quality of the provider–patient relationship during the teleneurology encounter was reported to be excellent in 522 (32.56%), good in 960 (59.89%), fair in 106 (6.61%), and poor in 15 (0.94%) of encounters. Compared with an in-person visit, the overall telemedicine experience was rated as better in 187 (11.67%), same in 1,173 (73.18%), and worse in 243 (15.16%) encounters. Responses based on patient and provider characteristics are shown in Tables 2 –5 . The frequency of “None” in response to “What elements of the examination might have changed your assessment and plan if performed in person?” differed based on providers' years of experience [χ 2 (3, 1603) = 33.58, p = 0.000], visit type [χ 2 (1, 1598) = 14.80, p = 0.004], and division [χ 2 (9, 1603) = 90.34, p = 0.000]. Post hoc analyses by observing standardized (Pearson) residuals demonstrate lower “None” responses (standardized residual <−2) among providers with 20–29, and ≥30 years of experience, for new patient visits, and among General and Neuromuscular division visits. Higher “None” responses (standardized residual >2) were identified for providers with 10–19 years of experience, and among MS, Headache, Movement Disorders, and Cognitive division visits (Table 2). The frequency of “Same” or “Better” overall experience with telemedicine compared with in-person visits differed based on providers' years of experience [χ 2 (3, 1603) = 10.42, p = 0.015], with lower “Same” or “Better” responses in the 20–29 years of experience group (Table 5). No additional significant effects of provider years of experience, month of visit, visit type, or division groups on the history, ability to personally connect, provider–patient relationship, or overall experience were detected.
Provider Impressions About the History and Examination During Teleneurology Encounters
Numbers represent number of responses (percentage of group).
None refers to N (%) of those responding “None” to the question “In evaluating this patient, what elements of the examination might have changed your assessment and plan if performed in person?” Established includes nonbilled visits.
N = 1,598 due to missing billing code data.
Other includes neuro-ophthalmology and traumatic brain injury due to low response rate among these divisions.
Indicates p < 0.05 on omnibus χ 2 test.
MS, multiple sclerosis and neuroimmunology; NM, neuromuscular.
Provider Impressions About the Ability to Personally Connect During Teleneurology Encounters
Numbers represent number of responses (percentage of group).
N = 1,598 due to missing billing code data.
Other includes neuro-ophthalmology and traumatic brain injury combined due to low response rate among these divisions. Established includes nonbilled visits. No. of responses per group is found in Table 3. No significant differences in the frequencies of those reporting the same or better were detected within groups for all provider or patient characteristics.
Provider Impressions About the Quality of the Provider–Patient Relationship During Teleneurology Encounters
Numbers represent number of responses (percentage of group).
N = 1,598 due to missing billing code data.
Other includes neuro-ophthalmology and traumatic brain injury combined due to low response rate among these divisions. Established includes nonbilled visits. No. of responses per group is found in Table 3. No significant differences in the frequencies of those reporting good or excellent were detected within groups for all provider or patient characteristics.
Provider Impressions About the Overall Teleneurology Experience
Numbers represent number of responses (percentage of group).
N = 1,598 due to missing billing code data.
Other includes neuro-ophthalmology and traumatic brain injury combined due to low response rate among these divisions. Established includes nonbilled visits. No. of responses per group is found in Table 3. No significant differences in the frequencies of those reporting the same or better were detected within groups for all provider or patient characteristics.
Indicates p < 0.05 on omnibus χ 2 test.
Discussion
We surveyed the experience of providers performing teleneurology visits during the SARS CoV-2 pandemic when most patient interactions in our department were performed by telemedicine. In addition to overall impressions and technical adequacy, we asked providers to compare the ability to connect with patients and the quality of the relationship with the patient to in-person visits. We also asked whether any limitations of the neurological examination by telemedicine might have altered the impression or plan. We had a wide representation of providers across the neurology department encompassing multiple subspecialties. Surveys were completed by physicians, nurse practitioners, residents, and genetic counselors.
Several previous surveys of teleneurology encounters focused on patient experiences or provider satisfaction. 19 –22 We were unable to find any surveys that asked about elements of the neurological examination or focused on the patient–provider interaction. Many surveys assessed global impressions of teleneurology in a one-time questionnaire in contrast to our survey that was completed after each individual encounter. 23,24 A recent study of 2,589 telehealth encounters including 2,093 audio/video visits in a pediatric neurology population assessed provider and patient satisfaction using questions embedded in an electronic medical record (EMR) template. Telemedicine was considered satisfactory by providers in 93% of encounters, and an in-person assessment was thought to be required in 5%. 25
The inability to perform a complete examination and to connect with patients is often reason physicians resist using telemedicine. Our survey sought to examine these issues in a wide spectrum of neurological conditions. Since almost all patients regardless of diagnosis were seen by telemedicine during this time interval, patients were not selected for telemedicine based on their appropriateness for a remote visit.
Several interesting trends emerged from the survey results. First, 68% of responses stated that none of the elements of the neurological examination if performed in person would have changed the assessment and plan. This suggests that in the majority of cases, the neurological examination by telemedicine is adequate for diagnosis and management decisions. The motor (15%) and reflex (18%) components of the examination were most frequently considered suboptimal. Utility of the teleneurology examination can be influenced by patient, provider, or visit characteristics and may differ between subspecialties. Indeed, these results demonstrate that during new patient encounters, General or Neuromuscular division visits, or visits with more experienced providers, providers more frequently reported that an in-person examination may have influenced the plan. Less experienced providers and during MS, Headache, Movement Disorders, or Cognitive division visits, providers were more likely to report that an in-person examination would not have influenced the plan. Reflexes are not typically performed by telemedicine, and it is difficult to quantify the motor examination. Although the examination was considered to be adequate in roughly two-thirds of encounters, the remaining one-third were still considered insufficient. For those cases, the teleneurology examination could serve as a screen with close in-person follow-up. In addition, simple maneuvers could improve the teleneurology examination. For instance, lifting household objects as weights has been suggested to remotely grade strength. 26 Although the examination was considered inadequate in one-third of teleneurology encounters, further analysis could identify patients better served by an in-person examination and may lead to innovative approaches to teleneurology. The results of this survey suggest the motor and sensory examinations as areas where novel techniques for improving remote examinations might be focused.
Second, the quality of the provider–patient interaction and ability to connect with the patient were considered the same or better than an in-person examination in almost all encounters. This finding contradicts the impression that telemedicine encounters are impersonal, and lack empathy and compassion. Telemedicine visits at home may provide insights into patient activities and personalities not available during office visits. Patients were noted to demonstrate artwork or play music for their physician, which would be unlikely to occur in person. Third, the time for teleneurology visits was assessed to be the same or less than an in-person visit in 94% of encounters, dispelling the impression that the technology adds complexity and reduces efficiency. Fourth, established patient visits were rated better than in-person or excellent at a higher frequency than new patient visits across most questions asked, suggesting that established visits might be a more effective use of teleneurology.
Finally, the overall experience was the same as an in-person visit in 73% of visits and better in 12%. Assessment of the visit as the same or better than an in-person visit increased from 83% in April to 89% in July, suggesting that satisfaction with teleneurology visits increased with experience. Teleneurology may not be equally applicable across neurology subspecialties; Headache (91%), MS (96%), and Movement Disorder (89%) providers had the most ratings of same or better overall experience and Neuromuscular providers the lowest (60%), although there was not a significant group effect of division on the omnibus statistical tests.
There are several limitations to our survey. The survey instrument was written by the investigators and has not been validated. Although 55 providers completed surveys, 43% were submitted by the top 5 providers. There may be a sampling bias with providers with favorable views of teleneurology being more likely to complete the survey. In addition, the response rate was 10%, suggesting that these results may not be representative of the entire neurology department. The responses represent the opinion of the provider, and there were no objective measures of visit time or audio/video quality. The survey was completed only for successful audiovisual telemedicine visits and not audio-only or cancelled encounters due to technology failures. In addition, our center redeployed research staff to conduct previsit technology checks to improve compliance with the teleneurology platform. These may have influenced the responses to technical aspects of these visits. Responses were not collected for incomplete encounters, including those that were unsuccessful due to technical challenges. Surveys were not completed for all teleneurology visits during this interval, and the opinions of those not completing surveys may differ from those submitted. Finally, these data were collected during the SARS CoV-2 pandemic when the alternatives to teleneurology were delaying visits, cancelling visits, or completing visits in person with the added risk of infectious transmission. These factors may have influenced providers' opinions about teleneurology visits.
Our survey represents one of the largest samples of provider impressions of teleneurology across a multispecialty adult neurology department during a period when almost all outpatient encounters were performed by telemedicine. The results indicate substantial overall satisfaction and technical adequacy. In most cases the ability to connect with patients was at least the same as in-person visits. The most frequent components of the neurological examination that might have changed the impression or plan if performed in person were the motor and reflex examinations; however in 68% of visits, no examination elements would have altered the conclusions. Further analysis of differences between subspecialties, provider experience, and diagnosis should help define the optimal utilization of telemedicine when both in-person and remote options are equally available.
Conclusion
Provider impressions about the teleneurology history, examination, and provider–patient relationship are generally favorable in this quality-improvement study. These findings are important for the widespread use of teleneurology during the SARS CoV-2 pandemic and for the development of teleneurology applications in the future. Differences between provider responses based on specialty and visit characteristics suggest areas for future research to improve the teleneurology experience.
Footnotes
Authors' Contributions
All authors were involved in the design and conceptualization of the study. Drs Tropea, Fuentes, Roberts, and Wechsler were involved in data analysis. Dr. Tropea drafted the article. All authors reviewed and edited the article. Dr Wechsler finalized the article.
Acknowledgments
We thank our patients and all of the neurology providers in the Department of Neurology for their generous time in completing questions, and Christina Blum, MD for her assistance in creating the teleneurology provider survey.
Data Availability Statement
Data will be made available by requesting access from the corresponding author.
Disclosure Statement
No competing financial interests exist.
Funding Information
Funding was provided by the Department of Neurology, Perelman School of Medicine, University of Pennsylvania. Dr Tropea is additionally funded by the NINDS (K23-NS114167-01A1).