
Abstract
Introduction:
Telehealth is becoming integral to health care delivery, which may create a higher need for better internet. This is the first study to examine whether users are willing to spend more on their internet if they are (1) more experienced in using telehealth, (2) more optimistic about telehealth benefits, and (3) less concerned about the difficulty of using telehealth.
Methods:
We surveyed 5,200 Americans about their willingness to pay (WTP) for internet speed and quality on the one hand, and their (1) prior use of telehealth, (2) opinion about the benefits of telehealth, and (3) opinion about the difficulties of using telehealth. We stratified the sample using the three aspects above and conducted a conjoint analysis to estimate the WTP for internet speed and quality within each stratum.
Results:
Compared with respondents who had never used telehealth, respondents who had used five to six different types of telehealth services were willing to spend 50.4% more on their internet plans. Users who most firmly believed in the benefits of telehealth were willing to spend 59.2% more than the most pessimistic users. Users who had the lowest concerns about the difficulty of using telehealth were willing to spend 114% more than users with the most perceived difficulty.
Discussion:
We found strong ties between the WTP for internet and prior telehealth use and perceptions of telehealth benefits and barriers. Thus, internet expenditures may be influenced by users' anticipation of using telehealth. Future studies may investigate the causality of the relationship.
Highlights
Internet users with prior telehealth experience have a higher willingness to pay (WTP) for internet.
Those who find telehealth beneficial have a higher WTP for internet.
Those who find telehealth difficult to use have a lower WTP for internet.
Introduction
Telehealth has rapidly expanded in recent years, allowing patients to receive care from the convenience of their homes and avoid unnecessary and costly travel. 1,2 Besides, the remote nature of telehealth is a new setting that may facilitate communication in sensitive subjects such as abortion and that patients may feel uncomfortable discussing in-person. 3 Telehealth reduces the burden on the health care system by shortening hospital stays, 4 freeing up hospital resources, 2 and helping contain disease outbreaks by reducing the need for personal contact. 2 Telehealth seems to be delivering all the above while achieving comparable outcomes to in-person care in terms of patient satisfaction 5,6 and health care quality outcomes such as the rate of readmission, hospital visits, and attendance. 7
A precondition for patients to use telehealth is having access to a reliable internet connection. Studies have shown that users are willing to spend higher amounts to enjoy faster or higher quality internet. 8 –11 Willingness to pay (WTP) is the highest price a person is willing and able to pay for a given product or feature. 8,12 An interesting question is whether users have a higher WTP for internet if they expect to use telehealth. Not only do users have different needs and preferences that may affect their WTP, but likely those who expect to use telehealth more often have a higher WTP than those who are less likely to need telehealth.
To the best of our knowledge, the literature has not answered the above questions, and it is unclear whether and to what extent the prospect of using telehealth affects users' WTP for internet services. The literature has estimated the WTP for internet services in the United States, 8,11,13 Japan, 14 Nigeria, 15 and Indonesia. 16 There are also studies suggesting that people are concerned about the cost of telehealth 17 and that they are willing to spend money to have telehealth access. 18,19 That said, a systematic WTP study that measures the ties between WTP and telehealth use will help marry the above two lines of literature. Another unexplored dimension is whether users' WTP for internet services is affected by their opinion on telehealth. The literature has established that there are significant benefits gained in using telehealth 20 while substantial barriers and challenges to telehealth adoption persist. 6,21,22 Two important research avenues in this area include: (1) are users willing to spend more on their internet if they believe more firmly in the benefits of telehealth? and (2) is this WTP smaller for users who find it more difficult to use telehealth? These questions are of high policy relevance and yet unexplored.
That said, the goal of this study was to answer these questions by estimating the variations in the WTP for internet services based on (1) users' prior experience in using telehealth, (2) opinion on the benefits and facilitators of telehealth, (3) and perceived difficulties and challenges that may hinder telehealth use. To answer these questions, we created a unique survey in which we asked respondents about their WTP for internet services on the one hand, and their perceptions of and experience with telehealth services on the other. We deployed the survey in four U.S. states and collected the responses of 5,200 individuals. We implemented a conjoint analysis to turn the survey data into measurable utility levels and implemented the WTP estimation model of Rabbani et al. 8 to turn the utility measures into monetary WTP estimates.
The study hoped to shed light on the ties between internet access and telehealth use and to support policymakers, internet service providers (ISPs), and health care providers to make more informed decisions. Policymakers and government agencies may use it to better identify user preferences and needs and allocate taxpayer funds more efficiently; ISPs may use it to better identify user needs and offer internet services that better suit telehealth use in terms of internet quality and speed; and health care providers may use such information to measure the value of telehealth and identify ways to reinforce telehealth benefits and resolve the barriers and challenges to facilitate telehealth adoption.
Methods
We introduce the Methods section in three subsections. The Study Design and Sample section provides a brief overview of the data collection process and survey design. The survey solicited crucial data on user preferences for internet price, speed, and quality while also assessing respondents' prior telehealth experiences and their perceived benefits and barriers of telehealth services. In the Conjoint Analysis section, a conjoint analysis model was used to convert the survey-based preferences into numeric measures of utility. Utility, measured in “utils,” reflects the satisfaction, convenience, and pleasure associated with user access to various internet package features. Utility values can be compared across features and aggregated for different groups of people to draw conclusions about their preferences. The WTP Estimation Model section discusses the WTP estimation model, which converts the utility values into U.S. dollars.
STUDY DESIGN AND SAMPLE
No existing survey was available to answer this study's full set of research questions. So, we developed a custom survey through a multistage process that is described in Appendix A1. Several survey items, however, were drawn from existing instruments. Specifically, the questions related to the benefits and barriers of telehealth were developed based on Fischer et al. 23 and Almathami et al. 24 We developed the survey as part of a program evaluation of the Telehealth Broadband Pilot Program (GA6RH40184). The University of Arkansas for Medical Sciences Institutional Review Board reviewed and classified it as nonhuman subjects research (IRB No. 262566).
Using a Qualtrics panel of participants in May and June 2022, we surveyed 5,200 respondents who were at least 18 years old, lived in one of the four target states (Alaska, Michigan, Texas, or West Virginia), and fully completed the survey. The four states were chosen for their policy relevance in the overall project agenda outlined in the Telehealth Broadband Pilot Program. The studied states have large demographic variations (in terms of population, population density, total and per capita income, internet speed, internet access, etc.) that could justify a nationwide generalization of the findings.
CONJOINT ANALYSIS
We used conjoint analysis to turn respondent preferences to utility. Conjoint analysis is the gold standard in WTP estimation for internet services, 8,16,25,26 as well as other industries such as estimating the WTP for new technologies, 27,28 residential and housing, 29,30 subcompact cars, 31 and more. 32 –43 In a practice similar to Rabbani et al., 8 we introduce conjoint analysis by specifying utility as a function of internet features:

where the utility of package j (Uj
) comprises explained (Vj
) and unexplained (
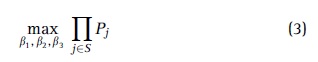
In choosing between internet packages, respondents compared internet package attributes. Better attributes made a package more likely to be selected. We leveraged this logic and used the respondent choices to uncover the utilities that underlie respondent choices. That is, the probability of choosing internet package j (Pj
) is a function of the utility of package j (Vj
) in comparison to the utility associated with all other packages (
In this probability function,
For optimal results, the levels of internet price, speed, and quality that are used in the survey must be reasonably close to the actual levels. That said, we used internet speed levels of 5, 10, 25, and 100 Mbps as numbers that reflect the actual range of speeds in the studied states. 44,45 For a similar reason, we used internet price points of $25, $50, $75, and $100 per month. 46 To effectively communicate quality measures to lay respondents, we simplified internet quality into low, medium, and high quality internet and provided the respondents with simplified explanations about each quality level (Appendix Table A1).
Using a fractional factorial design, we turned the 4 levels of internet price, 4 levels of internet speed, and 3 levels of internet quality into 16 internet packages (Appendix Table A4). Pairwise comparisons of the 16 packages generated 120 choice questions. Table 1 shows two instances of choice questions. Panel A asks the respondents to choose between Package 1 ($100, medium quality, 100 Mbps) and Package 2 ($25, medium quality, 25 Mbps). Neither package is dominated because some respondents may prefer Package 1, while others may prefer Package 2 depending on their preferences, internet needs, or income. In contrast, Panel B presents Package 1 ($75, low quality, 25 Mbps) that is dominated by Package 2 ($50, low quality, 25 Mbps) in the sense that Package 2 offers the same features as Package 1, but at a lower price. Choosing a dominated package is irrational and provided a way to exclude inattentive respondents. Among the 120 choice questions, 54 contained a dominated package.
Two Choice Questions
In Panel A, neither package is dominated; in Panel B, Package 2 dominates Package 1.
To avoid survey fatigue, 47 we randomly split the 120 questions into 8 survey versions, each with 15 choice questions, in a way that each version contains 8–9 questions with nondominated packages (to uncover preferences) and 6–7 questions with a dominated package (to flag inattentive respondents). Survey version 1 is reported in Appendix Table A5. A respondent who responds to the survey at random would pick 3 (3.5) of every 6 (7) dominated options on average. So, we excluded respondents with three or more mistakes to mitigate the effect of inattentive respondents on our results.
Furthermore, we randomized the order in which the 15 questions appeared within each version and randomized the order in which the 2 packages appeared within each question. This was done in the survey design phase, and not per respondent. To ensure that the eight versions used had comparable demographics, we simultaneously collected the responses to all versions. Notably, versions were equally distributed to respondents, but because full completion of the survey was an inclusion criterion, this resulted in unequal versions in the gross sample. All versions were reduced to equal frequencies in the net sample, as explained in the Results section.
Besides the choice experiment, our survey asked each respondent about their prior use of 6 types of telehealth services, their degree of agreement with 7 statements on the benefits and the ease of use of telehealth, and their degree of agreement with 11 statements on the challenges and barriers on the way of using telehealth services. All these questions are listed on Appendix Table A3.
WTP ESTIMATION MODEL
To estimate WTP, we measure the dollar value of one util (D), that is, the amount of money an average respondent is willing to spend to enhance their satisfaction by one util. This can be done using the part-worth utility levels (U $100 and U $25) associated with internet prices $25 and $100: 8
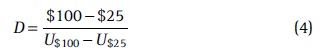
Using D, the WTP to increase speed by 1 Mbps (
and the WTP for upgrading quality by one tier (
Results
Table 2 reports the summary statistics. It stratifies the respondents into six groups based on their prior use of telehealth, from those who have never used any telehealth services (n = 1,225) to those who have used five to six types of telehealth services (n = 207). It also stratifies the respondents based on their opinions on telehealth benefits and barriers. To do so, we turned respondent opinions about the benefits and barriers of telehealth into numeric values using the following scale: strongly disagree (−2), disagree (−1), neither agree or disagree (0), agree (1), strongly agree (2). Summing the numbers associated with seven statements on telehealth benefits created a measure of respondent opinion on the benefits of telehealth that ranged from −14 for the strongest disagreement to 14 for the strongest agreement.
Summary Statistics
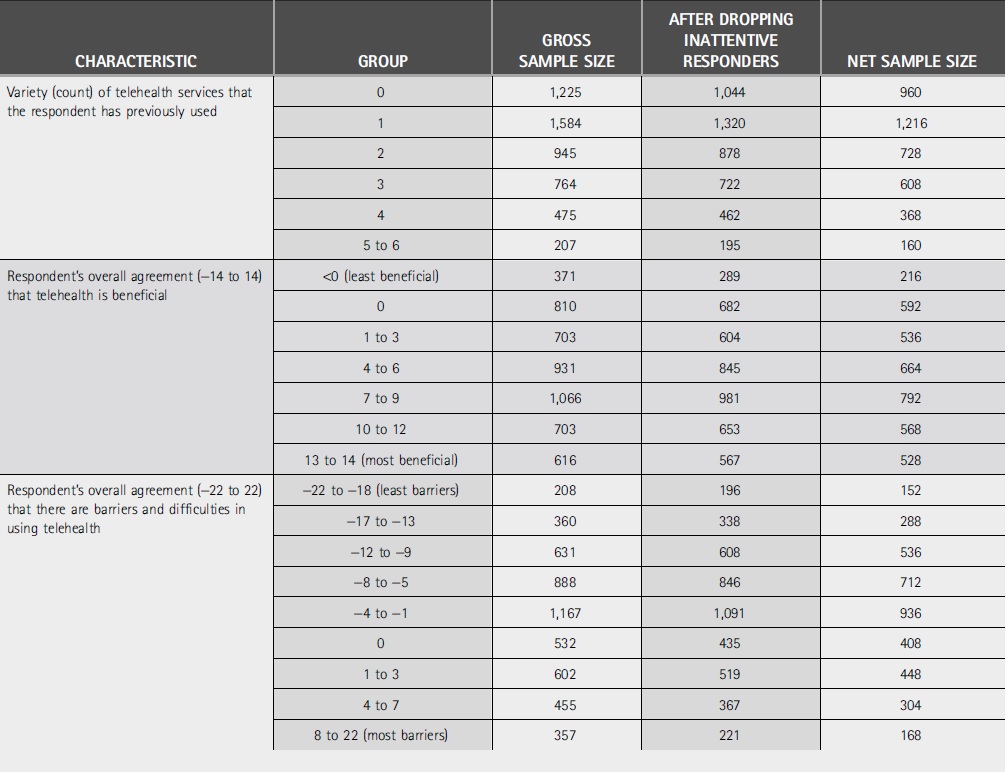
Similarly, summing the numbers associated with 11 statements on telehealth barriers created a measure of respondent opinion on the barriers of telehealth that ranged from −22 for the strongest disagreement to 22 for the strongest agreement. We stratified the respondents into seven ranges of agreement with the benefits (the middle [gray] part of Table 2) and nine ranges of agreement with the barriers (the bottom part of Table 2). This was done in a way that ensured each stratum has sufficient observations.
To turn the gross sample into a net sample, we conducted a two-step exclusion criteria for each row in Table 2. We use Table 3 to demonstrate the exclusion process for the first row of Table 2, that is, for respondents who have never used telehealth services. First, we dropped respondents who chose three or more dominated packages. This reduced the sample size from 1,225 to 1,044. In the second exclusion step, to ensure that all the 120 choice questions appeared in equal frequencies in the analysis, we reduced the number of responses to all 8 versions to an equal count (see Rabbani et al. 8 for more detail). Version 4 had the smallest sample (n = 120). Reducing all other versions at random to 120 observations resulted in a net sample of 960 observations for row 1 in Table 2. We did this process 22 times to produce the net sample for each of the 22 strata in Table 2.
A Demonstration of the Exclusion Criteria
Figure 1 shows the WTP estimates for improving internet quality by one tier (left) and the WTP for increasing internet speed by 1 Mbps (right) stratified by respondents' prior use of telehealth services. The WTP estimates report the amount that respondents are willing to add to their monthly internet bill to improve quality or speed.
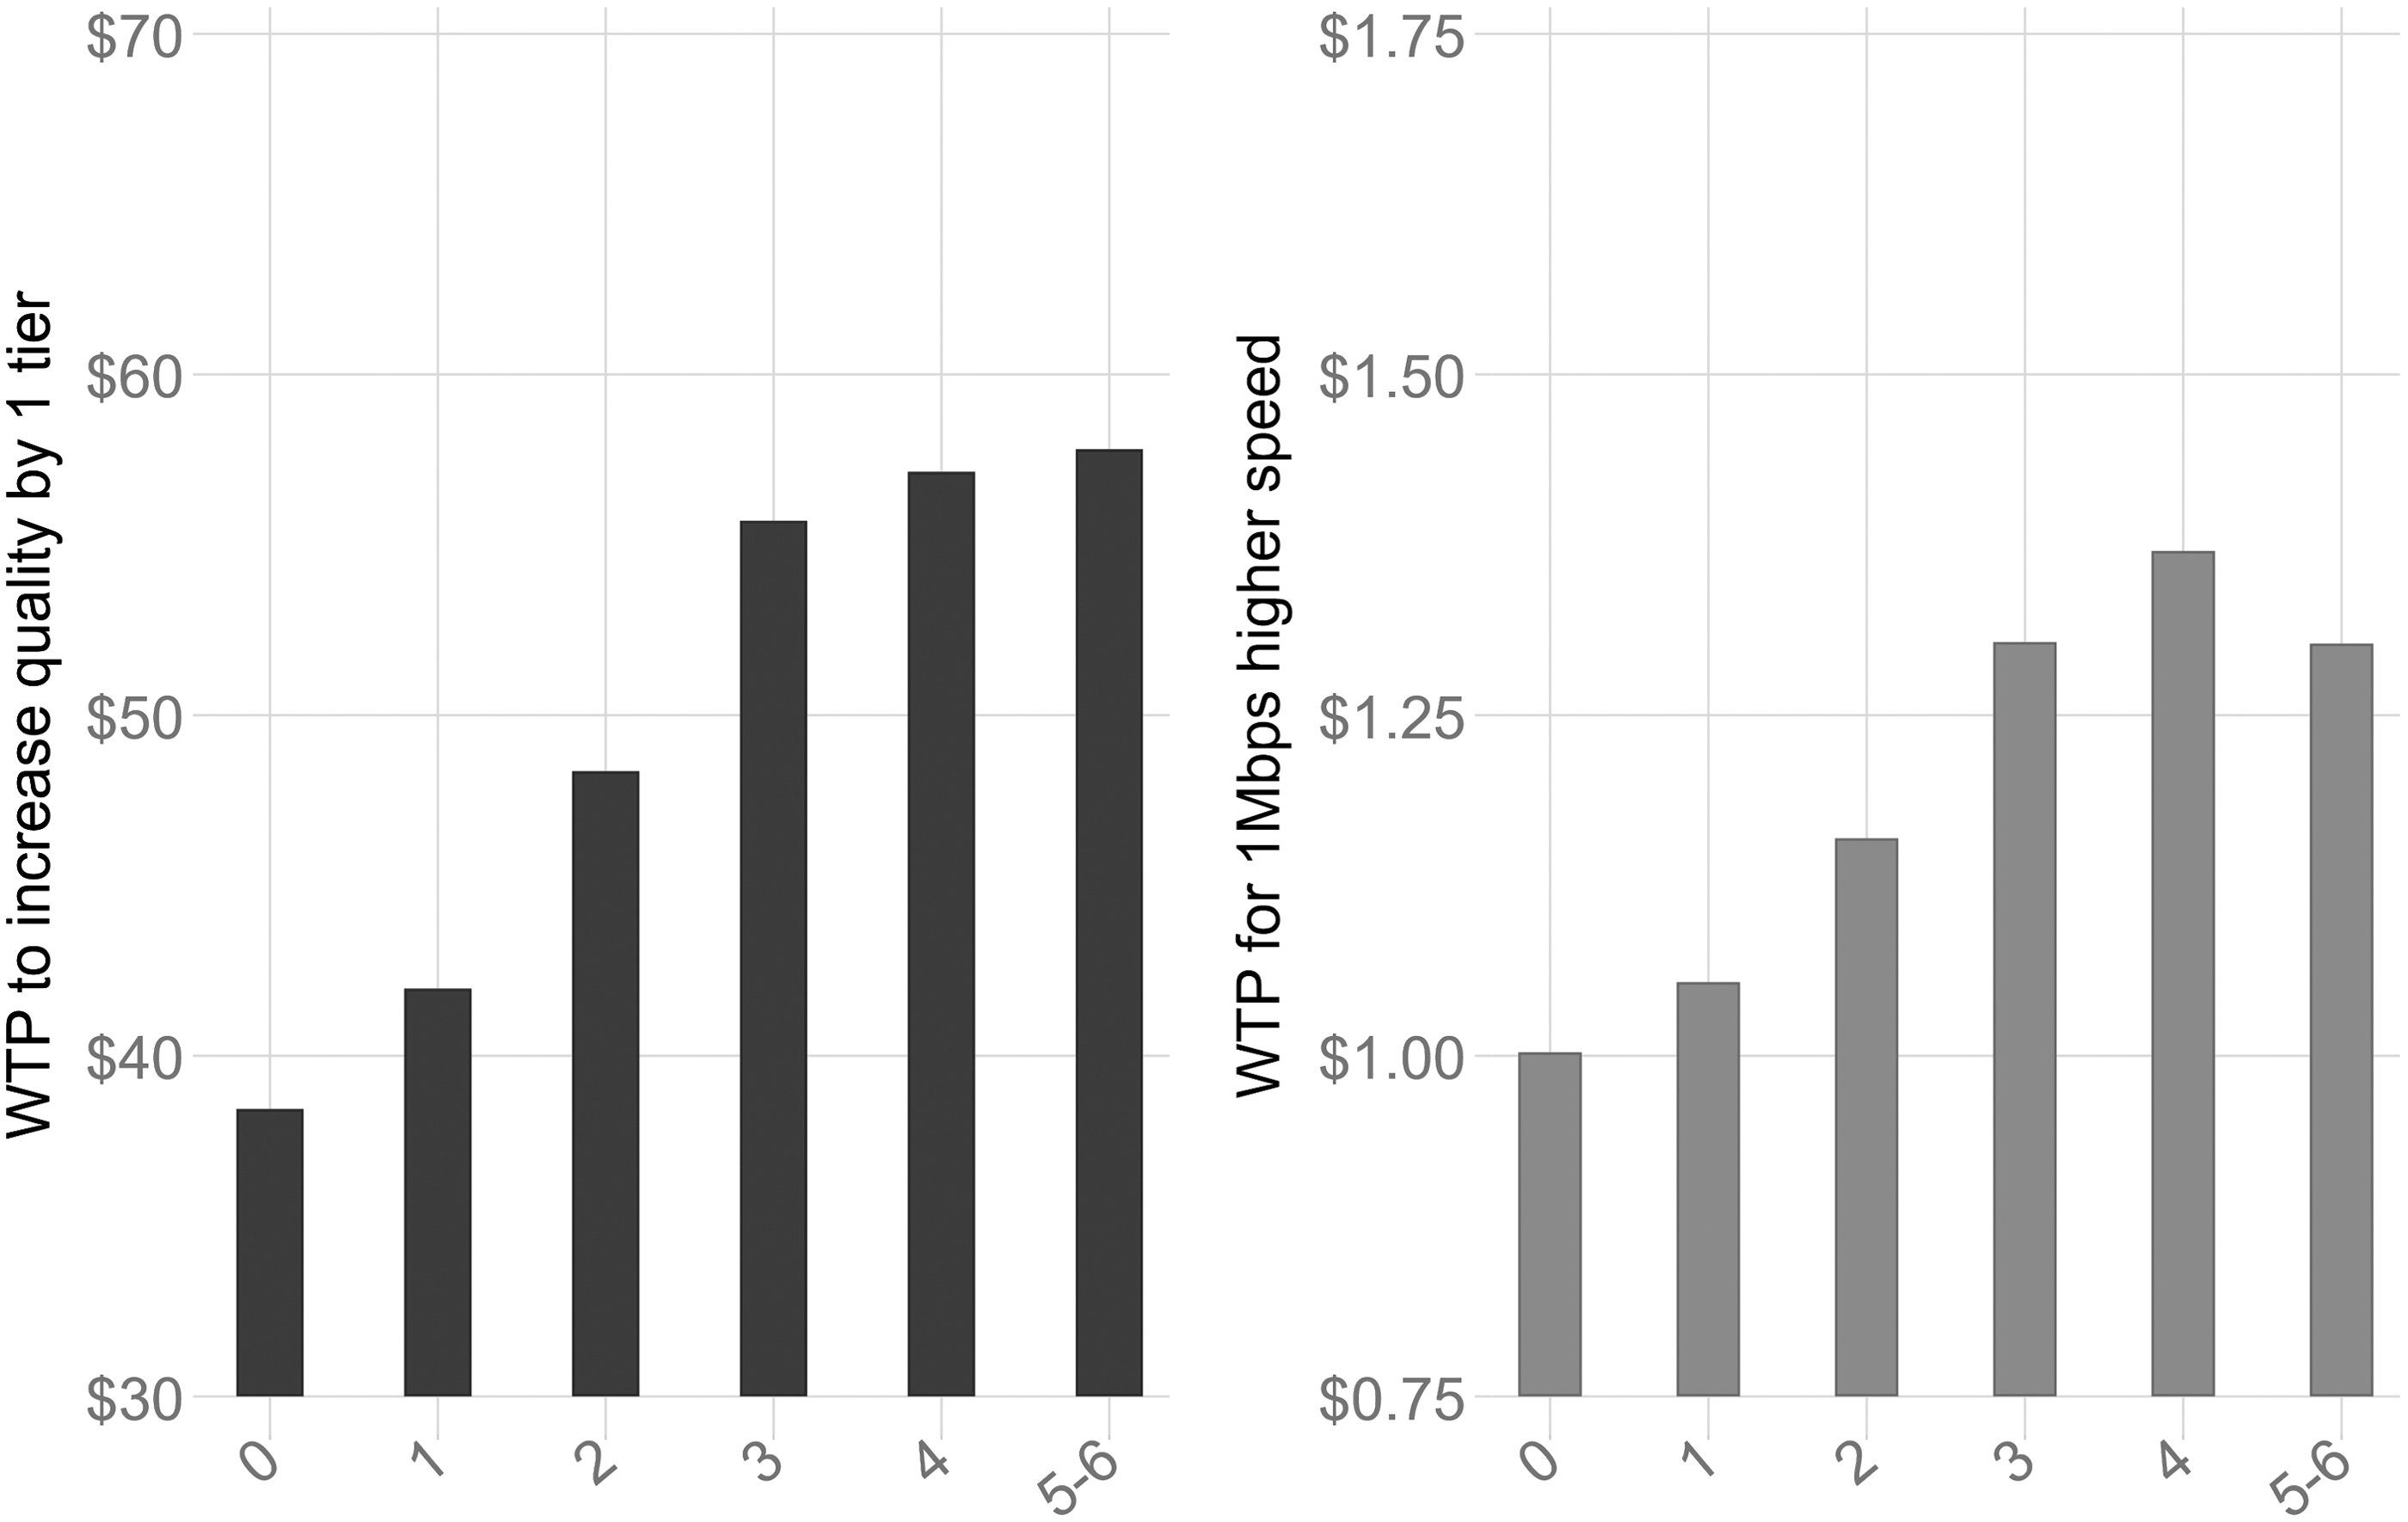
The relationship between the variety of telehealth services that a respondent has used and their WTP for internet quality (left) and speed (right). WTP, willingness to pay.
There is a positive correlation between WTP and users' prior use of telehealth: the WTP for upgrading quality by one tier was $38.44 for those who had never used telehealth, $41.97 for those who had used one type of telehealth services, $48.35 for those who had used two types, $55.71 for three types, $57.14 for four types, and $57.81 for those who had prior experience of using five or all the six types of telehealth services.
In line with the WTP estimates for internet quality, we found a positive correlation between respondents' prior use of telehealth and their WTP for internet speed: for the same respective groups of users, the WTP for 1 Mbps of extra internet speed was $1.00, 1.05, $1.16, $1.30, $1.37, and $1.30.
Figure 2 shows the WTP for internet quality and speed stratified by respondents' degree of agreement that telehealth is beneficial. We found that respondents who had a negative or neutral view about the benefits of telehealth (a score below or equal to zero), respectively, had WTPs of $34.42 and $35.15 for upgrading their internet quality, and WTPs of $0.90 and $0.91 for upgrading their internet speed. The WTP was noticeably higher among those whose agreement scores were in the 1–3 and 4–6 strata: respectively, WTPs of $45.08 and $45.40 for quality, and $1.12 and $1.09 for speed. Users with stronger positive opinion about the benefits of telehealth reported to be progressively more willing to spend on their internet: those with a score in the 7–9, 10–12, and 13–14 strata, respectively, had WTP values of $48.91, $53.51, and $54.81 for internet quality as well as WTP values of $1.11, $1.28, and $1.42 for internet speed. These estimates, overall, provide strong evidence that users who more firmly believe that telehealth is beneficial and easy to use are markedly more willing to spend to upgrade their internet speed and quality.
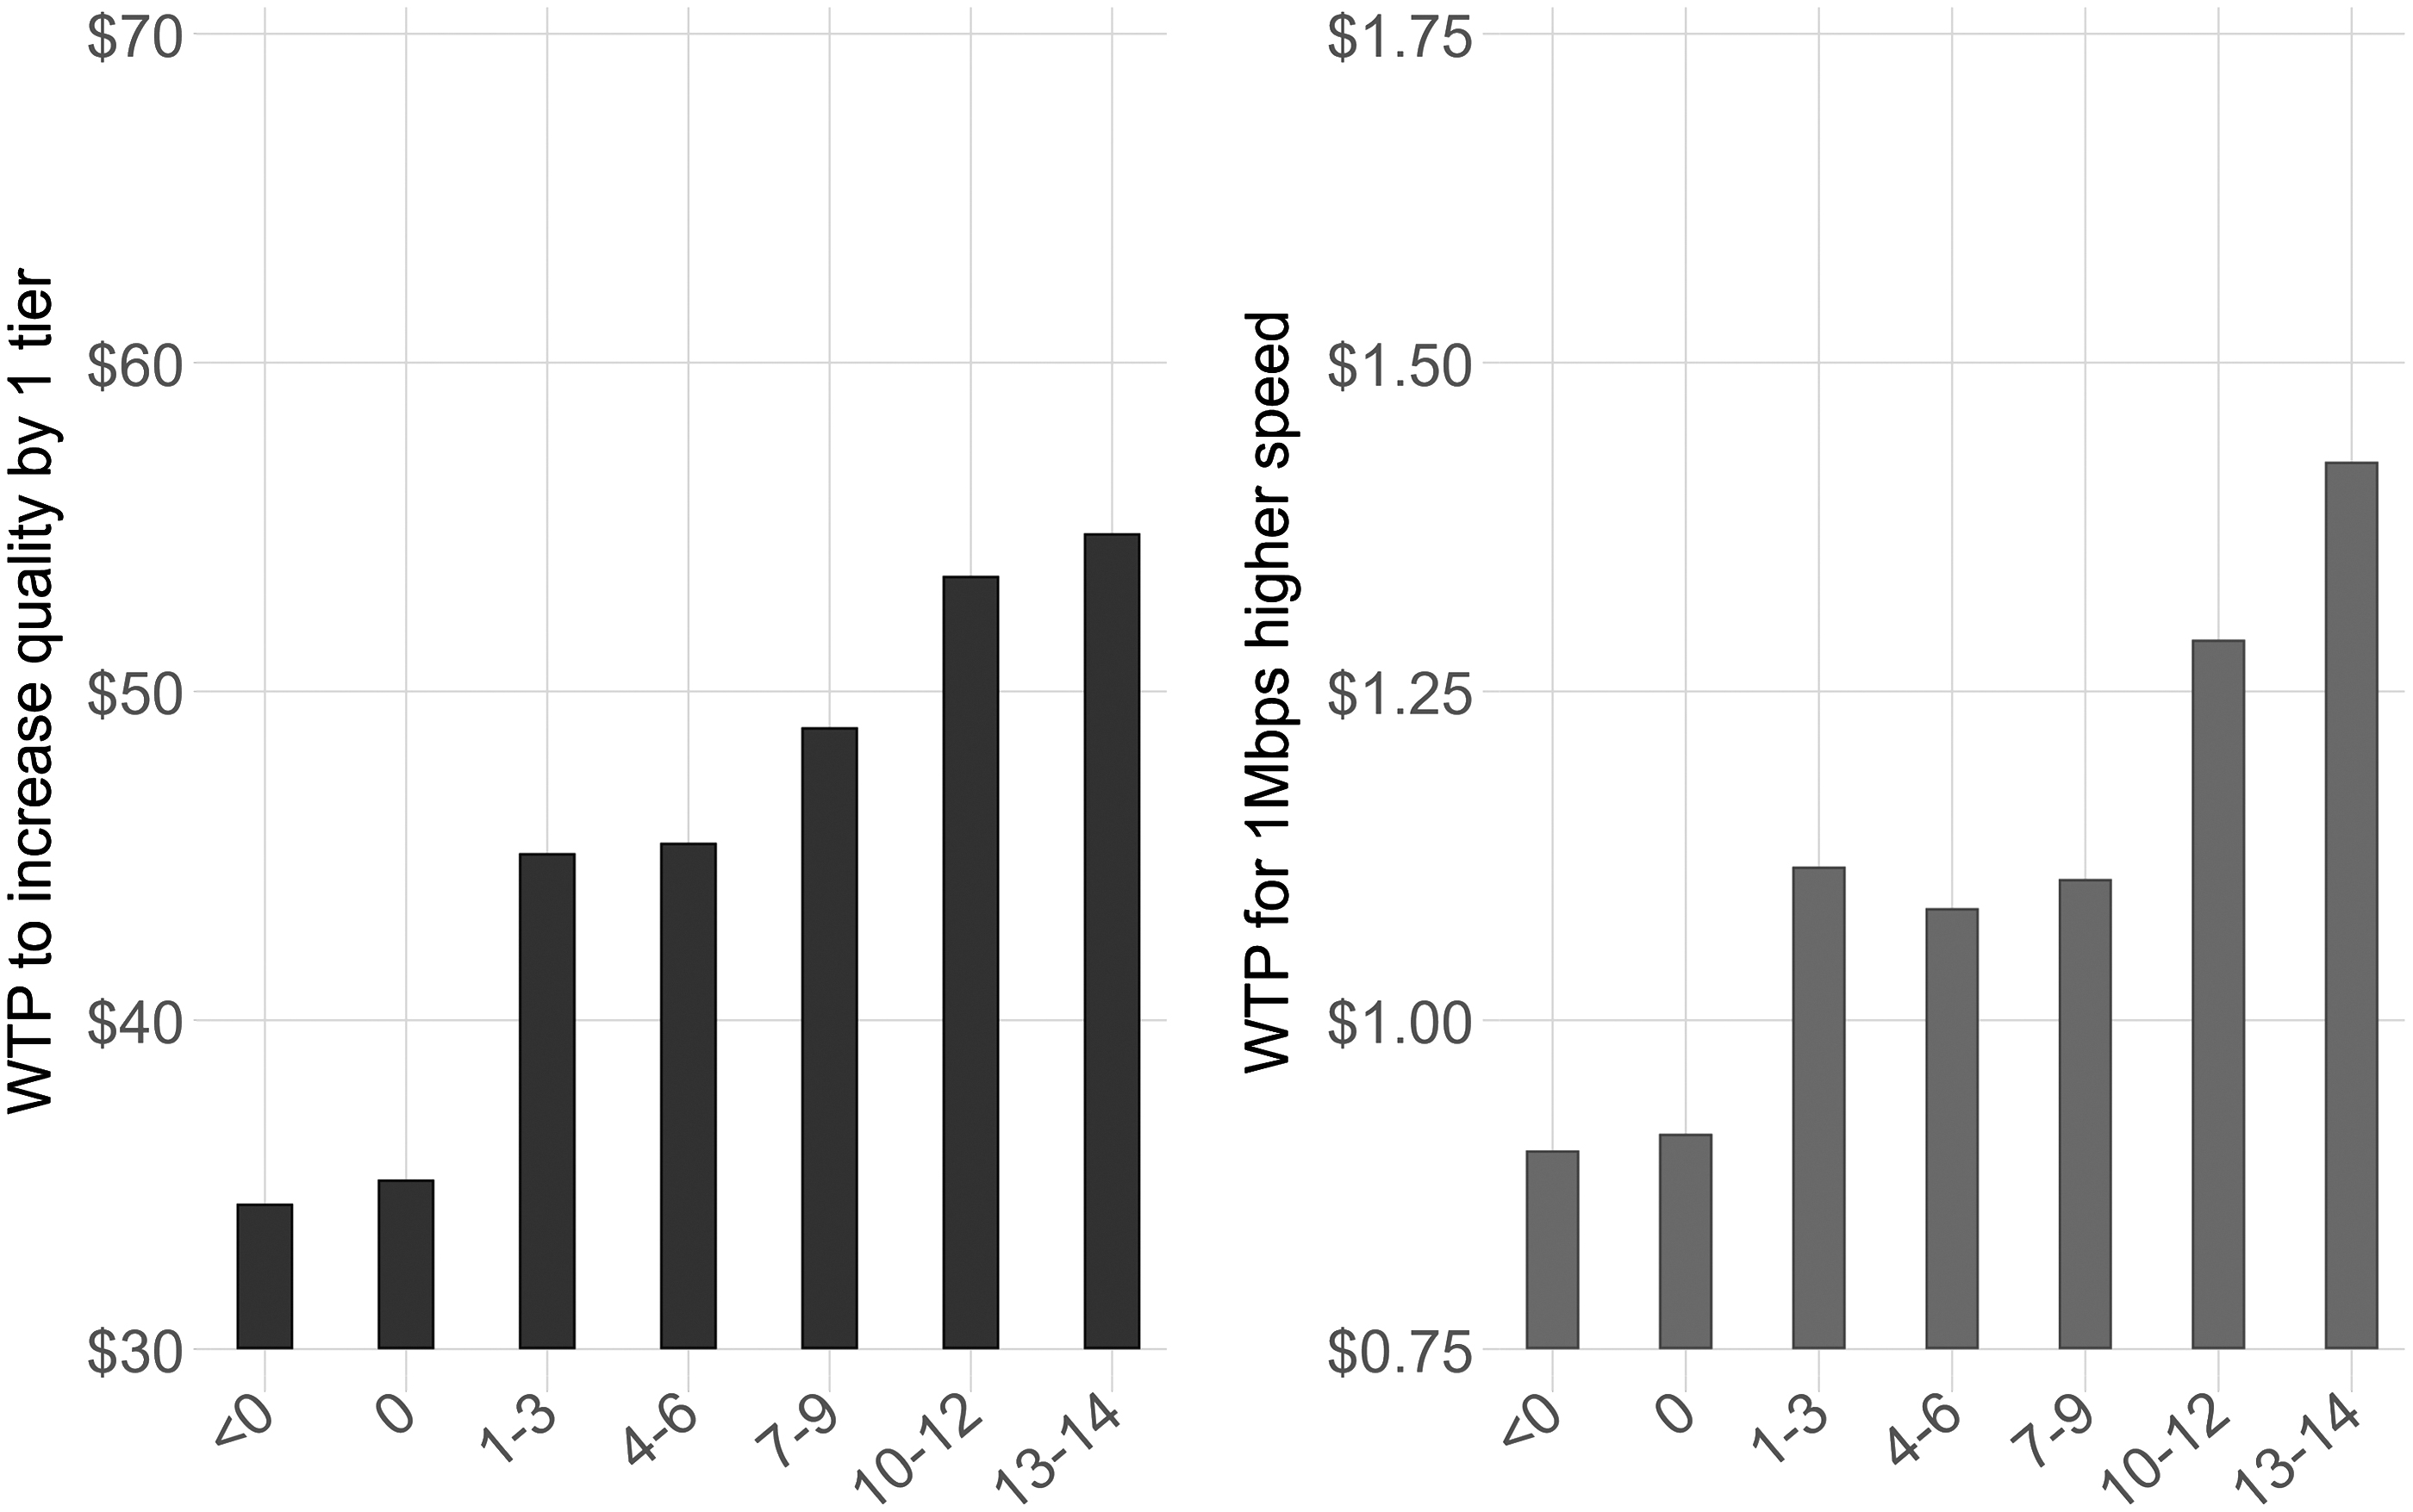
The relationship between respondent attitude about the benefits of telehealth (from −14 for least beneficial to 14 for most beneficial) on the horizontal axis and the WTP for internet price and quality ($/month) on the vertical axis.
Figure 3 shows the WTP for internet quality and speed stratified by respondents' degree of concern that telehealth is difficult to use or there are barriers that may hinder telehealth utilization. The first stratum comprised those who scored between −22 and −18. These respondents, who were least concerned about the challenges and barriers, had WTPs of $74.31 for internet quality and $1.81 for internet speed.
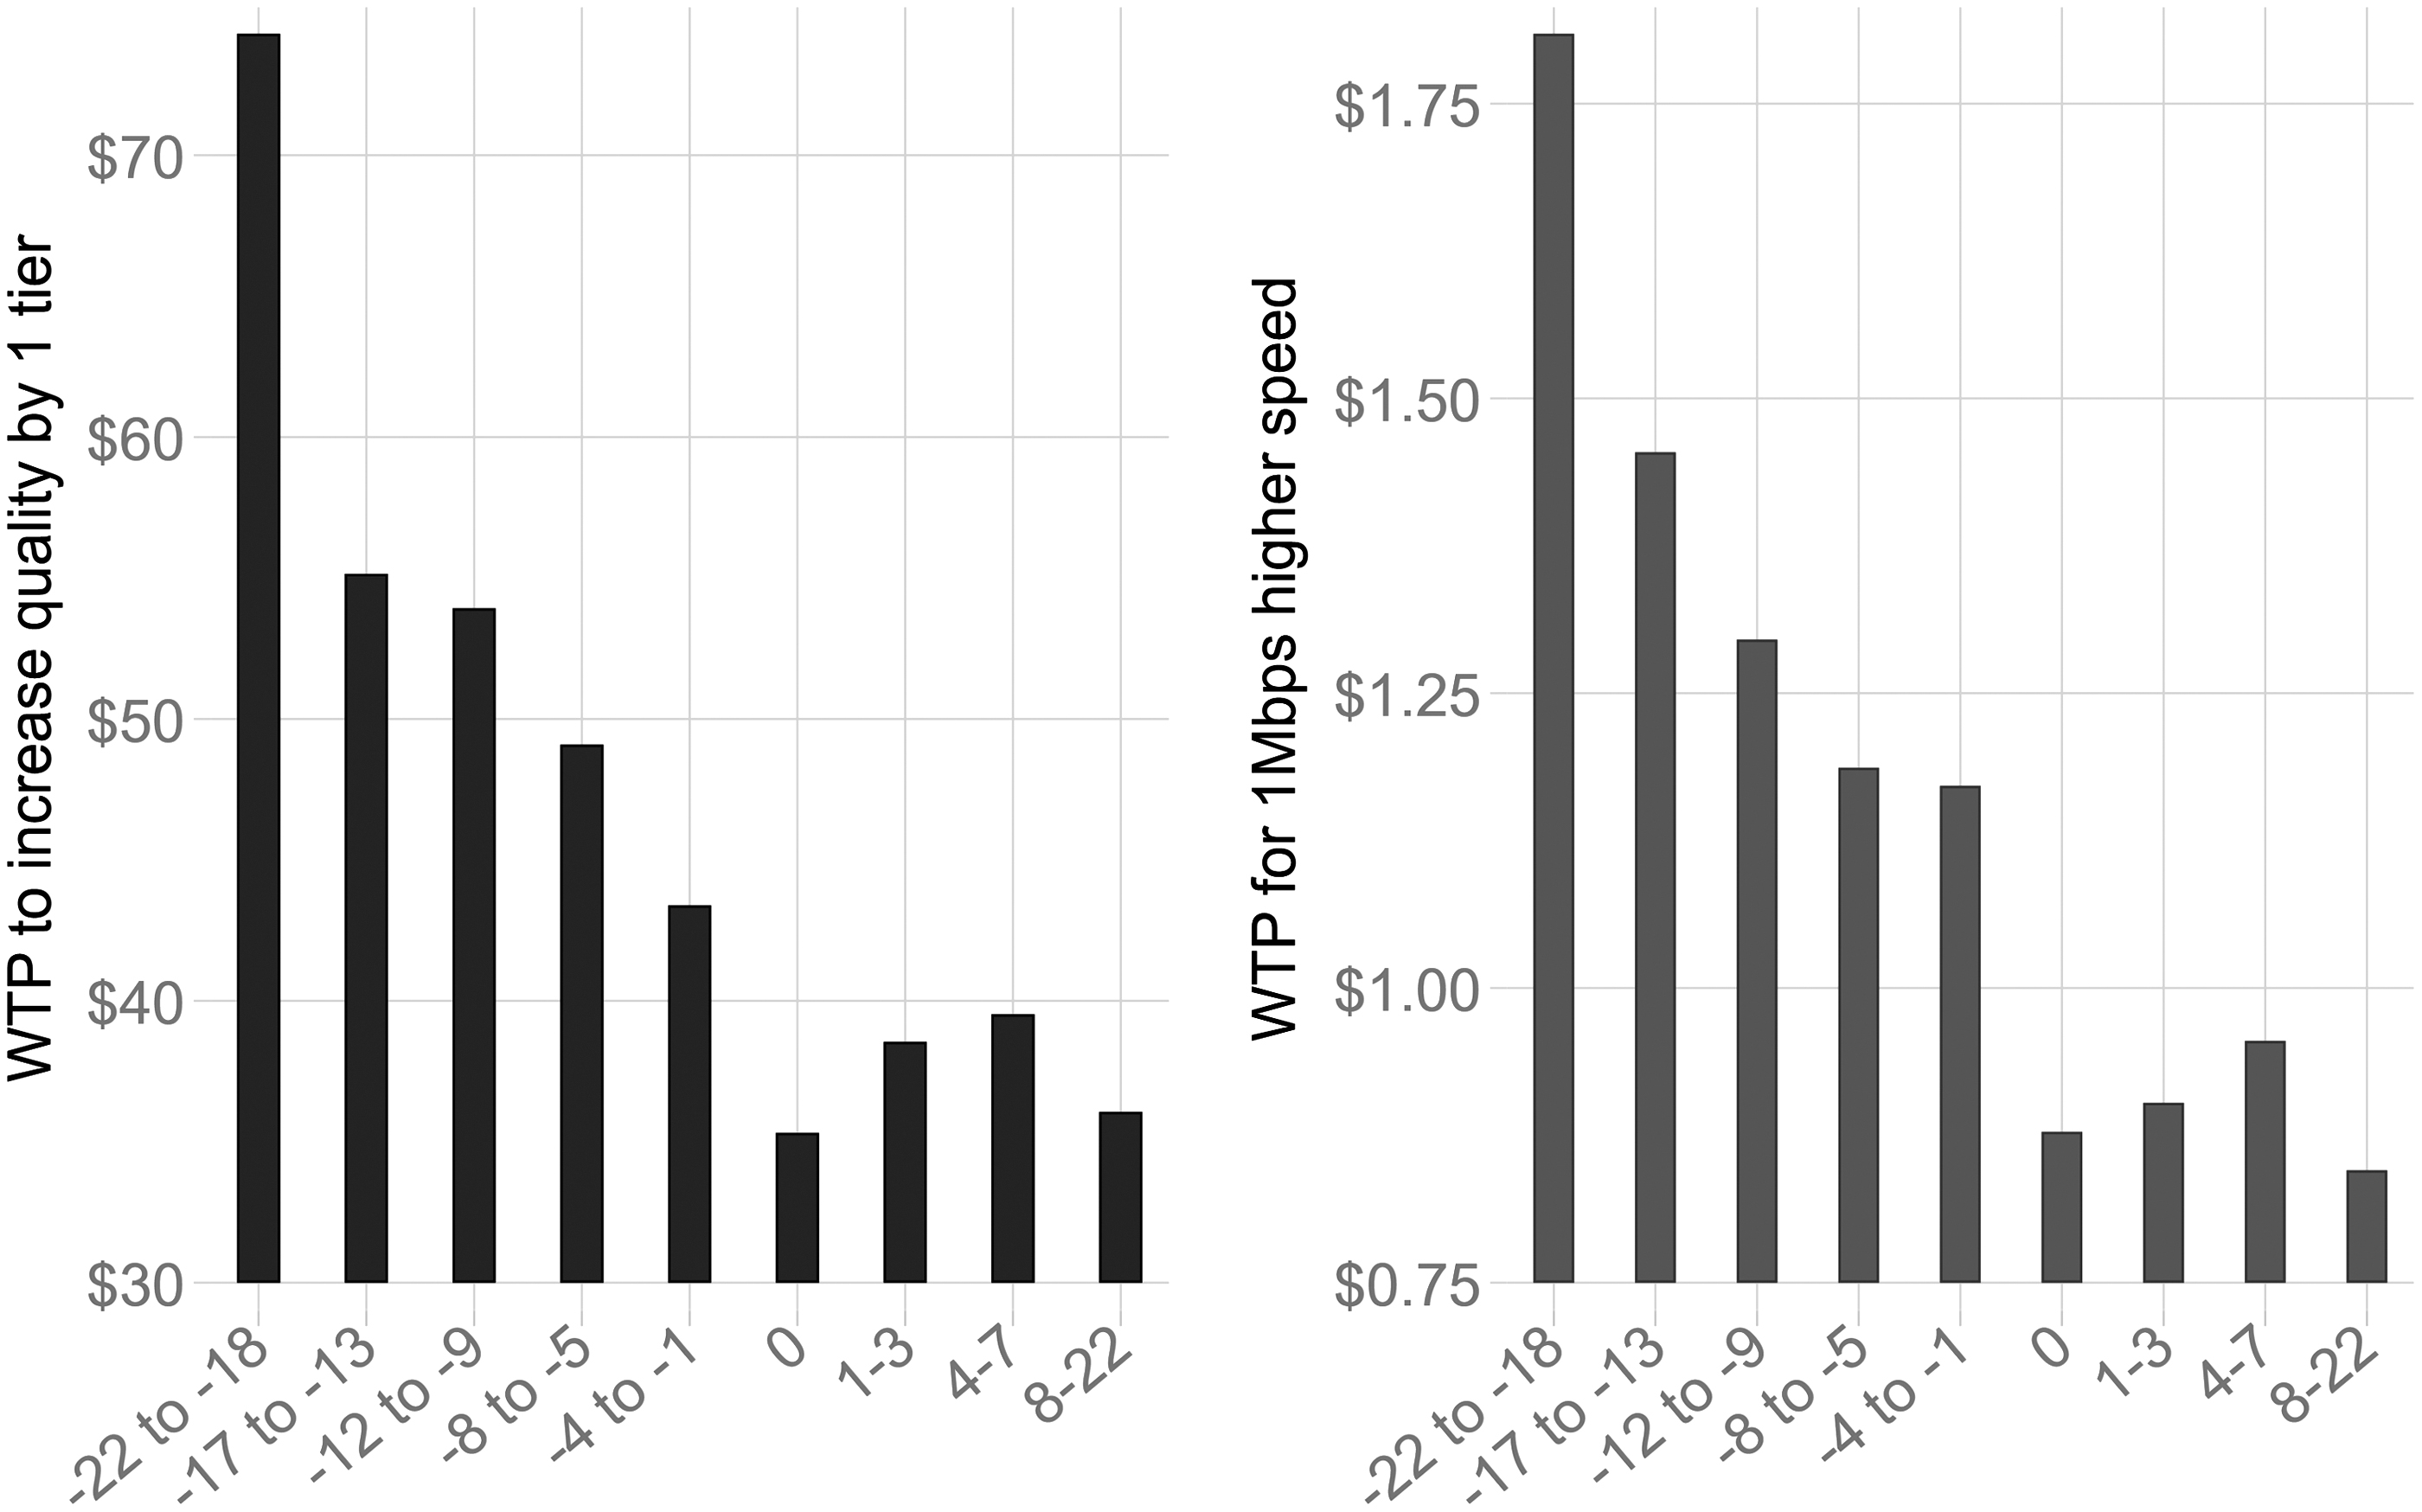
The relationship between respondent attitude about the barriers and difficulties in using telehealth (from −22 for least barriers to 22 for most barriers) on the horizontal axis and the WTP for internet price and quality ($/month) on the vertical axis.
The WTP for internet quality consistently declined for the other strata with scores of −17 to −13, −12 to −9, −8 to −5, −4 to −1, and 0 whose respective WTPs for internet quality were $55.15, $53.93, $49.09, $43.39, and $35.32, and their respective WTPs for internet speed were $1.45, $1.30, $1.19, $1.17, and $0.88. The last three strata with scores of 1–3, 4–7, and 8–22, showed a less consistent pattern: the three groups, respectively, had WTPs of $38.55, $39.52, and $36.06 for quality, and $0.90, $0.96, and $0.85 for speed. Except for this latter part, the findings in Figure 3 are highly consistent with those in Figure 2 in showing that respondents with a more positive opinion about telehealth were more willing to spend on improving their internet.
Discussion and Conclusions
In this study, we examined the association between the variations in the WTP for internet speed and quality and internet users' (1) prior use of telehealth services, (2) opinion on whether telehealth is beneficial and easy to use, and (3) opinion on whether there are significant challenges and barriers that may hinder telehealth utilization. The results showed a positive relationship between prior experience of using telehealth and the WTP for internet quality and speed. Specifically, those who used nearly all types of telehealth services were willing to spend 50.4% more on their internet quality and 29.9% more on their internet speed than those with zero prior experience of telehealth use.
We found similar results when we examined respondents' opinions about the benefits of telehealth: those who most firmly agreed that telehealth is beneficial and easy to use were willing to spend 59.2% more on their internet quality and 58.1% more on their internet speed than those who most strongly disagreed with the benefits of telehealth. The same finding has been confirmed in the case of respondents' opinions about the barriers and challenges on the way of using telehealth: those who found the use of telehealth least challenging were willing to spend 114% more on their internet quality and 106% more on their internet speed than those who most firmly believed that telehealth is difficult and challenging to use.
The results strongly and consistently show a correlation between users' WTP for internet services and their use of, and attitude toward, telehealth. It must be emphasized that, even though a strong correlation has been established, it does not immediately imply causality. That is, this strong correlation may be explained by causality (spending more on internet because of expecting to use telehealth) or other latent reasons. A possible latent effect, as Bagchi et al. 48 showed, might be that technology savvy individuals are both more likely to spend on their internet (because they have more uses for fast and high-quality internet) and more likely to find telehealth easy to use. Another latent effect may be income because individuals with higher income may have a higher WTP for internet (because they can afford to pay more) and also more likely to demand health care and thus telehealth. 49,50 Future studies will be necessary before one can read our current correlation study in a causal manner.
Given that telehealth is rapidly expanding and transforming health care delivery, the study of the ties between internet services and telehealth services (or health care services, in general) is growing in importance, impact, and relevance. An interesting research avenue that future studies can pursue is to investigate the ties between internet services and other health care-related factors such as patients' health care literacy, whether patients have an insurance coverage that reimburses telehealth services, patients' general health, mental health, physical health, and whether they have difficulties traveling to see their health care providers. Another promising research avenue is forming a more holistic model that examines several health related or socioeconomic characteristics simultaneously to identify which characteristics are the main drivers of WTP for internet services and which characteristics lose their significance or relevance after controlling for other factors.
Footnotes
Disclosure Statement
No competing financial interests exist.
Funding Information
The authors disclosed receipt of the following financial support for the research, authorship, and/or publication of this article: U.S. Health Resources & Services Administration under Award Number GA6RH40184.