
Abstract
Connective tissue growth factor (CTGF) plays a crucial role in the formation and development of hepatic fibrosis. The aim of this study was to establish a method for CTGF determination in order to investigate the level of CTGF in the sera of patients with hepatitis B virus, and to assess the correlation between CTGF concentration and stage of hepatic fibrosis. A CTGF C-terminal region gene was obtained by RT-PCR of human mesangial kidney cells and inserted into pET-32a(+) vector. Recombinant protein was obtained by expression and purification of the fused protein. Polyclonal and monoclonal antibodies were prepared to establish a sandwich ELISA method. CTGF levels in 18 healthy serum samples and 83 serum samples from patients with hepatitis B virus were assessed. A simple, sensitive, and noninvasive method of determining CTGF levels was successfully established. CTGF levels in the sera of patients with hepatitis B were significantly increased compared controls (p < 0.001). There was a strong correlation between CTGF concentration and fibrotic stage (r = 0.8906, p < 0.005). No significant association was found between CTGF level and the grade of hepatic inflammation (p > 0.05). The area under the receiver operating characteristic (ROC) curves of CTGF was 0.681 for identification of significant fibrosis, and 0.759 for the diagnosis of middle- and late-stage fibrosis. Accuracy of CTGF assessment was independent of age, renal function, liver function, platelet count, or other biochemical markers of liver fibrosis (all p > 0.05). No significant correlation was found between CTGF and several humoral factors associated with liver fibrosis (all p > 0.05). The levels of CTGF in the sera of patients with hepatitis B were strongly associated with the stages of hepatic fibrosis, and CTGF may become a useful diagnostic aid in assessing hepatic fibrosis.
Introduction
Hepatic fibrosis represents the main complication of most types of chronic liver disease, and the molecular mechanisms behind it have yet to be fully elucidated. However, proliferation and differentiation of hepatocytes, hepatic stellate cells (HSC), and production of fibroblasts stimulated by numerous mediators via autocrine and paracrine means (such as TGF-β, PDGF, and VEGF) may be closely associated with hepatic fibrosis (5 –7).
Aside from these key mediators, other molecules may play crucial roles in the fibrotic process. CTGF, as a downstream effector of TGF-β, could enhance mRNA levels for α1-type I collagen, fibronectin, and integrin in normal rat kidney (5 –7), and increase expressive levels of types II and X collagen in rabbit cartilage (9), as well as in type I collagen and fibronectin in primary human and rabbit mensangial cells (10,11). These facts suggest that CTGF may play an important role in matrix production. Paradis et al. investigated the possible involvement of CTGF in liver disease (12), and the results showed that CTGF immunostaining was positive in the majority of patients with hepatitis C and other chronic liver diseases.
The number of patients with hepatic fibrosis, cirrhosis, and primary liver cancer caused by hepatitis viruses is increasing yearly. Liver fibrosis should be diagnosed as early as possible to make effective treatment possible. Although a method of measuring serum levels of CTGF in the sera of patients with liver disease has been established (13,14), exactly how CTGF levels are related to the stage of liver fibrosis and degree of liver inflammation in hepatitis B-infected patients remains to be elucidated. In this study, we established a sensitive assay for determining CTGF levels to investigate the relationship between CTGF levels in patient sera and the stage of liver fibrosis, or/and the grading of liver inflammation. In addition, to further illustrate the significance of the serum CTGF level, several humoral factors associated with hepatic fibrosis such as alanine aminotransferase (ALT), aspartate aminotransferase (AST), γ-glutamyl transpeptidase (γ-GT), alkaline phosphatase (ALP), creatinine, platelet counts, bilirubin, albumin, and other biomarkers such as hyaluronic acid, procollagen type III (PCIII), collagen type IV (CIV), and laminin were also determined. We expected that CTGF could become a useful biomarker to assess the stage of liver fibrosis.
Materials and Methods
Cell culture and RT-PCR
Human mesangial cells (kindly provided by Prof. J.D. Williams) were cultured to subconfluence in DMEM supplemented with 10% FCS (Gibco, California, USA) at 37°C in a humidified 5% CO2 environment, kept for 24 h in serum-free medium, and then treated with 30 mmol/L glucose in fresh serum-free medium for 2 d. Total RNA was isolated using a Trizol Reagent Kit (Invitrogen, California, USA). cDNA was prepared from 25 μg of total RNA by incubating with 100 ng/mL oligo d(18)T (Fermentas, Vilnius, Lithuania) at 70°C for l0 min, followed by incubation at 37°C for 1 h with 0.5 mM dNTPs, 100 U RNasin, 0.02 mM dithiothreitol, and 100 U of M-Mulv (Promega, Wisconsin, USA). In order to obtain the CTGF gene, a standard PCR procedure was performed in a mixture containing 2 μg from the first-strand cDNA synthesis, 25 pM of forward primer: 5′-CCC
CTGF expression and purification
The purified DNAs encoding amino acids 242–349 and pET-32a(+) (Invitrogen) were digested with BamH I and Hind III, respectively. The corresponding fragments were purified separately by the methods described above. Ligation of the 339-bp fragment with the vector DNA was done in 10 μL of reaction mixture, which contains 4.5 μg of the 339-bp fragment, 1.5 μg of vector DNA, and 350 U of T4 DNA ligase for 16 h at 16°C. The ligation products were transformed into E. coli JM109, and plated on LB agarose medium containing ampicillin at 100 μg/mL to culture overnight. A single colony was selected and grown at 37°C overnight in 5 mL LB medium containing ampicillin at 100 μg/mL. The recombinant plasmid was extracted and purified from the amplified cells by the method described as above. The plasmid was confirmed by sequencing. The required plasmid was used to transform the competent BL21 (DE3) strain (Invitrogen). A single colony was selected and grown in LB medium, and induction was typically achieved by the addition of 1 mM final concentration of isopropyl-1-thio-β-D-galactopyranoside (IPTG) (Fermentas) to the medium of growing cells when the light scattering of the culture at 600 nm reached 0.6–1.0 (exponential growth phase). Protein expression was monitored by SDS-polyacrylamide gel electrophoresis (SDS-PAGE). The cells were harvested by centrifugation at 10,000 rpm for 5 min at 4°C. The pellet was suspended in lysis buffer (pH 8.0) containing 0.1 M sodium phosphate, 8 M urea, 5 mM EDTA, 1 mM dithiothreitol, 1 mM phenylmethylsulfonyl fluoride (Sigma, Missouri, USA), 0.5 M NaCl, and 10% glycerol, and sonicated on ice for 10 min. The cell lysis was mixed at 30-min intervals for 4 h at 4°C. Insoluble cell debris was then pelleted by centrifugation at 12,000 rpm for 30 min at 4°C. The supernatant was applied to an HIS-Select™ Nickel Affinity Gel (Sigma) column (2 × 5 cm) that had been equilibrated with the same buffer. The column was washed with eight volumes of lysis buffer containing 20 mM imidazol. The target protein was eluted with lysis buffer containing 200 mM imidazol and dialyzed against 0.1 M PBS overnight at 4°C, and stored at −20°C. The purity and immunoreactivity of the purified CTGF were analyzed using SDS-PAGE and Western blot.
Preparation of polyclonal and monoclonal antibody
Four New Zealand White rabbits (each of 1.5–2.0 kg, from the animal center of the medical school of Southeast University), and 5 BALB/c mice (6–8 wk old, from the animal center of Shanghai) were immunized by intradermal injection of recombinant CTGF in complete Freund's adjuvant at a dose of 200 μg/rabbit or 50 μg/mouse on day 0, and half of these amounts of recombinant CTGF in incomplete Freund's adjuvant per animal was given on days 14, 28, and 42. The rabbits were bled on day 49 and the sera were isolated by centrifugation. Splenocytes from the immunized mice were fused four times with SP2/0 myeloma cells (Institute of Cell Research, Shanghai) at a ratio of 4:1. The cell mixture was cultured in DMEM supplemented with 10% fetal calf serum, and the hybridoma cells were selected using hypoxanthine-aminopterin-thymidine medium (Sigma). Ascites fluid of the mice were obtained by IP injection, and 0.5–1 × 10⁶ hybridoma cells per mouse were treated with pristine for 8–10 days. Polyclonal antibodies from rabbit sera and monoclonal antibodies from ascites fluid were purified using chromatography on a DEAE-52 column.
Enzyme-linked immunosorbent assays of polyclonal and monoclonal antibodies
Then 96-well flat-bottom microtiter plates (Biomat, Rovereto, Italy) were filled with 100 μL/well of a solution containing 10 μg/mL of purified recombinant CTGF, and were coated overnight at 4°C. After washing and blocking with a solution of 10% FBS in PBS for 2 h at 37°C, 100 μL of serial dilutions of rabbit sera or ascites fluid of the mice in blocking buffer were added to the wells and incubated for 1 h. The wells were washed five times, then a second antibody (horseradish peroxidase-conjugated goat anti-rabbit IgG, or horseradish peroxidase-conjugated goat anti-mouse IgG; R&D Systems Inc., Minneapolis, USA) in blocking buffer (1:1000 dilution) was added and incubated for 1 h. The wells were washed again before the color-developing reagents were added. Color development was stopped by addition of 2 M sulfuric acid, and the results were recorded by reading the optical density (OD) value at 450 nm by an automated ELISA reader (CliniBio 128C, Tecan, Austria).
Preparation of biotin conjugated polyclonal antibody
Then 4 mg of rabbit IgG was dissolved in 1 mL of 50-mM bicarbonate buffer (pH 8.5), and 20 μL of NHS-LC-biotin was added (Pierce, Illinois, USA) (6 mg/mL of DMSO). The reaction mixture was placed on ice for 2 h and dialyzed against 0.01 M PBS (pH 7.4) overnight at 4°C, and stored at −20°C after addition of the same volume of glycerol and 0.01% NaN3.
Assay protocols
The reagent concentrations of the monoclonal antibody and the biotin-labeled polyclonal antibody were optimized by two-dimensional serial dilution. Finally, 96-well microtiter plates were coated with a solution of 2 μg/mL monoclonal antibody in 0.05 M sodium bicarbonate (pH 9.6) and held overnight at 4°C, and then were washed three times after blocking with 0.1 M PBS containing 2% casein. The plates were air-dried, sealed, and stored under moisture-free conditions at 4°C. Then 50 μL of serum sample (1:100 dilution with PBS) or standard materials were added to the wells, and incubated for 1 h at 37°C. After washing three times, 50 μL of a 1:500 dilution of biotin-labeled polyclonal antibody was added to incubate for 30 min at 37°C, then they were washed three times, and 50 μL of avidin-biotin labeled horseradish peroxidase complex (Pierce) was added and incubated for 30 min at 37°C. After washing six times, 100 μL of tetramethylbenzidine (TMB) substrate was added for 15 min before the reaction was stopped with 2 M sulfuric acid and read at 450 nm by an automated ELISA reader (CliniBio 128C; Tecan).
Methodological evaluation
To determine the lowest detectable concentration of each analysis, 40.0 ng/mL of recombinant CTGF (PeproTech, New Jersey, USA) was diluted to the lowest concentration from which at least 95% could be recovered. Within-assay precision was determined by assaying three control samples (10.0, 5.0, and 0.5 ng/mL) in quintuplicate. Between-assay precision was determined in quadruplicate. In addition, icteric, lipemic, and hemolyzed samples were tested to evaluate the possible interference of these physiological factors. These samples were serially diluted from high to low concentration, and recombinant CTGF was added to 100.0 ng/mL.
Determination of clinical samples
Serum samples of controls and patients with hepatitis B were provided by the Center of Laboratory Medicine of Zhongda Hospital, and Southeast University hospital, respectively. The serum samples of the control group (n = 18) were obtained from healthy donors in clinic with normal hepatic function test results: ALT < 40 U/L, AST < 44 U/L, and γ-GT < 36 U/L, as measured by routine methods, and their hepatitis markers (HAV, HCV, HDV, HBsAg, and HBV-DNA) were all negative. Serum samples from patients with unfavorable prognoses (n = 83) were obtained (49 males and 34 females, aged 31–83 y [mean age 57 y]); these patients had been treated in the hospital between April 2007 and March 2008, and all were HBsAg-positive or had HBV DNA (>103 copies) detected by ELISA or PCR. The baseline characteristics of the patients in the study are detailed in Table 1. All samples obtained were fasting peripheral venous blood samples. Serum was separated by centrifugation for 30 min, and stored at −80°C. CTGF levels of all serum samples were detected using the established ELISA method. The levels of hyaluronic acid, PCIII, CIV, and laminin were detected using an immunoradiometric assay according to the manufacturer's protocols (Jiuding Bio Inc., Tianjin, China). In addition, liver function (ALT, AST, γ-GT, ALP, bilirubin, and albumin), renal function (creatinine), and platelet counts were routinely determined. The study was approved by the ethical committee of Southeast University, Nanjing, China.
Abbreviations: F, fibrosis; A, necroinflammatory activity; ALT, alanine aminotransferase; AST, aspartate aminotransferase; γ-GT, γ-glutamyl transpeptidase; ALP, alkaline phosphatase; PCIII, procollagen type III; CIV, collagen type IV.
Liver biopsy histology
The liver tissue samples of the hepatitis patients were obtained using a percutaneous needle within 24 h after blood samples were taken. The length and width of each sample were at least 1.0 cm and 1.0 mm. The liver specimens were formalin-fixed, paraffin-embedded, and stained routinely with hematoxylin and eosin. Fibrosis stage was determined via appraisal of the stage of fibrosis and grade of necroinflammatory activity according to the METAVIR scoring system (15). Briefly, fibrosis was staged on a scale of 0–4 (F0 = no fibrosis, F1 = portal fibrosis without septa, F2 = few septa, F3 = numerous septa without cirrhosis, and F4 =cirrhosis). The grading of histological activity was based on the intensity of necroinflammatory activity and was scored as follows: A0 = no activity, A1 = slight activity, A2 = mild activity, A3 = moderate activity, and A4 = severe activity. Histological results were reported by a single experienced pathologist.
Statistical analysis
Values are expressed as the mean ± SD. Statistical analysis was carried out using SPSS version 14.0 (SPSS Inc., Chicago, IL). ANOVA was applied to analyze the correlation between serum CTGF concentration and stage of liver fibrosis or grade of necroinflammatory activity. Multiple linear regression analysis was performed to evaluate the independently predictive factors of serum CTGF concentration. Simple linear regression analyses were applied to determine the correlation between the CTGF concentration and the biological markers associated with liver fibrosis. The diagnostic value was assessed by the area under the receiver operating characteristic (ROC) curves. Differences were considered significant at a p value of <0.05.
Results
Expression and purification of the CTGF C domain
A CTGF C-terminal region gene (encoding amino acids 242–349) was obtained by RT-PCR from human mesangial cells, and subcloned into a pET-32a(+) vector by endonuclease restriction sites of BamH I and Hind III, and fused downstream of the thioredoxin (Trx) A gene. The sequencing result showed that the target gene corresponded with the sequence described in NCBI NP001892. A positive plasmid colony was selected and grown in LB medium containing ampicillin, and induction was typically achieved by addition of IPTG. The cells were harvested and sonicated to release the required protein. The supernatant was applied to an affinity chromatography column and the recombinant CTGF was obtained (Fig. 1A).
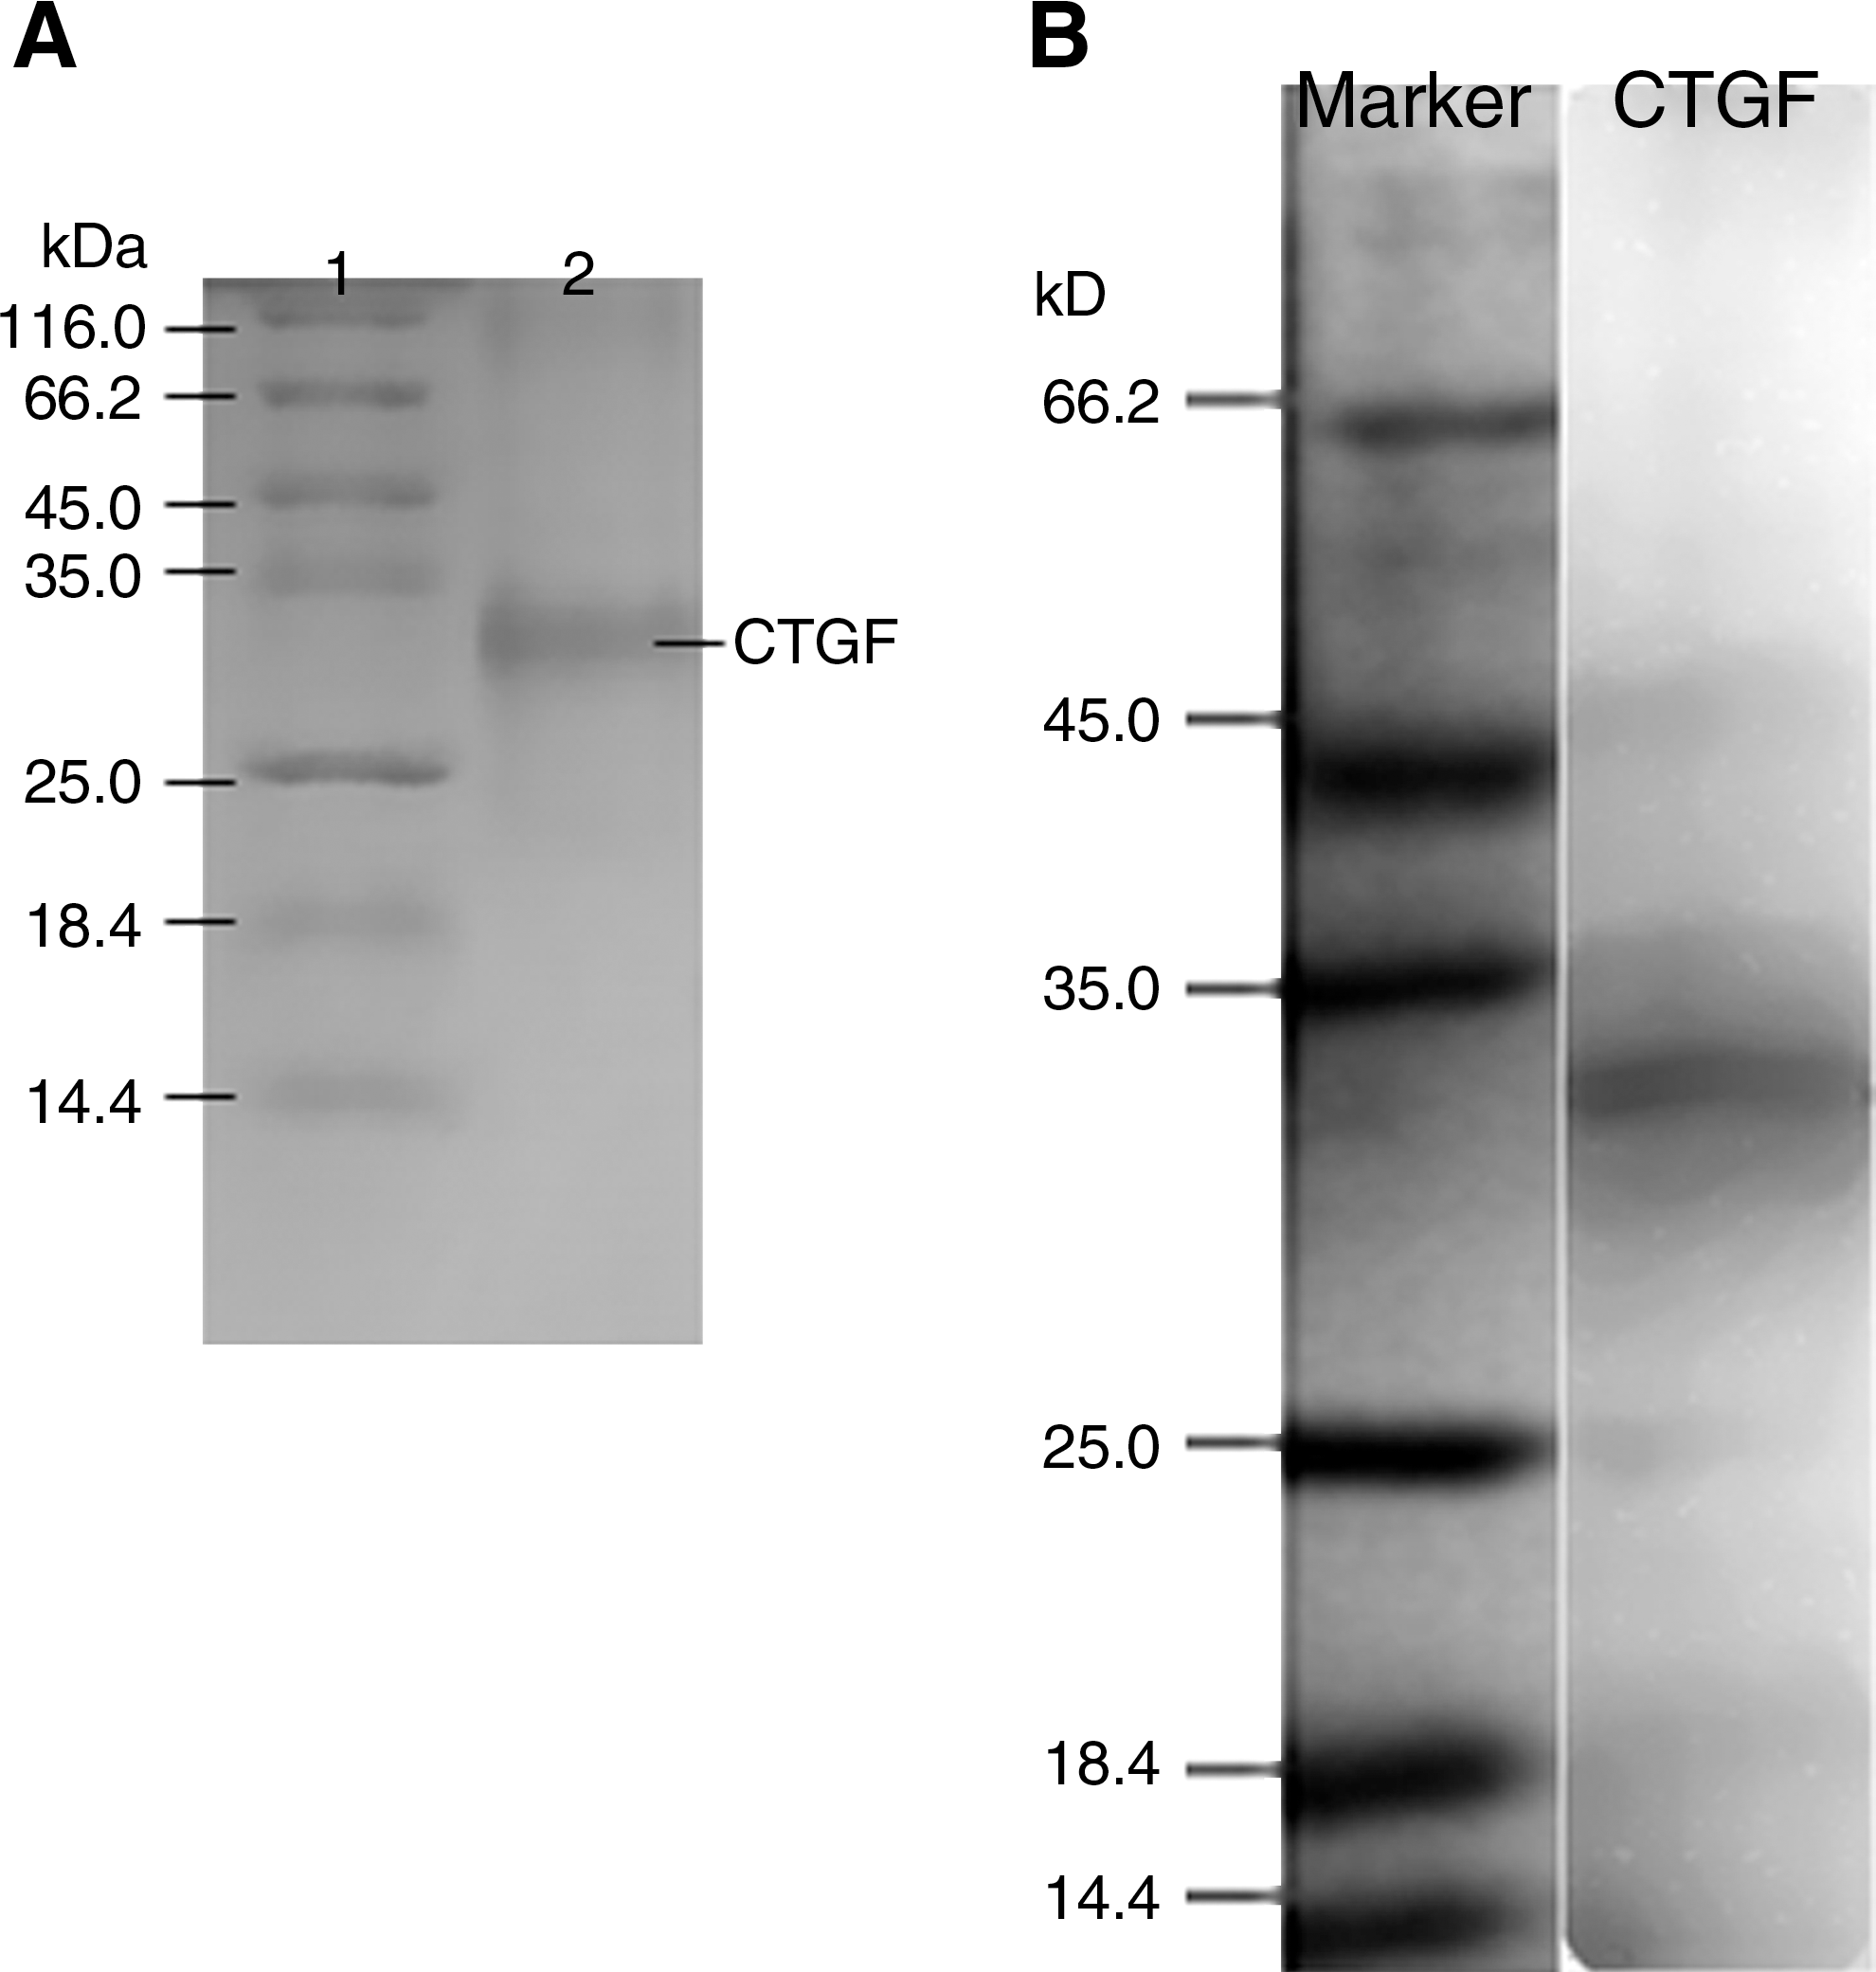
SDS-PAGE and Western blot analysis of CTGF. (
Generation of anti-CTGF C domain antibodies
Two cell strains (7G2 and 8A11) secreting monoclonal antibody against CTGF were established, and their supernatants' binding activity was assessed with recombinant CTGF and human native CTGF via ELISA or Western blotting (data not shown). The average titers of the polyclonal antibody from rabbit sera, and the monoclonal antibody (7G2 and 8A11) from ascites fluid of mice, were 1:106, 1:107, and 1:107, respectively, all as determined by ELISA. Polyclonal and monoclonal antibodies were purified by ion exchange chromatography. Biotinylated polyclonal antibody was prepared with NHS-LC-Biotin conjugated with rabbit IgG.
Establishment of sandwich ELISA
The optimum coating concentration was 200 ng/well (100 μL) 7G2 in 0.05 M sodium bicarbonate (pH 9.6) buffer, and the concentration of biotin-labeled polyclonal antibody was a 1:500 dilution in 0.1 M PBS containing 2% casein by two-dimensional serial dilution. Under this protocol, CTGF in samples was captured by immobilized antibody, and it also reacted with biotin-labeled polyclonal antibody. Biotin conjugated with secondary antibody was combined with avidin-biotin-labeled horseradish peroxidase complex. The horseradish peroxidase in the complex could catalyze the TMB substrate, resulting in color development. OD values (x) had a dose-dependent relationship with the CTGF concentrations (y) in the samples (y = 1.776x2 + 1.284x + 0.567; r = 0.996, p = 0.000; Fig. 2).
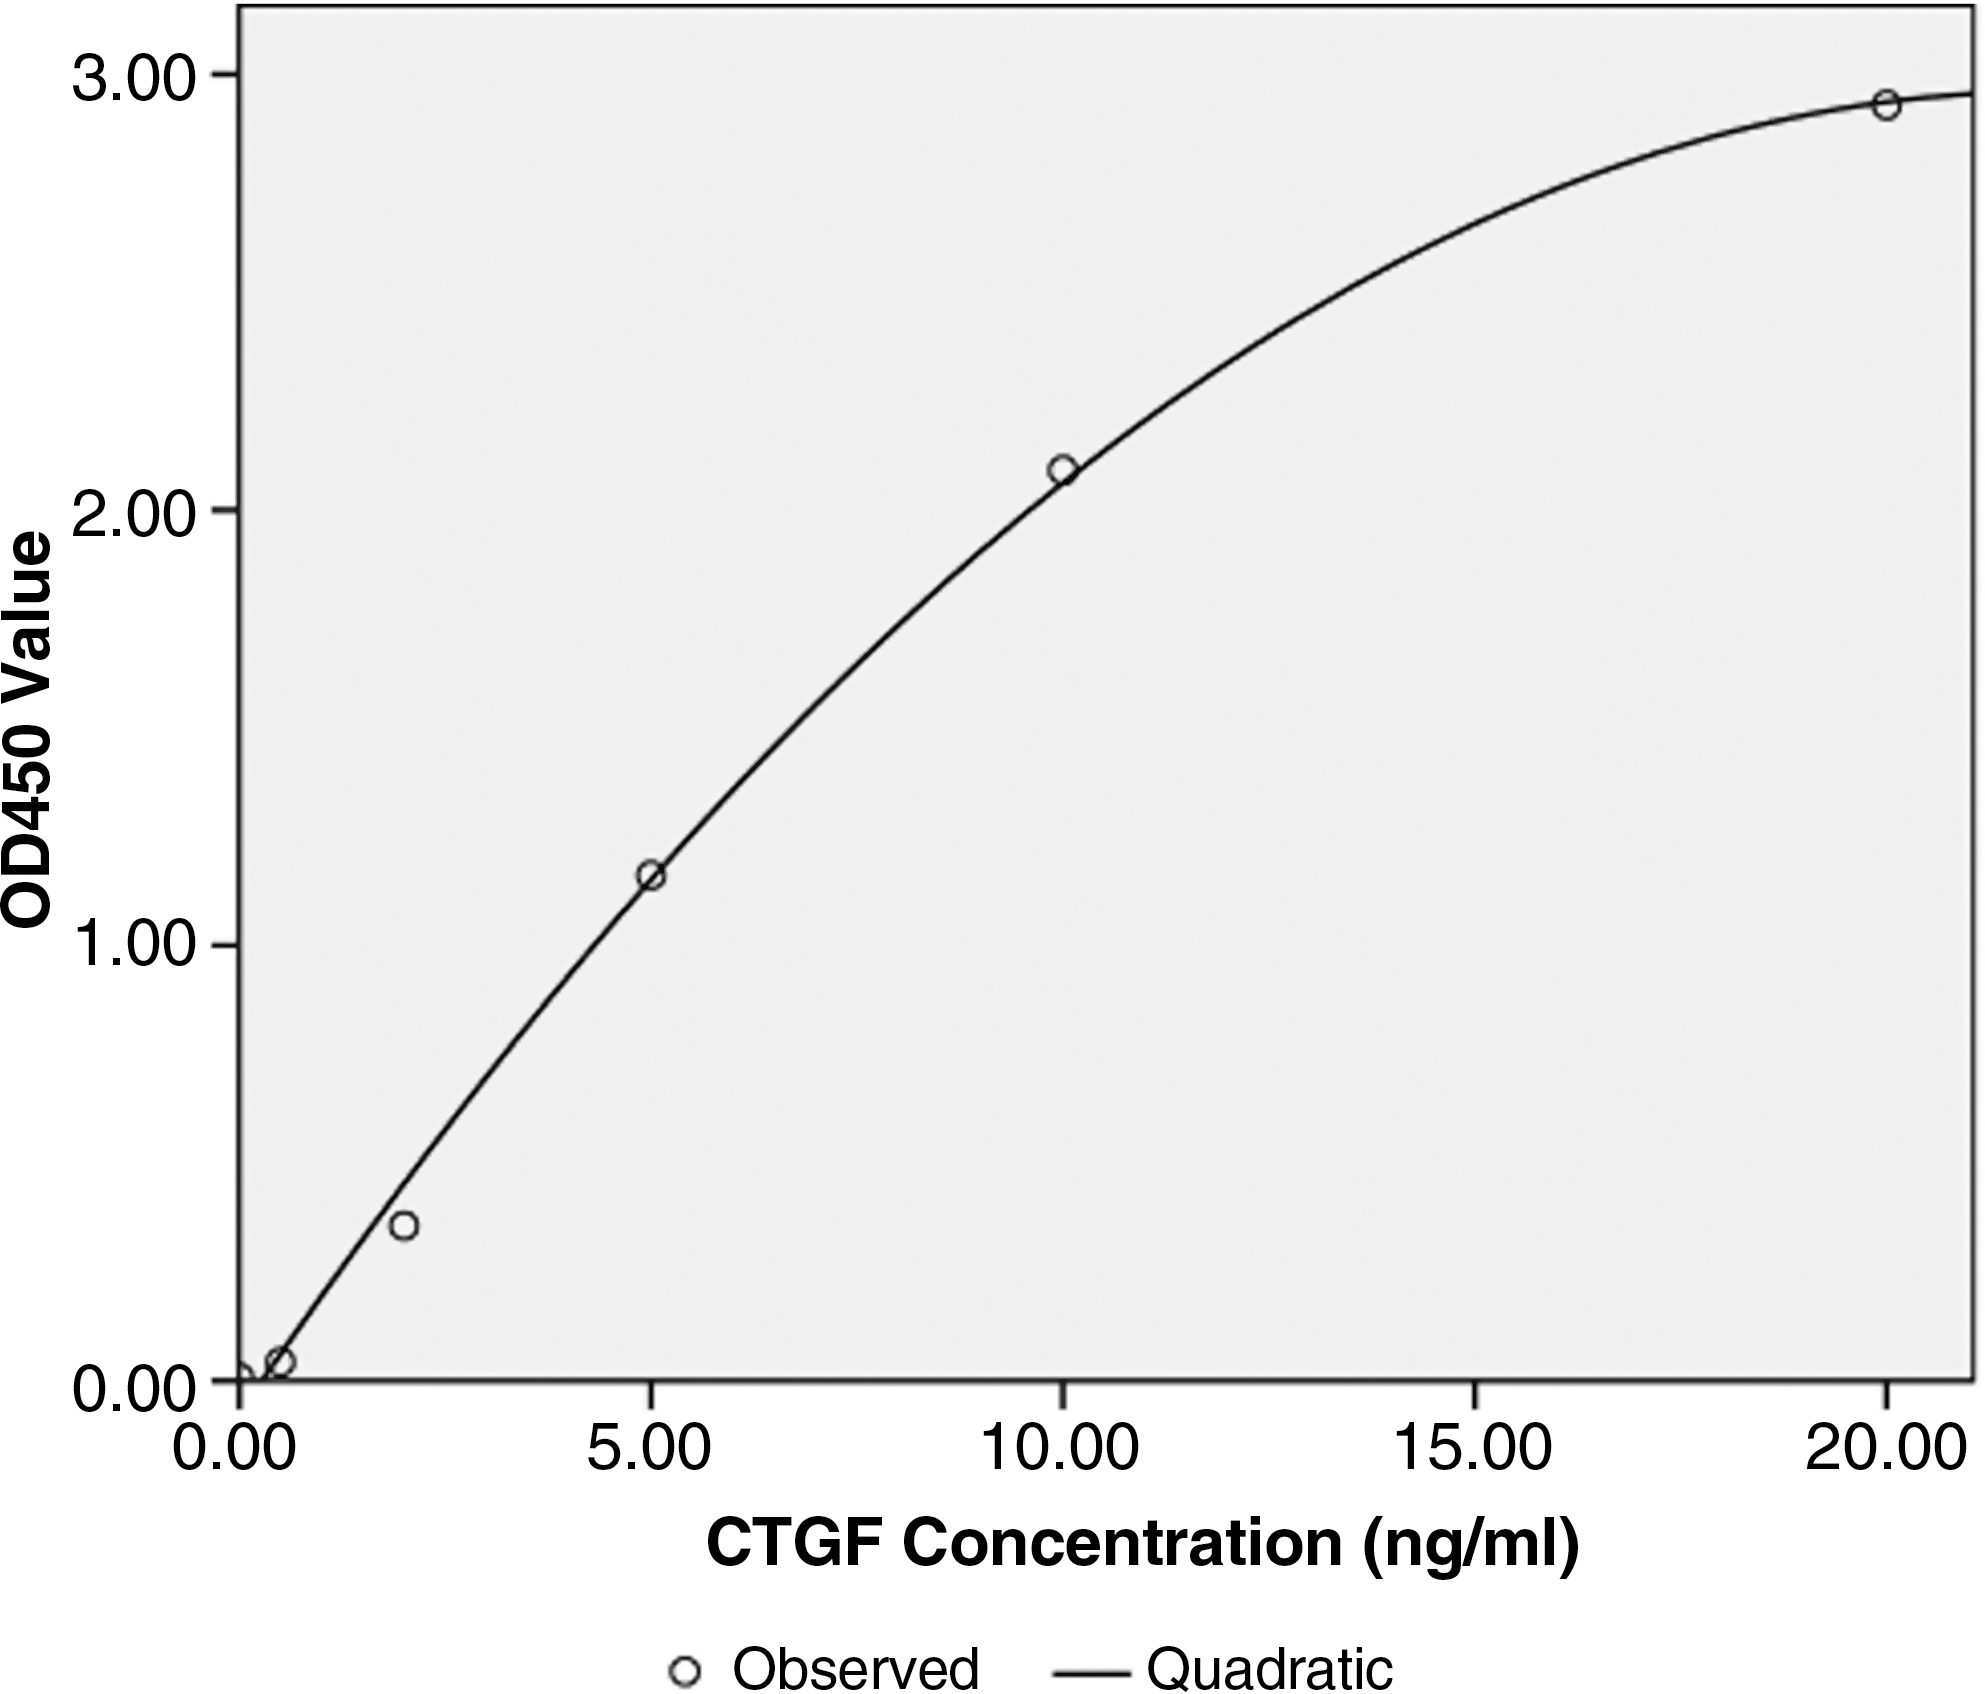
Curve of the correlation between optical density (OD450) value and CTGF concentration (ng/mL). CTGF serial concentrations were detected using our established method.
The average within-run and between-run coefficients of variation (CVs) were 4.2% and 7.9%, respectively. The average recovery was 95.6% according to each analysis, and the linearity was studied as well as the percentage of recovery obtained from the high concentration to low. The minimum detectable concentration with 95% recovery was estimated to be 0.125 ng/mL. The concentrations for hemoglobin (0–120 mg/L), total bilirubin (0–15.0 mmol/L), and triglycerides (0–12.0 mmol/L) had no influence on the testing results.
Relationship between CTGF level and stage of liver fibrosis
The serum CTGF levels of healthy volunteers and patients with hepatitis B were quantified in a blind manner. The average CTGF level in the sera from the healthy volunteers (n = 18) was 51.96 ± 5.81 ng/mL. The average CTGF level of patients with hepatitis B (n = 83) was 161.50 ± 108.27 ng/mL, significantly higher than that of normal controls (p < 0.001). According to the stage of fibrosis, the 83 serum samples were divided into five groups, and average CTGF levels were 117.12 ± 37.54 ng/mL in the F0 group (n = 17), 136.52 ± 41.02 ng/mL in the F1 group (n = 32), 141.82 ± 46.4 ng/mL in the F2 group (n = 18), 233.98 ± 135.14 ng/mL in the F3 group (n = 12), and 403.56 ± 315.27 ng/mL in the F4 group (n = 4), respectively. The CTGF levels of all five groups were also significantly increased compared to the controls (all p < 0.001) (Fig. 3). The stage of liver fibrosis was closely correlated with the level of CTGF in the sera of the patients with hepatitis B (r = 0.8906, X2 = 35.8477, p < 0.005). The results showed that CTGF levels in hepatitis B patients gradually increased with increasing severity of liver fibrosis.
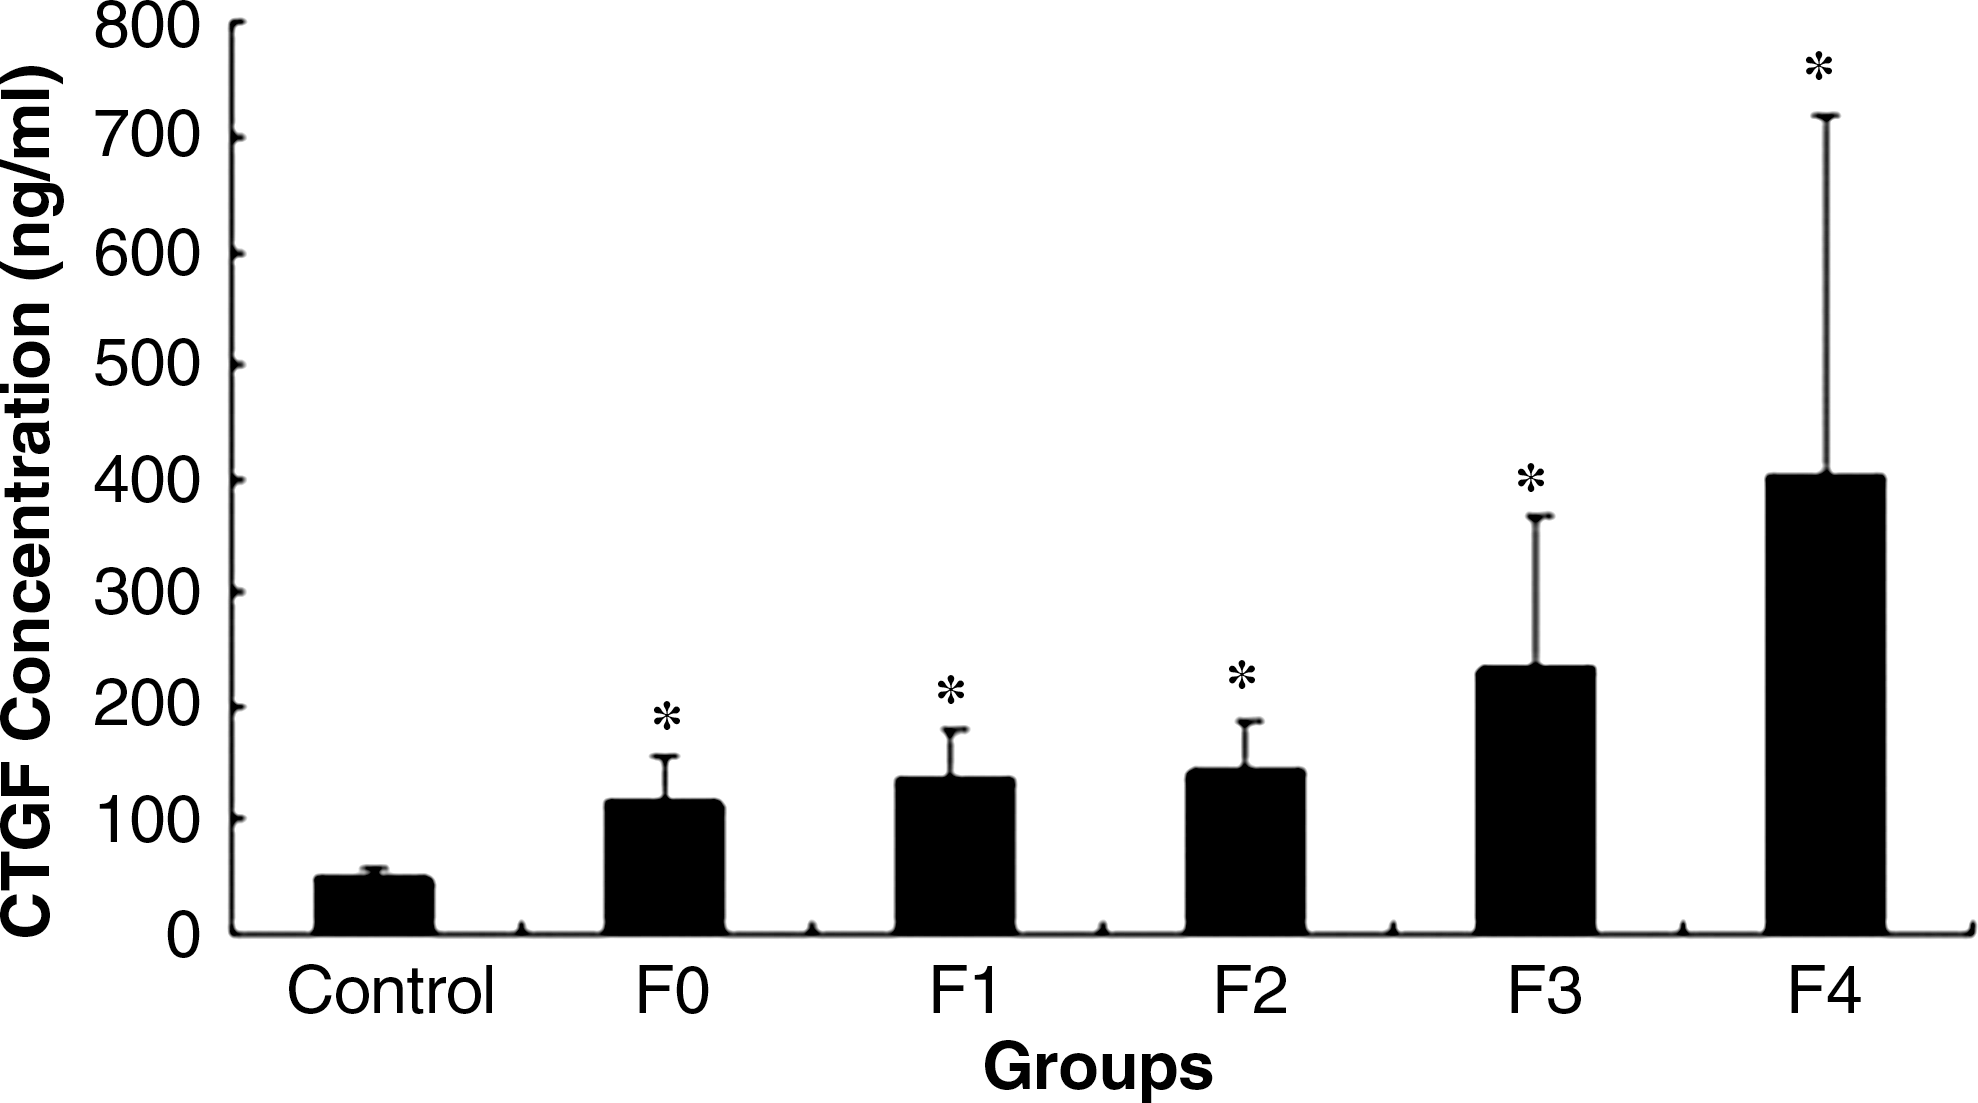
Relationship between CTGF level and stage of liver fibrosis. Eighty-three samples from patients with hepatitis B were divided into five groups (F0 = no fibrosis; F1 = portal fibrosis without septa; F2 = few septa; F3 = numerous septa without cirrhosis; F4 = cirrhosis), according to the stage of liver fibrosis as assessed by the METAVIR scoring system. CTGF concentrations were detected using our established method (*p < 0.001 compared to controls). The stage of liver fibrosis closely correlated with the level of CTGF in the serum of patients with hepatitis B (r = 0.8906, p < 0.005).
Relationship between CTGF level and grade of liver inflammation
According to the grade of liver inflammation, 83 sera samples were divided into five groups, and average CTGF levels were 91.17 ± 16.45 ng/mL in the A0 group (n = 3), 133.52 ± 53.03 ng/mL in the A1 group (n = 27), 158.78 ± 65.55 ng/mL in the A2 group (n = 23), 225.03 ± 220.93 ng/mL in the A3 group (n = 23), and 188.63 ± 60.99 ng/mL in the A4 group (n = 7) (Fig. 4). There was no correlation between CTGF levels of patients with hepatitis B and the severity of liver inflammation (X2 = 20.4876, p < 0.5). Although the correlation coefficient between the grade of liver inflammation and CTGF level approached 0.8844, the results were negative.
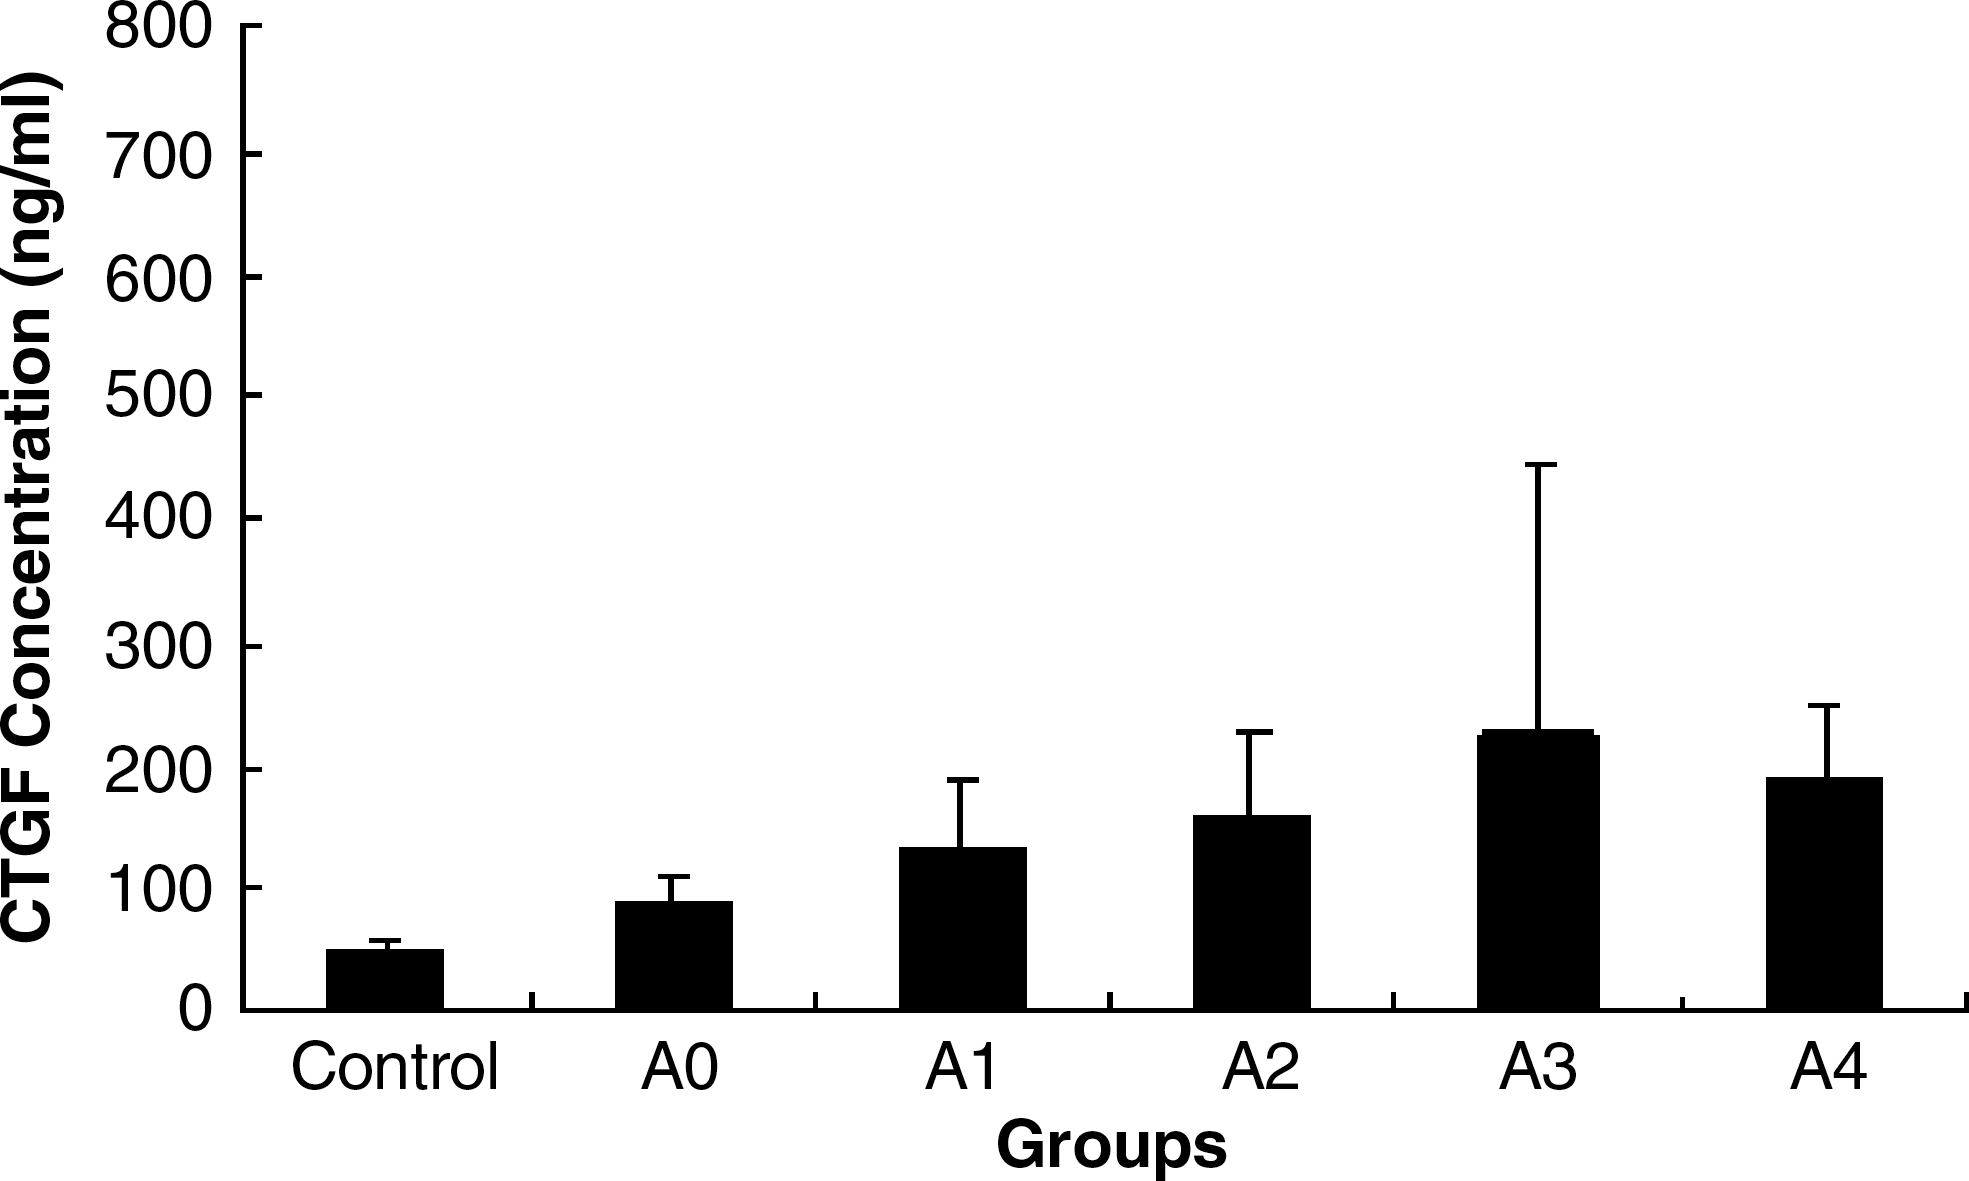
Relationship between CTGF level and grade of liver inflammation. Eighty-three samples from patients with hepatitis B were divided into five groups (A0 = no activity; A1 = slight activity; A2 = mild activity; A3 = moderate activity; A4 = severe activity), according to the grade of liver necroinflammatory activity as assessed by the METAVIR scoring system. CTGF concentrations were detected using our established method. There was no correlation between CTGF levels of patients with hepatitis B and the severity of liver inflammation (p > 0.5).
By combining the fibrosis stages and the grades of liver inflammation, the 83 serum samples were divided into four groups, and these CTGF levels were found: 135.77 ± 43.84 ng/mL (F0–F2/A0–A2 group; n = 56), 127.65 ± 46.85 ng/mL (F0–F2/A3–A4 group; n = 11), 225.77 ± 112.28 ng/mL (F3–F4/A0–A2 group; n = 7), and 315.74 ± 244.4 ng/mL (F3–F4/A3–A4 group; n = 9). The CTGF level of each group was significantly higher than that of controls (p < 0.001). The stage of liver fibrosis also correlated with CTGF level (r = 0.9324, X2 = 33.4219, p < 0.005). At the same stages of liver fibrosis, however, the CTGF levels were not significantly different from those of varying inflammatory grades (the F0–F2/A3–A4 group versus the F0–F2/A0–A2 group, p = 0.5744; and the F3–F4/A3–A4 group versus the F3–F4/A0–A2 group, p = 0.3844).
Relationship between serum levels of CTGF and humoral factors associated with liver fibrosis
Multiple linear regression analysis was performed to determine the humoral predictive factors of serum CTGF concentration. The results demonstrated that serum CTGF was independent from age, renal function (creatinine), liver function (ALT, AST, γ-GT, ALP, bilirubin, and albumin), platelet counts, and biochemical markers of liver fibrosis (hyaluronic acid, PCIII, CIV, and laminin). Beta-coefficients were −0.153, 0.039, 0.198, 0.205, 0.011, 0.314, 0.299, −0.205, −0.151, 0.302, 0.460, −0.372 and 0.075, respectively (all p > 0.05). Simple linear regression analysis was applied to determine the correlation between the serum CTGF levels and the concentrations of these humoral factors and no significant correlation was found. Correlation coefficients were −0.049, 0.090, 0.096, 0.167, 0.119, 0.060, 0.060, −0.043, 0.090, 0.289, 0.206, 0.029, and 0.092, respectively (all p > 0.05).
To evaluate the usefulness of CTGF for predicting significant liver fibrosis, the area under the ROC curve was analyzed. The area under the curve (AUC) of CTGF for identifying significant fibrosis (F1–F4) was 0.681 (Fig. 5). At a threshold of 125.58 ng/mL, the sensitivity and specificity were 60.6% and 71.6%, respectively. The AUC of CTGF for diagnosis of middle- and late-stage liver fibrosis (F3–F4) was 0.759 (Fig. 6). At the cut-off value of 141.28 ng/mL, the sensitivity and specificity were 68.8% and 85.1%, respectively. The AUCs for laminin, CIV, PCIII, and hyaluronic acid for diagnosis of significant fibrosis were 0.564, 0.657, 0.588, and 0.708 respectively (data not shown).
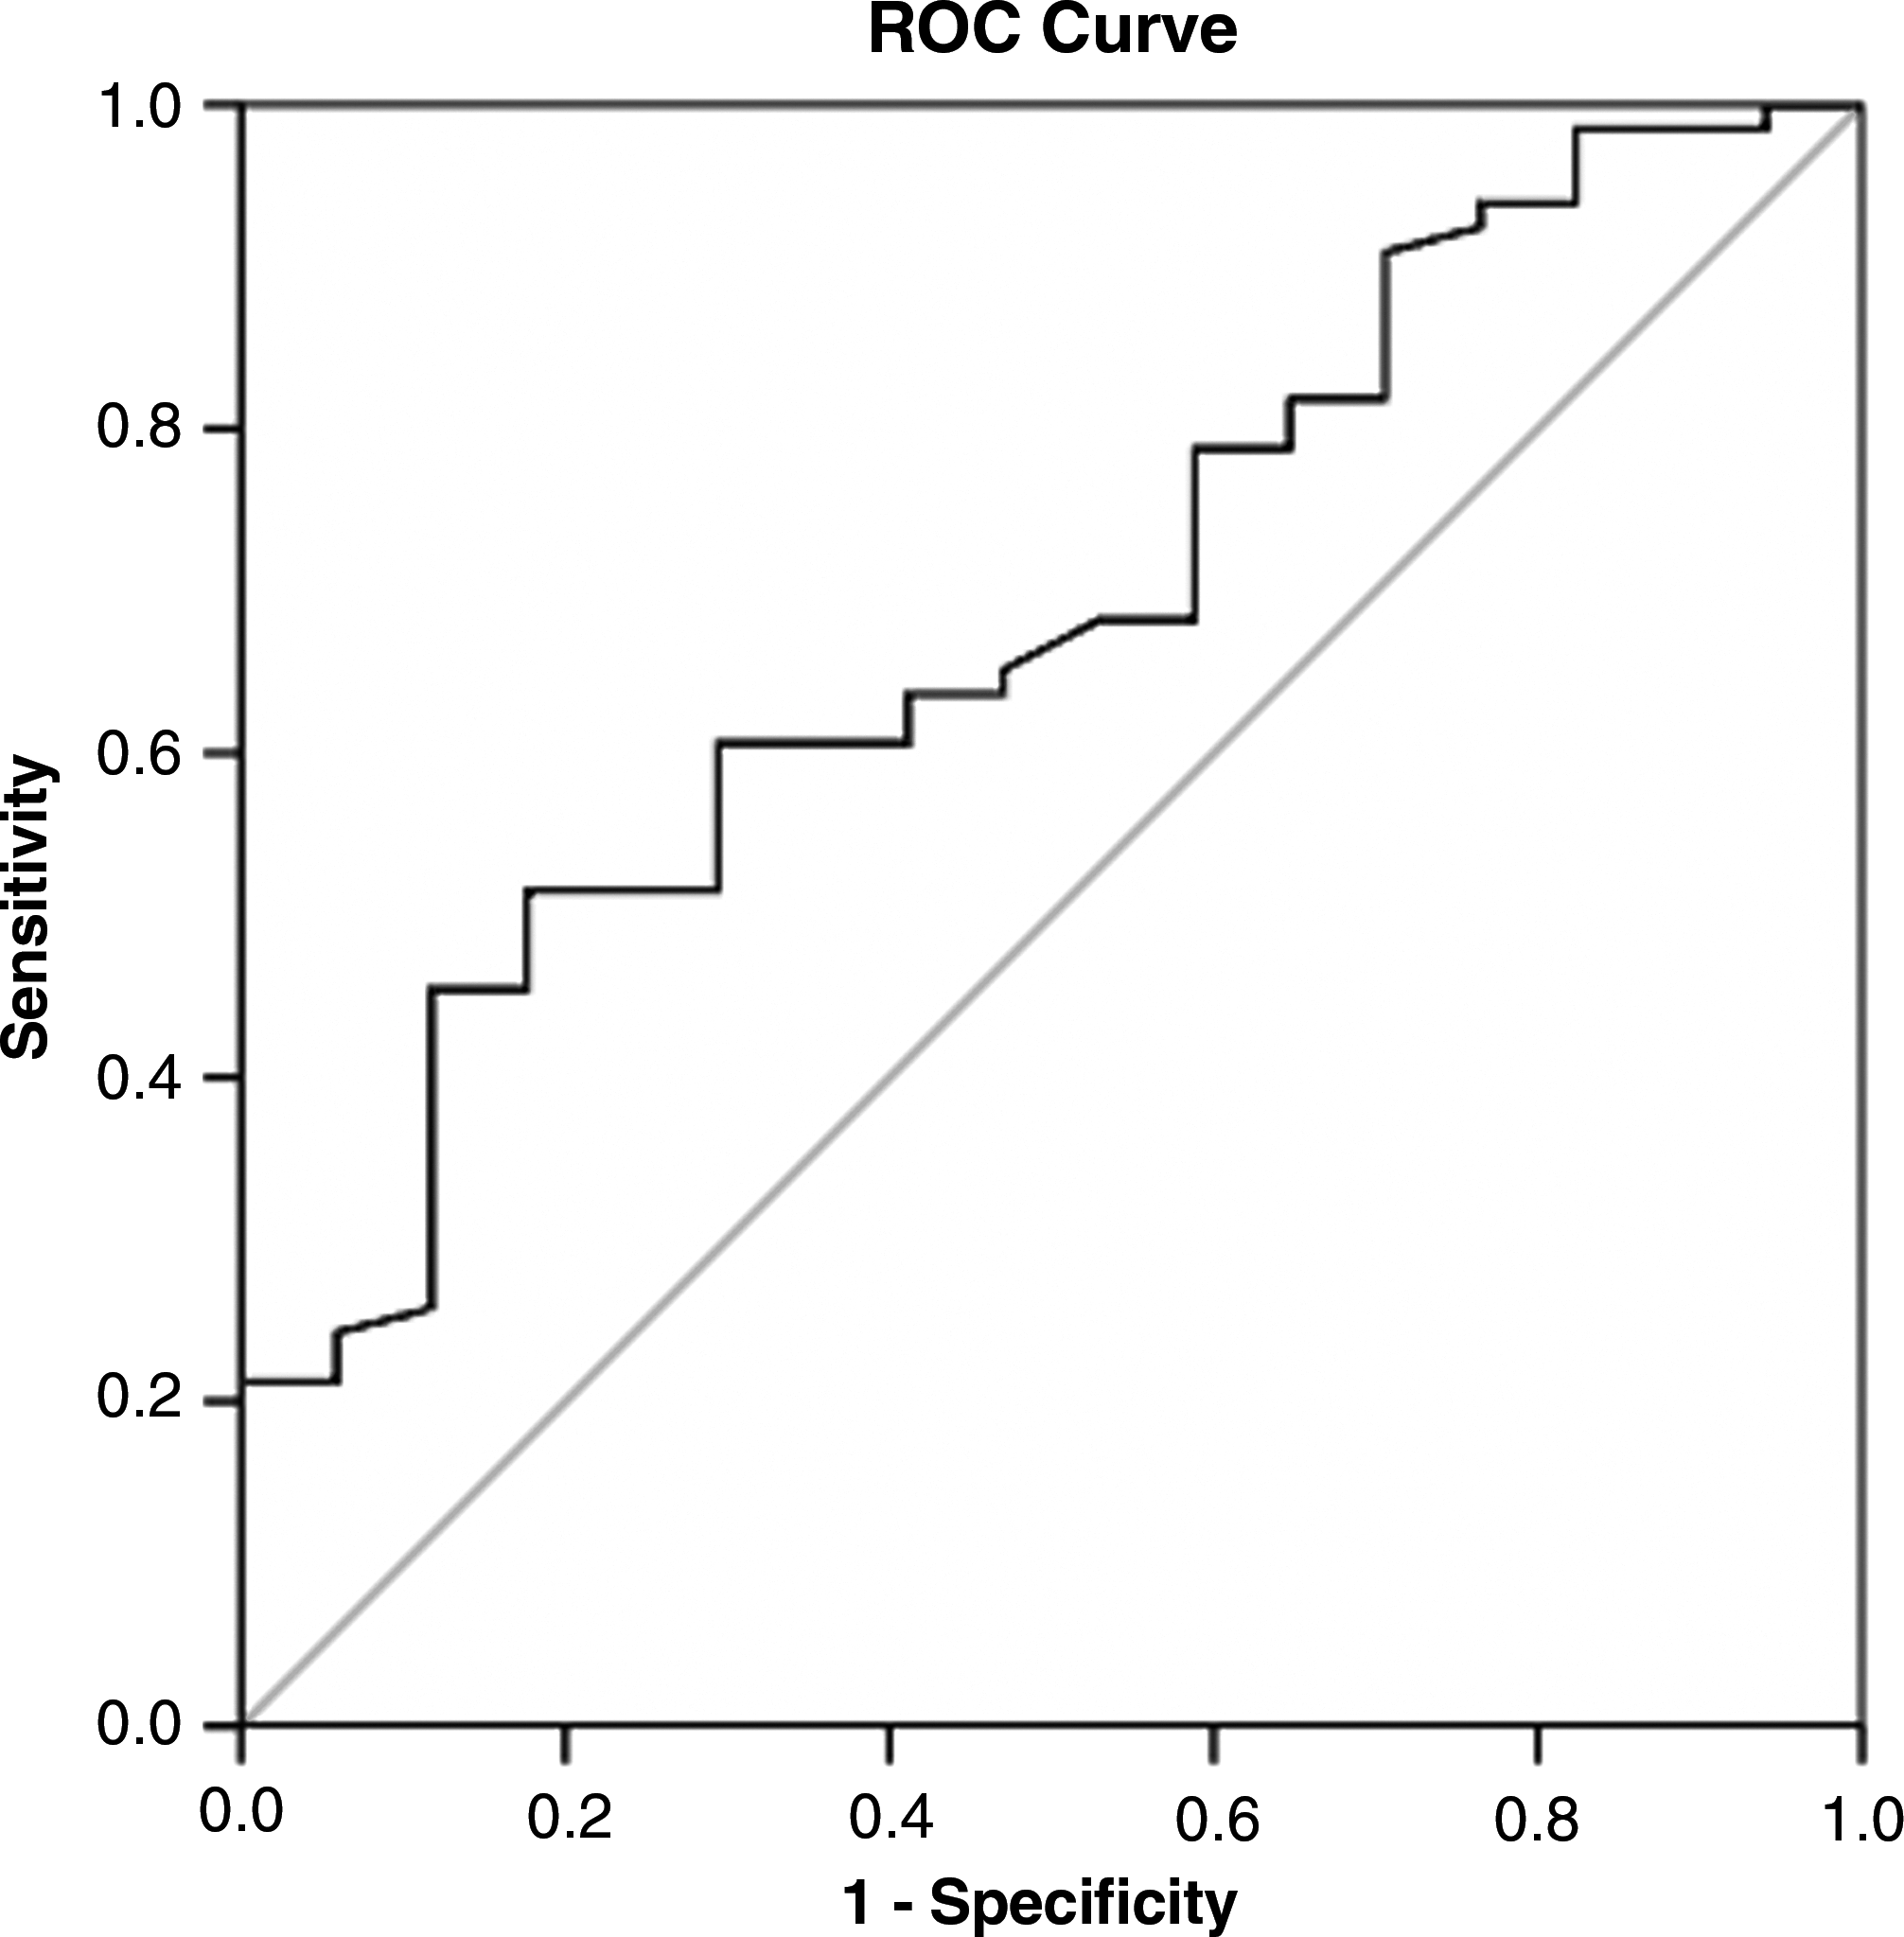
ROC curve of CTGF for significant fibrosis (F1–F4). The ROC curve was plotted by the sensitivity (y) and 1 – specificity (x). The AUC of CTGF for identification of significant fibrosis (F1–F4) as analyzed by SPSS was 0.681. At the threshold of 125.58 ng/mL, the sensitivity and specificity were 60.6% and 71.6%, respectively.
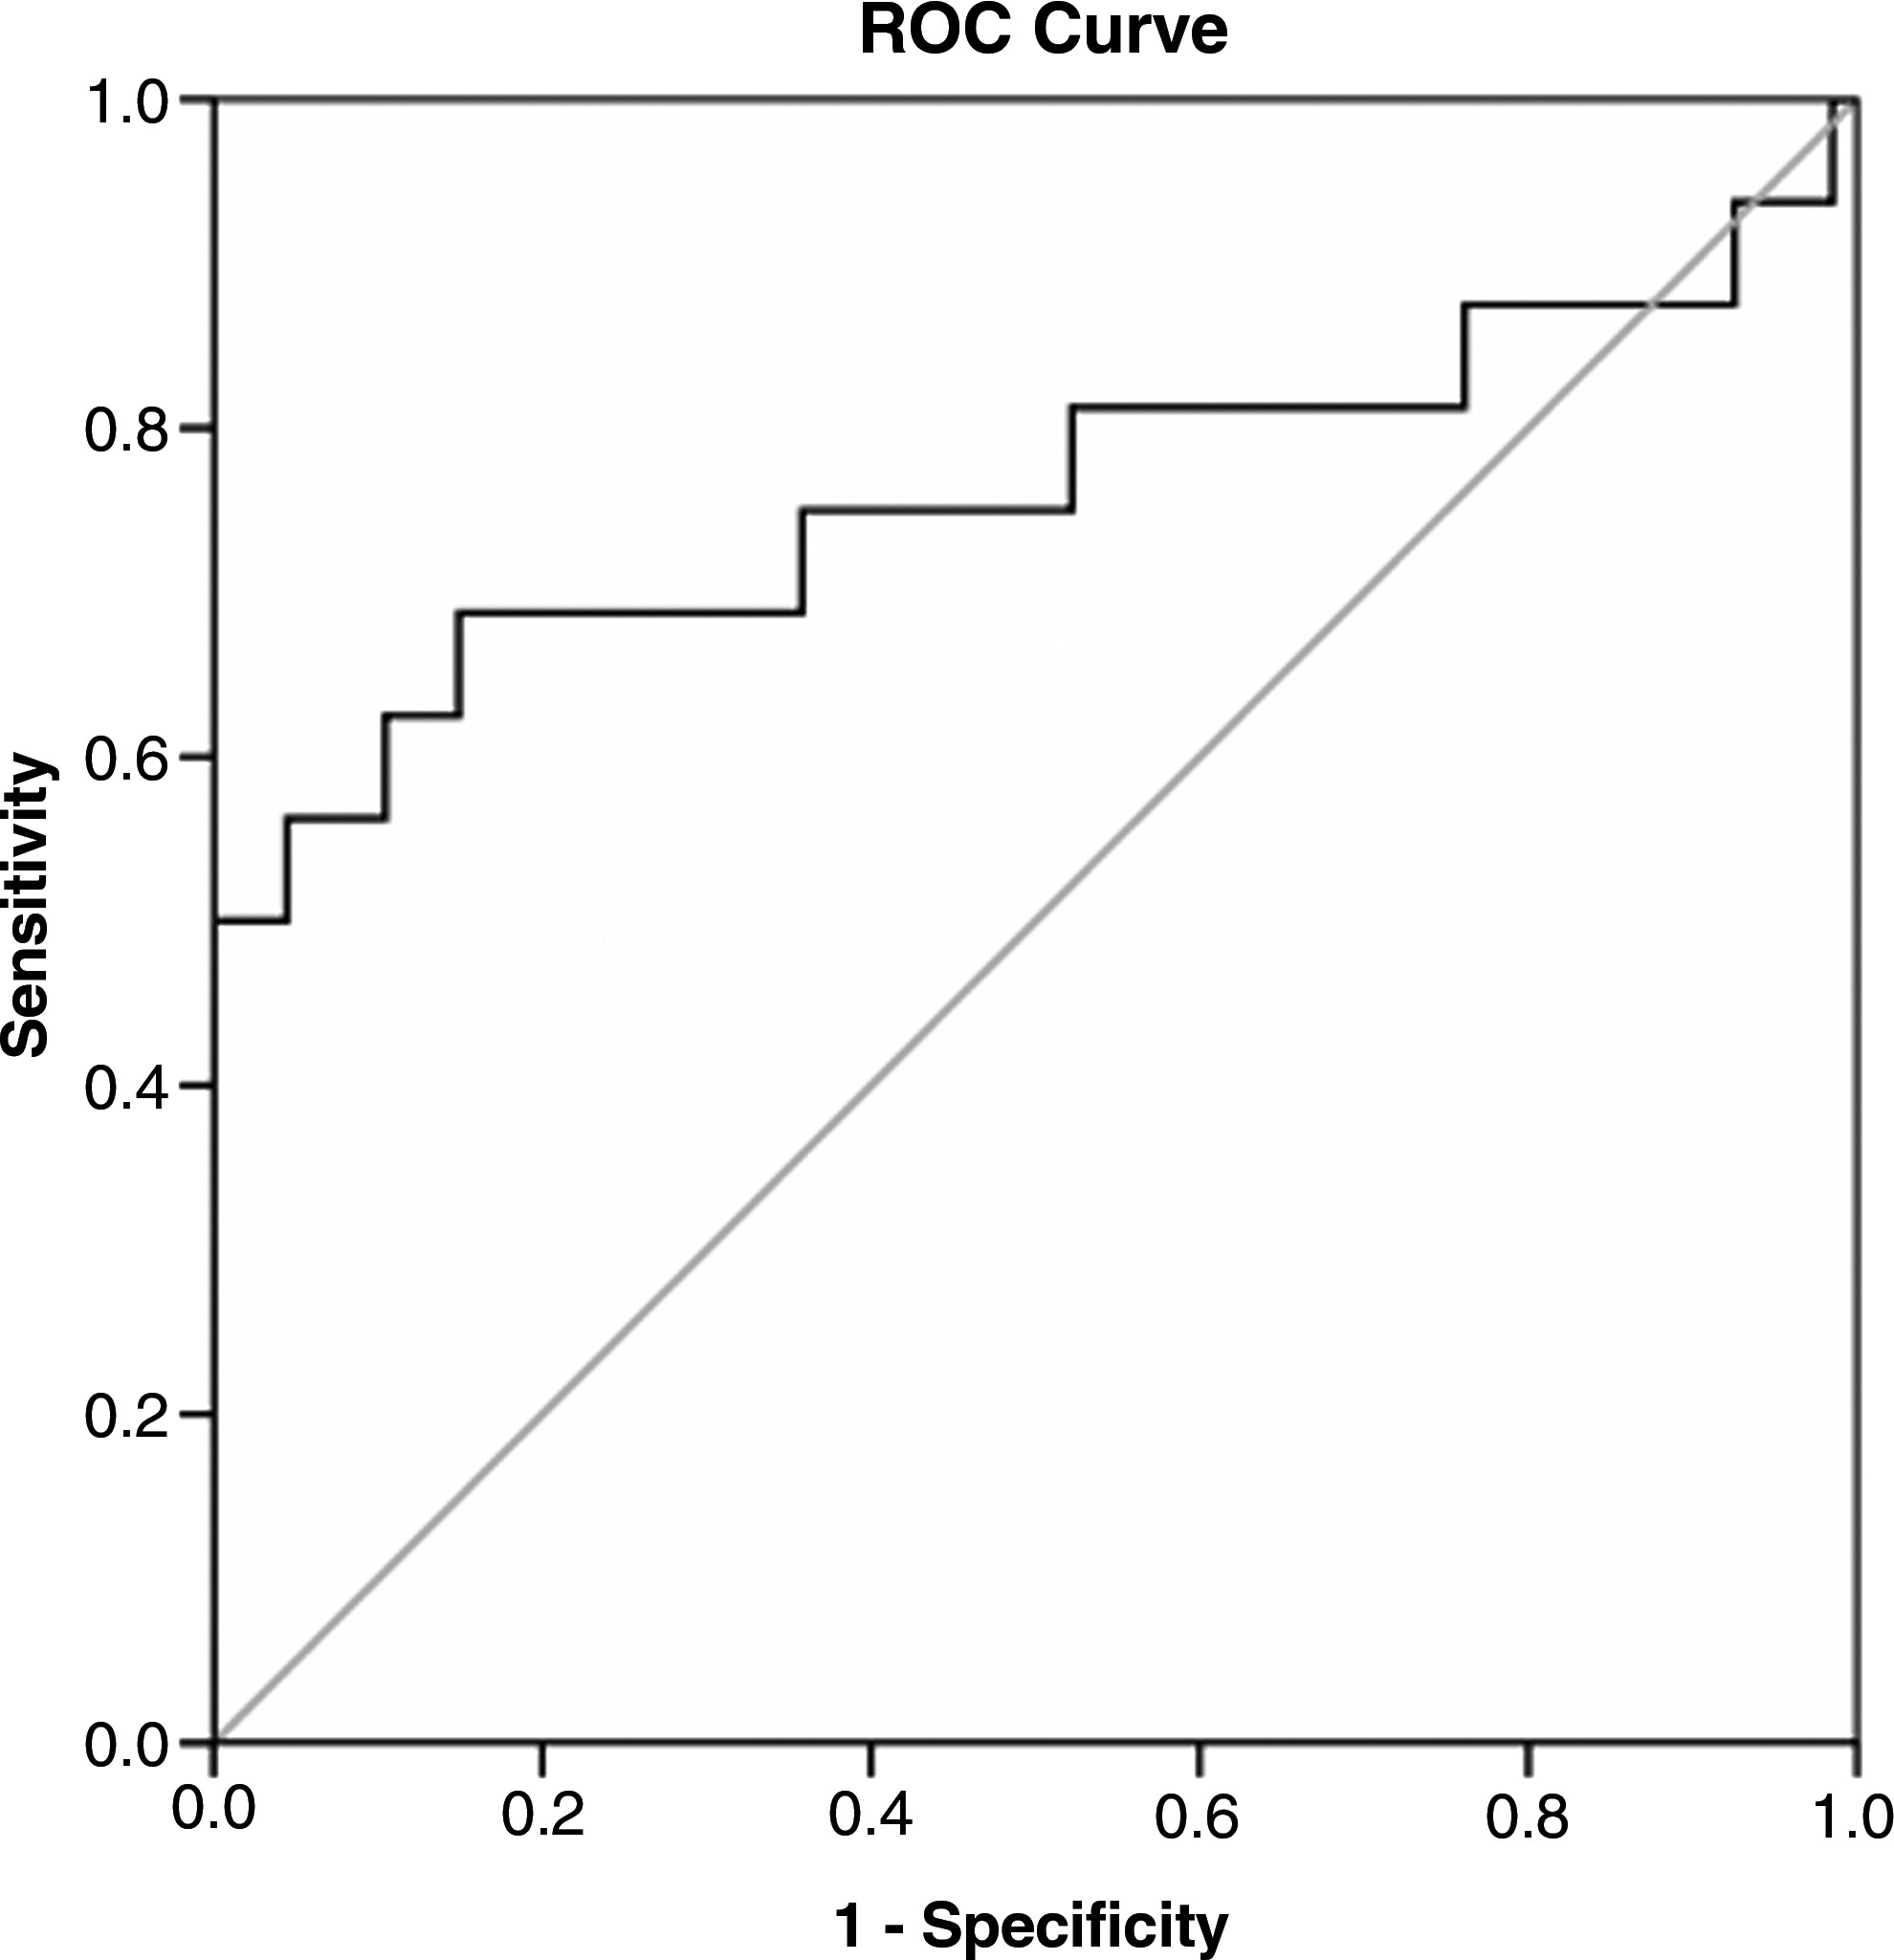
ROC curve of CTGF for middle- and late-stage liver fibrosis (F3–F4). The ROC curve was plotted by the sensitivity (y) and 1 – specificity (x). The AUC of CTGF for the diagnosis of middle- and late-stage liver fibrosis (F3–F4) as analyzed by SPSS was 0.759. At the cut-off value of 141.28 ng/mL, the sensitivity and specificity were 68.8% and 85.1%, respectively.
Discussion
Hepatic fibrosis is a pathological process, and liver cells respond to many chronic stimulators, such as chronic viral and parasitic infection, immunological attack, and metal and other toxins (16). Hepatocytes and hepatic stellate cells (HSCs) are the principal fibrogenic cells involved in the process of hepatic fibrosis (17,18). They are responsible for chronic stimulation, activation, and transformation, which are regulated by cytokines such as TGF-β and CTGF (19). CTGF overexpression has been demonstrated in human liver fibrosis and in activated HSCs (12,20,21). It was also reported that CTGF was upregulated when HSCs spontaneously differentiated into myofibroblasts in culture (22), and when HSCs were exposed to growth factors, cytokines, and lipid peroxidation products (23). Hepatocytes in situ and in culture proved to be a cellular source of CTGF mRNA and protein, respectively (13).
However, assessment of mRNA and protein concentrations of CTGF in the liver are not widely available in clinics and community hospitals. As CTGF is a secreted protein, we measured the serum concentration of CTGF in patients with hepatitis B, and investigated the correlation between serum CTGF concentration and stage of fibrosis, and determined whether serum CTGF concentrations could serve as a novel diagnostic parameter in hepatic fibrosis.
In this study, the CTGF C-terminal domain contained 10 cysteines, forming numerous disulfide bonds. The pET-32a(+) vector is designed for high-level expression of peptide sequences fused with the 109-amino acid TrxA protein, which may help peptides containing cysteines to form disulfide bonds more effectively. The molecular weight became larger after the 107-amino acid CTGF C domain was linked to TrxA, and the fusion protein was beneficial in producing polyclonal or monoclonal antibodies. In this study, we showed that the protein has strong immunogenity, and the titers of antibody were 1:106 (polyclonal antibody) and 1:107 (monoclonal antibody). Moreover, CTGF linked to TrxA increased the protein's stability; 80% and 90% of its immunoactivity was retained, respectively, when the fusion protein was stored at room temperature for 2 wk and 6 wk at 4°C (data not shown).
Clearly, detecting CTGF levels in serum by ELISA is more convenient than using Western blotting or immunohistochemistry, the experimental procedures of the latter methods were complex and materials for such testing are difficult to obtain. In this study, a sandwich ELISA method for determining the CTGF level was established. In this method, CTGF monoclonal antibody was used as the captured antibody, and CTGF polyclonal antibody was used as the second antibody. Theoretically, the specificity and the sensitivity of this method are better than those attained by the use of two polyclonal antibodies, such as the technique described by Gressner et al. (13), or via the use of two monoclonal antibodies, as described by Tamatani et al. (14). The average within-run and between-run CV of this method was 5.4% and 7.5%, respectively, and average recovery was 103.0%. The levels of hematological parameters (hemoglobin: 0–120 mg/L; total bilirubin: 0–15.0 mmol/L; triglycerides: 0–12.0 mmol/L) had no effect on the test results. The sensitivity of this method was 0.125 ng/mL, better than that attained by Gressner et al. (20 ng/mL), or Tamatani et al. (0.5 ng/mL), who used a biotin-avidin system. OD values were strongly correlated with CTGF concentrations (Fig. 2).
We demonstrated that CTGF is more highly expressed in the sera of patients with hepatitis B than in controls (161.50 ± 108.27 ng/mL versus 51.96 ± 5.81 ng/mL, respectively; p < 0.001). Our 83 serum samples from the hepatitis B patients were divided into five groups according to stage of fibrosis, and CTGF levels increased along with the severity of liver fibrosis (Fig. 3). In patients with cirrhosis, serum CTGF concentrations may reach 403.56 ± 315.27 ng/mL. The stage of liver fibrosis was strongly correlated with CTGF level (r = 0.8906, p < 0.005); thus CTGF may be an indicator of the severity of liver fibrosis. This association between serum CTGF level and fibrotic stage may mean that CTGF levels are predictive of the stage of hepatic fibrosis.
In the early stages of viral infection, the fractions of extracellular CTGF are greatly increased, as are some other cytokines such as TGF-β, that result from broken hepatocytes or virus-infected HSCs. Our preliminary data support that CTGF concentration increases with the severity of inflammation (A0–A3). However, it was surprising that the serum CTGF levels of patients with severe inflammation (A4) were lower than those with moderate inflammation (A3). Furthermore, the association between CTGF concentration and the grade of inflammation did not reach statistical significance (p > 0.05). It has been shown that CTGF is a possible key cytokine in progressive tissue fibrosis and scar and wound repair in various organs (24). We speculated that CTGF was also associated with recovery and healing after hepatic tissue injury, and was secreted by a variety of cells in the inflammatory process in the liver. This hypothesis was partially borne out by analysis of the CTGF concentration, fibrotic stage, and grade of inflammation. At the same stage of liver fibrosis, CTGF levels were not significantly different among those with various grades of inflammation (the F0–F2/A3–A4 group versus the F0–F2/A0–A2 group, p = 0.5744; the F3–F4/A3–A4 group versus the F3–F4/A0–A2 group, p = 0.3844). In addition, the limited number of samples of the A4 group may be one reason why CTGF concentration did not significantly relate to the grade of inflammation.
CTGF can stimulate the production and accumulation of ECM components, such as collagen, fibronectin, and laminin, and inhibit their degradation (25,26). In this study, the concentrations of hyaluronic acid, PCIII, laminin, and CIV in the sera of patients with hepatitis B were significantly increased compared to controls (data not shown). However, increased serum levels of these biomarkers may not indicate fibrotic stage or help guide anti-fibrotic treatment.
Multiple and simple linear regression analyses demonstrated that CTGF levels were independent of age, renal function, liver function, platelet counts, and other biochemical markers of liver fibrosis (all p > 0.05). No significant correlation was found between concentrations of serum CTGF and humoral factors, which are associated with liver fibrosis (all p > 0.05). CTGF was a better biomarker for diagnosing or predicting liver fibrosis than other known biomarkers, such as laminin, CIV, and PCIII, according to ROC analysis. The AUC of CTGF was 0.681 for identification of significant fibrosis (Fig. 5), and 0.759 for middle- and late-stage liver fibrosis (Fig. 6).
Conclusion
Fibrogenesis is difficult to heal when it reaches the middle or later stages. Therefore a simple, sensitive, and noninvasive method is needed to assess the prognosis and stage of liver fibrosis. Liver fibrosis can be treated at earlier stages if CTGF levels are found to progressively increase with worsening disease, and CTGF may thus be a useful diagnostic tool for reducing hepatic fibrosis.
Footnotes
Acknowledgment
This work was partly supported by National Natural Science Foundation of China (No: 30970809, 30840042), and the Fund of Science Research (No: XY2008341, 9290002295) from Southeast University, PRC.
Author Disclosure Statement
No conflicting financial interests exist.