
Abstract
We longitudinally evaluated HIV-specific T-cell immunity after discontinuation of highly active antiretroviral therapy (HAART). After treatment interruption (TI), some individuals could maintain a low plasma viral load (<15,000 copies/mL), whereas others could not (>50,000 copies/mL). Before HAART was initiated, plasma viral load was similar. After TI, the numbers of CD8+ T cells increased more in individuals without viral control, whereas individuals maintaining a low viral load showed a more pronounced increase in HIV-specific CD8+ T-cell numbers. No differences were seen in the number or percentage of cytokine-producing HIV-1-specific CD4+ T cells, or in proliferative capacity of T cells. Four weeks after TI, the magnitude of the total HIV-1-specific CD8+ T-cell response (IFN-γ+ and/or IL-2+ and/or CD107a+) was significantly higher in individuals maintaining viral control. Degranulation contributed more to the overall CD8+ T-cell response than cytokine production. Whether increased T-cell functionality is a cause or consequence of low viral load remains to be elucidated.
Introduction
Discontinuation of therapy usually results in rapid viral rebound to pretreatment viral load levels (12), although there have also been cases reported of virological control after treatment interruption (21,35). The mechanisms responsible for this (temporary) virological control have thus far remained unclear. There is a debate about whether it is beneficial to start treatment during primary HIV-1 infection. Using computer simulations, Paci et al. showed that there is no difference in the disease-free period or survival after treatment interruption when HAART is started during the acute phase of primary infection, compared to starting it at a later stage during chronic infection (28). In contrast, Steingrover et al. did show a clinical benefit of starting HAART during primary infection, as they observed that the median time to viral rebound after treatment interruption was significantly longer in primary than in chronically-infected patients (33). Current guidelines, however, advise to start therapy in HIV-1-infected individuals when CD4+ T-lymphocyte counts (CD4 counts) drop below 350 cells/μL (5). Between 1996 and 2000, according to the older guidelines, many HIV-1-positive individuals initiated HAART when CD4 counts were still above 350 cells/μL. Several of these individuals and their clinicians consider stopping HAART, often due to emerging toxicity or compliance problems. This interruption of therapy could result in the resolution of the adverse effects of HAART. The immunological consequences of treatment interruption are, however, not yet fully understood.
Here we present a detailed longitudinal analysis of both CD4+ and CD8+ T-cell responses after treatment interruption in individuals who initiated HAART when their CD4 counts were still above 350 cells/μL. We compared different HIV-1-specific T-cell functions in individuals who had a low viral load after treatment interruption with individuals who had higher viral load levels, to investigate a possible underlying immunological explanation for the difference between these two groups, who had at baseline comparable plasma viral loads.
Materials and Methods
Patient characteristics
A prospective, non-randomized, multicenter intervention study (TRIESTAN; Treatment Interruption in Early Starters Netherlands) was designed to evaluate the short-term and long-term outcome of HAART discontinuation among HIV-1-infected individuals who initiated HAART with CD4+ T-lymphocyte counts above 350 cells/μL (31). The primary criteria for inclusion in the TRIESTAN study were: HIV-1-positive, older than 18 years, initiation of HAART at a CD4+ T-lymphocyte count above 350 cells/μL, no antiretroviral therapy prior to HAART, and at least 1 y of HAART. In addition, at the time of inclusion, eligible individuals had to have an HIV-1 RNA load below 500 copies/mL, as well as a CD4+ count of more than 500 cells/μL for more than 6 mo (for other characteristics of the TRIESTAN study population see reference 31). All individuals who fulfilled the criteria for inclusion in this study were identified from the ATHENA national observational cohort, a collaboration of the 22 HIV treatment centers in The Netherlands. Of the 46 individuals who decided to stop therapy, 11 individuals were selected for the present study based on viral load data, availability of cryopreserved PBMCs, and HLA type. They were subsequently followed for 24 wk after treatment discontinuation. See Table 1 for treatment characteristics of the 11 individuals.
Group I had a high viral load, and group II had a low viral load.
Time between seroconversion and initiation of HAART in months.
Time on HAART in months.
Last treatment combination before HAART was interrupted.
Failed treatment once before HAART was interrupted.
3TC, lamivudine; d4T, stavudine; ABC, abacavir; RTV, ritonavir; NVP, nevirapine; LOP/r, lopinavir/ritonavir; TDF, tenofovir DF; NFV, nelfinavir; EFV, efavirenz.
Viral load determination
Plasma HIV RNA load was quantified using the Quantiplex bDNA 3.0 assay (Bayer Corp., Tarrytown, NY), with a detection limit of 50 copies/mL.
CD4+ T-cell stimulation and intracellular cytokine staining
Cryopreserved PBMCs were thawed and aliquotted at 2 × 10⁶ cells per mL in round-bottom tubes (Becton Dickinson [BD], San Jose, CA). PBMCs were stimulated for 6 h with a Gag-peptide pool (15mers with 11 overlap, final concentration of the individual peptides was 2 μg/mL; Consensus B, National Institutes of Health [NIH] AIDS Research and Reference Reagent Program, Bethesda, MD), in the presence of co-stimulation (2 μg/mL αCD28; Sanquin Reagents, Amsterdam, The Netherlands), and 2 μg/mL αCD49d (Pharmingen, San José, CA). As a positive control, PMA and ionomycin (5 ng/mL and 1 μg/mL, respectively; Sigma-Aldrich, Zwijndrecht, The Netherlands) were used. After 1.5 h, monensin (3 μM; Sigma-Aldrich) was added. After fixation and permeabilization (permeabilization reagents from BD), the cells were stained with αCD3-PerCP, αCD4-PECy7, αIFN-γ-FITC, and αIL-2-PE monoclonal antibodies (BD) for 20 min at 4°C. The cells were fixed in cellfix (BD), and six-color flow cytometry was performed. The lymphocytes were gated based on forward- and sideward-scatter, and CD4+ T cells were gated on the basis of CD3 and CD4 expression. At least 300,000 events were acquired using the LSRII flow cytometer (BD). Responses above 0.02% after subtraction of negative control values were considered positive. Data were analyzed using DIVA software (BD).
Tetramer staining and CD8+ T-cell stimulation
PBMCs were stimulated for 4 h with either the Gag peptide pool or a dominant HIV peptide (final concentration 1 μg/mL), selected based on the individual's HLA type in the presence of monensin (3 μM; Sigma-Aldrich), and αCD107a-FITC (BD). The peptides used were HLA-A2 (SLYNTVATL)-, HLA-A3 (RLRPRGGKKK)-, HLA-B7 (TPGPGTRFP)-, or HLA-B8 (FLKEKKGL or EIYKRWII)-restricted.
Next the cells were stained with HIV-1-specific tetramers for 20 min at room temperature. Immunodominant peptides derived from HXB2 p17 Gag (SLYNTVATL) and Nef (TPGPGTRFP, FLKEKKGL) were tetramerized as previously described (2,18), and used corresponding to the individual's HLA type. After fixation and permeabilization (permeabilization reagents from BD), the cells were stained with αCD8-PerCPCy5.5, αIFN-γ-PECy7, and αIL-2-APC monoclonal antibodies (BD) for 20 min at 4°C. The cells were fixed in cellfix (BD), and six-color flow cytometry was performed. The lymphocytes were gated based on forward- and sideward-scatter, and CD8+ T cells were gated on the basis of CD3 and CD8 expression.
At least 300,000 events were acquired using the LSRII flow cytometer. Responses above 0.02% after subtraction of negative control values were considered positive. Data were analyzed using DIVA software.
Flow cytometric analysis of T-cell activation markers
Expression of activation markers on CD4+ and CD8+ T cells was measured after staining cells with αCD4-APC, αCD8-PerCP, αCD38-FITC, and αHLA-DR-PE monoclonal antibodies (BD). All incubation steps were performed at 4°C for 20 min. Cells were fixed in cellfix and analyzed with the LSRII flow cytometer using DIVA software.
Antigen-specific proliferation
In vitro T-lymphocyte proliferation was measured using 5,6-carboxyfluorescein diacetate succinimidyl ester (CFSE; Molecular Probes, Leiden, The Netherlands), according to the manufacturer's protocol. Briefly, the PBMCs were thawed and the cells were labeled using CFSE for 8 min at room temperature. Labeling was stopped by using human pooled serum (HPS), and the cells were washed and aliquotted at 2 × 10⁶ cells/mL in round-bottom tubes. The cells were stimulated with the Gag peptide pool. As a positive control, 0.02 μg αCD3 and 2 μg αCD28 (Sanquin Reagents) was used. After 6 d of incubation at 37°C in 5% CO2 the cells were stained using αCD3-PerCP, αCD4-PeCy7, and αCD8-APC, as previously described. The percentage of CD4+ and CD8+ T cells that underwent one or more divisions was calculated by subtraction of the proliferation in the absence of the stimulus. Stimulation indices (SI) were calculated by dividing the percentage of proliferating cells after stimulation by the percentage proliferation of unstimulated cells.
Statistical analysis
Differences between patient groups were analyzed using the Mann-Whitney U test. Wilcoxon tests were performed to determine differences between time points. Correlations were tested using Spearman's correlation test. All statistical analyses were performed using SPSS v. 12.01 (SPSS Inc., Chicago, IL).
Results
Characteristics of the study population
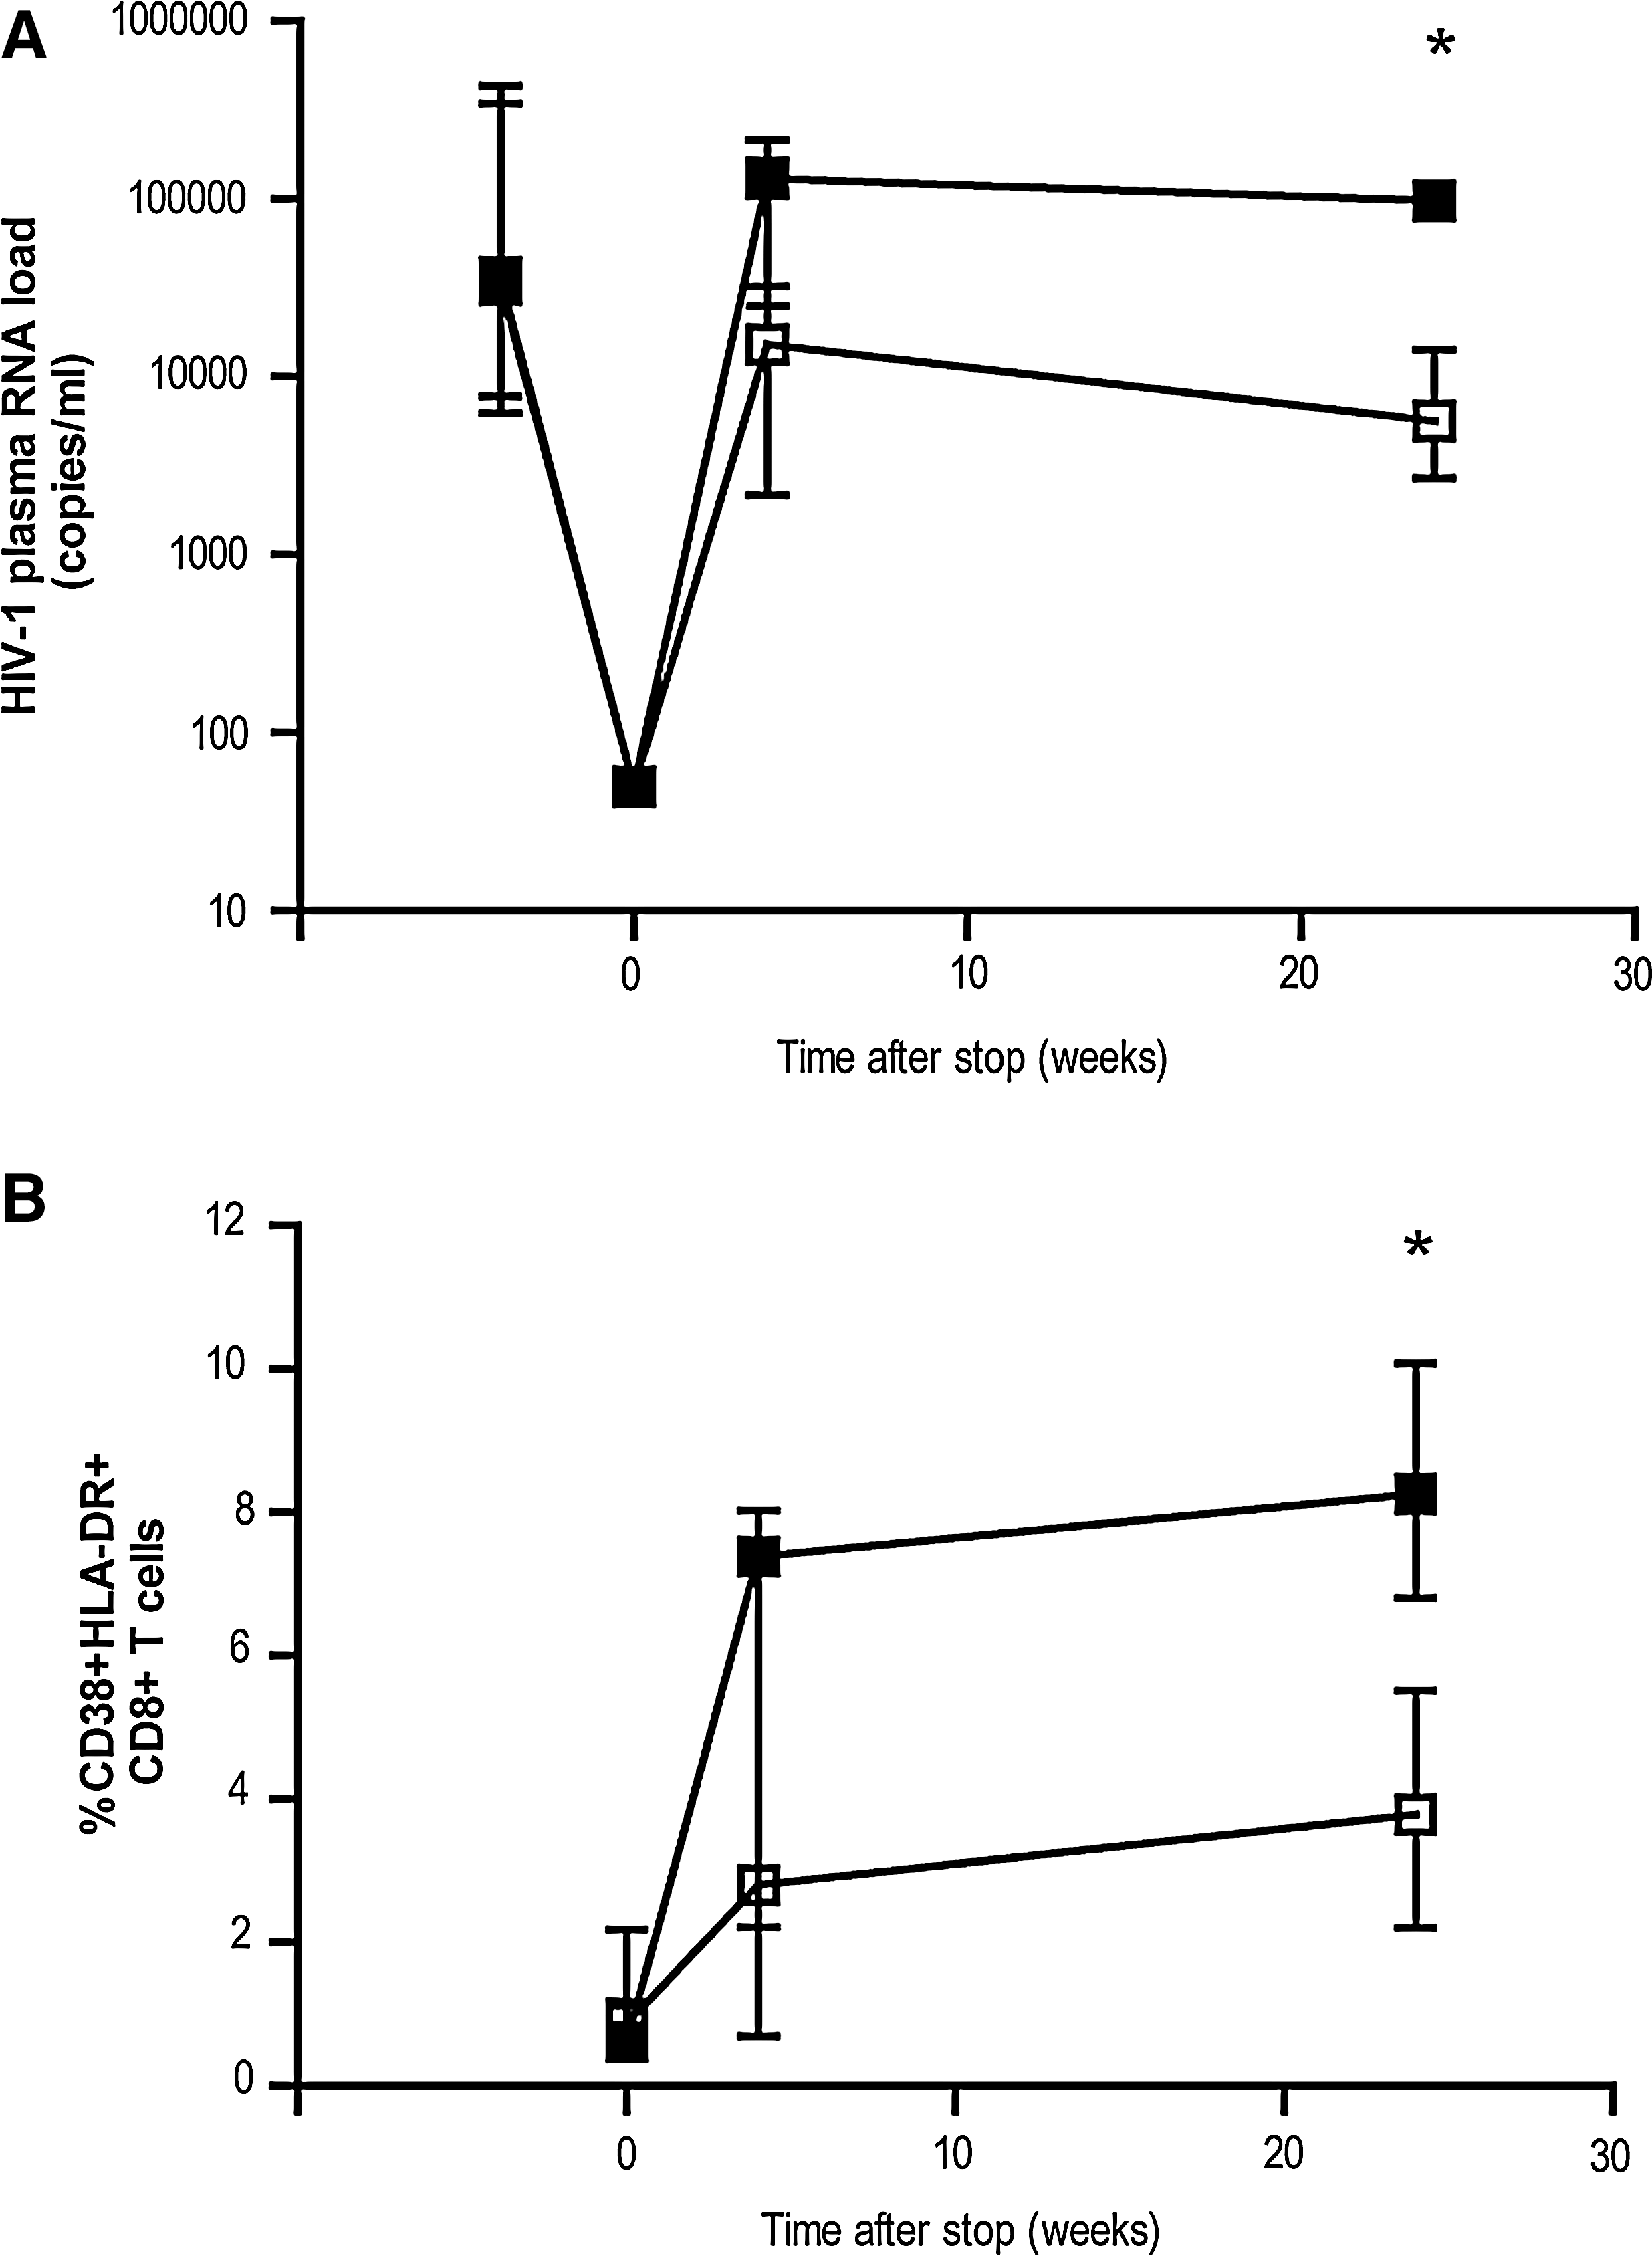
Eleven HIV-1-infected individuals with CD4 counts above 350 cells/μL when treatment was initiated were included in this study. All individuals were successfully treated with HAART for at least 12 mo. At the time of therapy interruption, all individuals had an HIV-1 plasma RNA load below the detection limit of 50 copies/mL. After 24 weeks, however, the individuals could be divided in two groups based on their viral load. The first group (six individuals) was able to maintain a low viral load (viral load <15,000 copies/mL), whereas the second group (five individuals) was not (viral load >50,000 copies/mL; p = 0.006; Table 2 and Fig. 1A). At baseline (before HAART was initiated), there was no significant difference between the two groups in viral load, or for CD4 and CD8 cell counts (Table 2).
Effect of treatment interruption on viral load and activation status of CD8+ T cells. Longitudinal analysis of HIV-1 RNA plasma viral load
Group I = high viral load group; group II = low viral load group.
Plasma HIV-1 RNA load (copies/mL).
CD4 counts in cells/μL.
CD8 counts in cells/μL.
Before therapy was initiated.
At the time therapy was stopped.
Four weeks after therapy was stopped.
Twenty-four weeks after therapy was stopped.
p Values indicate the differences between the two groups at each time point (by Mann-Whitney U test).
nd, not determined.
Treatment discontinuation results in an increase in activated CD8+ T cells
Twenty-four weeks after cessation of therapy, the total CD8 cell counts were significantly higher in the individuals maintaining a low viral load (p = 0.04). Although the percentage of activated CD8+ T cells (as measured by the activation markers CD38 and HLA-DR) increased after treatment interruption in both groups, the percentage of activated CD8+ T cells at 24 wk post-treatment discontinuation was significantly higher in those with a high viral load than in those with a low viral load (Fig. 1B; p = 0.011). There was a clear correlation between the percentage of activated CD8+ T cells and viral load (R = 0.791; p = 0.004 by Spearman's rho, data not shown) at 24 wk after treatment interruption. Although there was also a slight increase in the percentage of activated CD4+ T cells at 4 wk after cessation of treatment, this did not reach significance, and the levels had decreased by 24 wk post-cessation (data not shown).
Stable number of cytokine-producing HIV-1-specific CD4+ T cells
To determine whether the difference in viral load dynamics after treatment discontinuation could be explained by cytokine-producing CD4+ T cells, both IFN-γ and IL-2 production were analyzed after stimulation with an overlapping Gag-peptide pool. Levels of Gag-specific CD4+ T cells producing IFN-γ or IL-2 were low but detectable during HAART in most individuals. After treatment interruption, both the percentages and absolute numbers of Gag-specific cytokine-producing CD4+ T cells remained comparable to the levels observed at the moment of treatment interruption (see Fig. 2A for a representative example). No significant differences were observed between the two groups in either the percentage or the absolute number of cytokine producing CD4+ T cells (Fig. 2B).
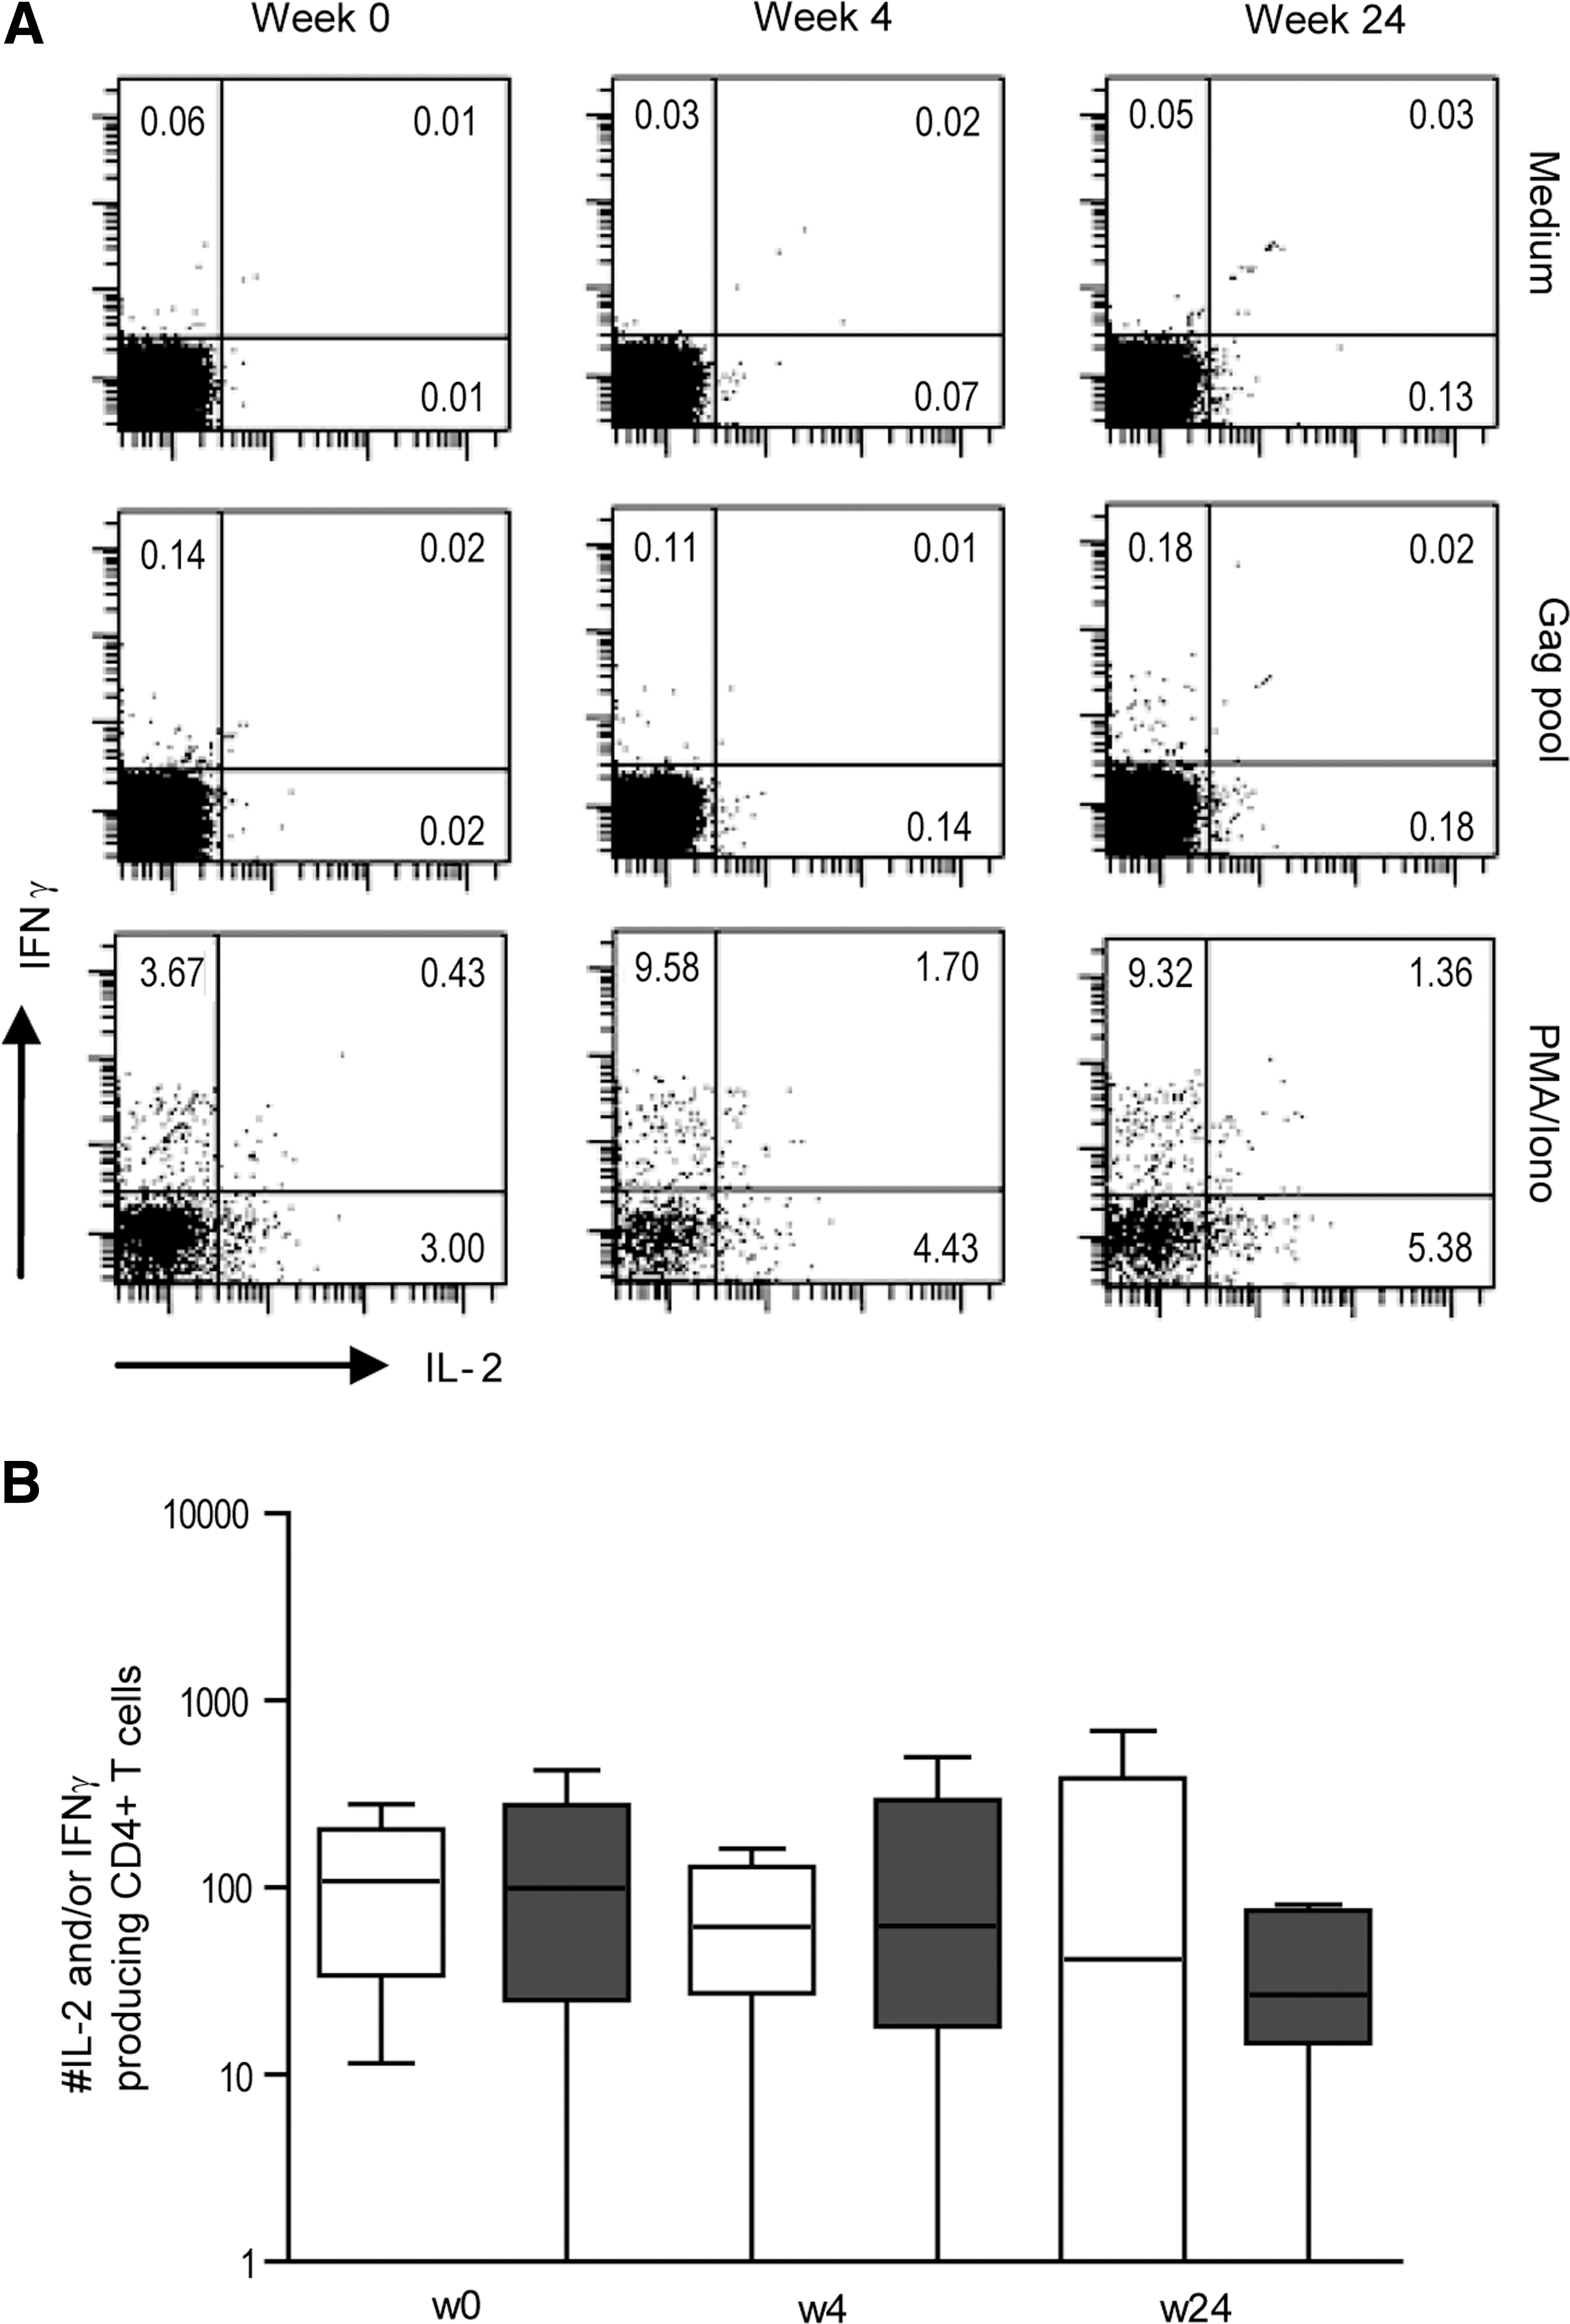
Stable numbers of cytokine-producing HIV-1-specific CD4+ T cells.
Increased numbers of HIV-1-specific CD8+ T cells after treatment discontinuation
In the individuals expressing an HLA type for which tetramers were available, PBMCs were stained with one or more HIV-1-specific tetramers. In the total study population there was a significant increase in both the percentage [median (range) at week 0: 0.04% (0.03–0.11%), at week 24: 0.26% (0–1.29%); p = 0.043], and the absolute number [week 0: 44 (14–143) tetramer+ cells/mL, at week 24: 601 (47–1191) tetramer+ cells/mL; p = 0.028] of HIV-1-specific CD8+ T cells after treatment interruption (Fig. 3A). There was a trend toward higher percentages (and absolute numbers) of HIV-1-specific CD8+ T cells in the individuals with a low viral load [week 0: 0.07% (0.04–0.11%), at week 24: 0.41% (0–0.58%)], compared to those with a viral load >50,000 copies/mL [week 0: 0.04% (0.03–0.09%), at week 24: 0.09% (0.05–1.29%)], but this difference was not significant.
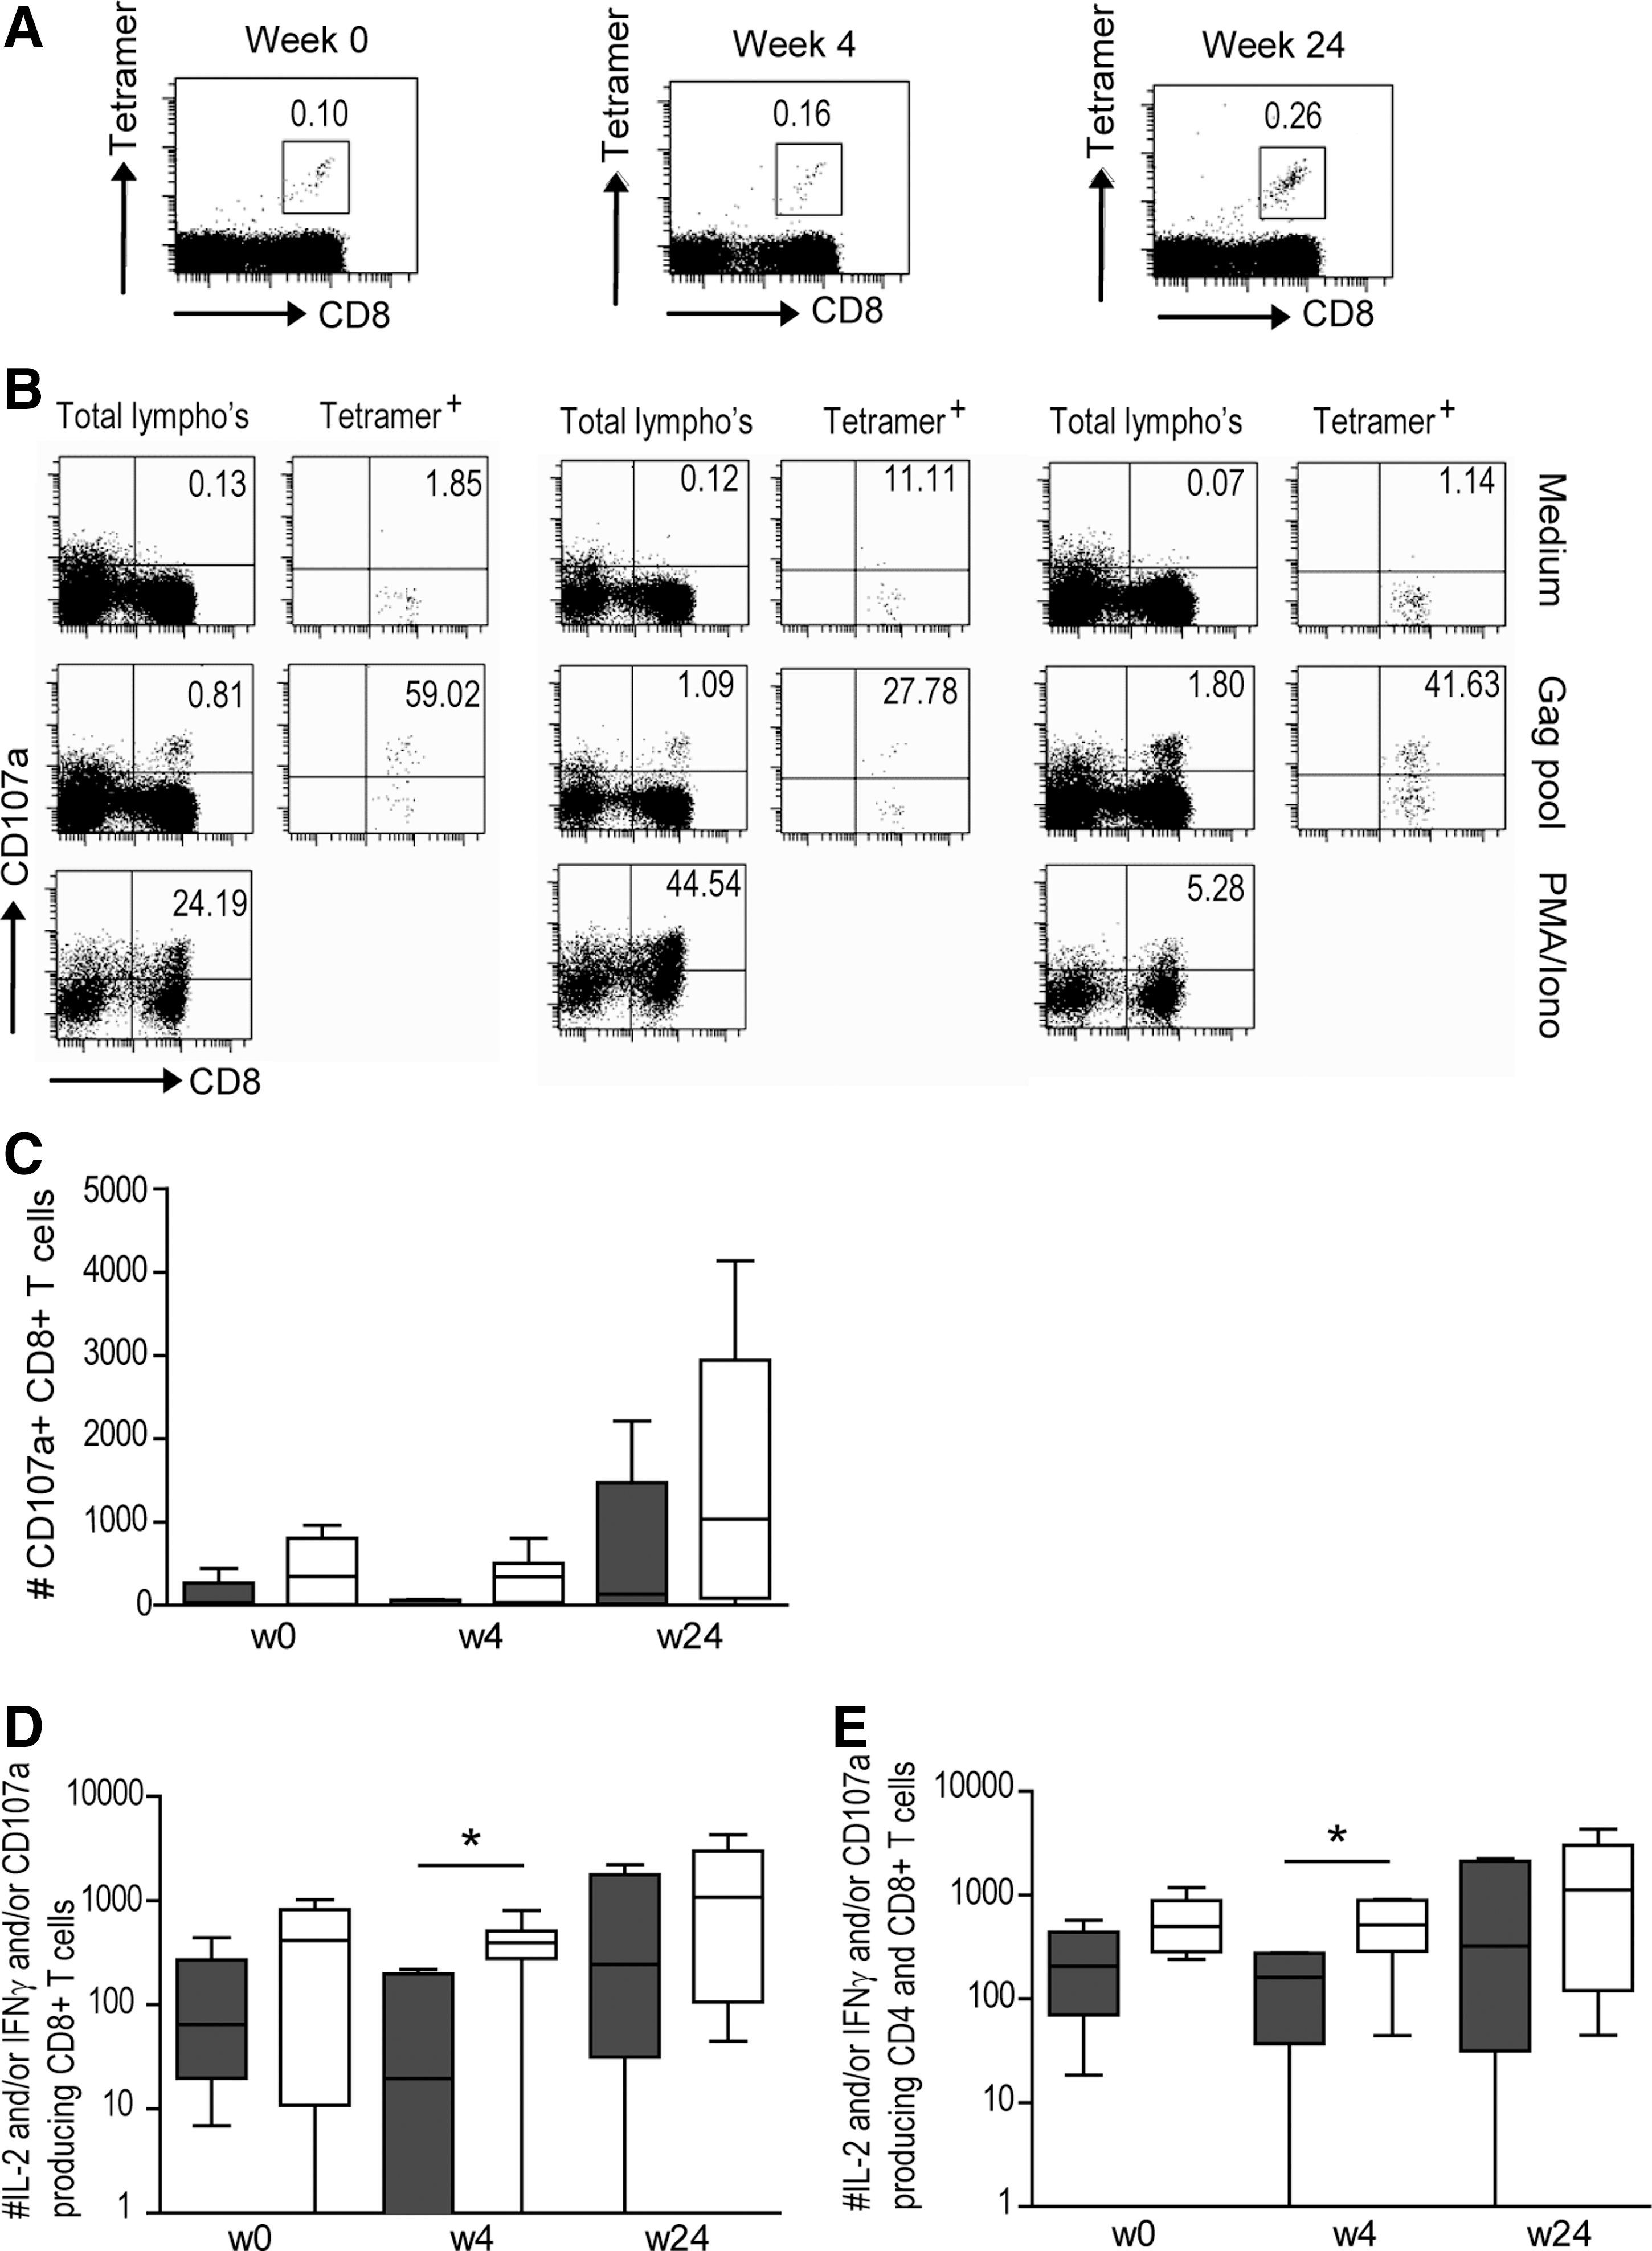
Increased CD8+ T-cell function in individuals capable of maintaining a low viral load.
Higher numbers of functional CD8+ T cells are seen in individuals capable of maintaining a low viral load
Recently, Lopez et al. have shown an increase in CD8+ T-cell function at 12 mo after treatment interruption (22). This suggests that higher functionality of CD8+ T-cell responses does not appear to be a consequence of a low level of virus replication. To reveal potential differences in CD8+ T-cell function between individuals with low and high viral loads after treatment interruption, both cytokine production (IFN-γ and IL-2), as well as degranulation capacity (CD107a), were measured after stimulation with an overlapping Gag peptide pool, or selected optimal HLA class I HIV-1 peptides (see Fig. 3B for a representative example). Although the numbers of cytokine-producing CD8+ T cells remained low during follow-up, the number of CD107a-expressing CD8+ T cells in the total study population increased in the first 24 wk after therapy interruption (p = 0.05; Fig. 3C). By comparing the total numbers of functional CD8+ T cells (i.e., the combination of IFN-γ+, IL-2+, and CD107a+ CD8+ T cells), we observed a gradual increase after treatment interruption in the entire study population (Fig. 3D). Regression analysis showed that there was a significant relationship between the CD8+ T-cell response at the time of treatment interruption and viral load at 24 wk after treatment interruption in the entire study population (R2 = 0.47, p = 0.028). The absolute numbers of functional CD8+ T cells at 4 wk after cessation was significantly higher in individuals capable of maintaining a low viral load at 24 wk after treatment interruption (p = 0.043). Interestingly, albeit not significantly, when CD4+ and CD8+ T cell numbers were combined, there appeared to already be a trend toward higher absolute numbers of functional T cells at the time of treatment interruption in individuals capable of maintaining a low viral load at 24 wk after treatment was stopped (week 0, p = 0.068; Fig. 3E).
No difference was seen in proliferative capacity of CD4+ and CD8+ T cells
Previously it has been shown that the capacity of HIV-1-specific CD4+ T cells to proliferate upon stimulation with HIV-1 Gag correlated significantly with a persistently AIDS-free infection (32). Moreover, we have found that the proliferative capacity increases when individuals are treated with HAART, but decreases again when treatment is stopped (14). To investigate the proliferative capacity of HIV-1-specific T cells after treatment interruption in the individuals studied here, CFSE dilution by cell proliferation after 6 days of stimulation with the overlapping Gag-peptide pool was studied. We used the combination of αCD3 and αCD28 as a positive control, which resulted in a mean SI of 21.27 (range 1.12–67.47). No significant difference in proliferative capacity after stimulation with the Gag-peptide pool (Fig. 4), or positive control, was observed between the two groups for CD4+ T cells and CD8+ T cells, at any time point.
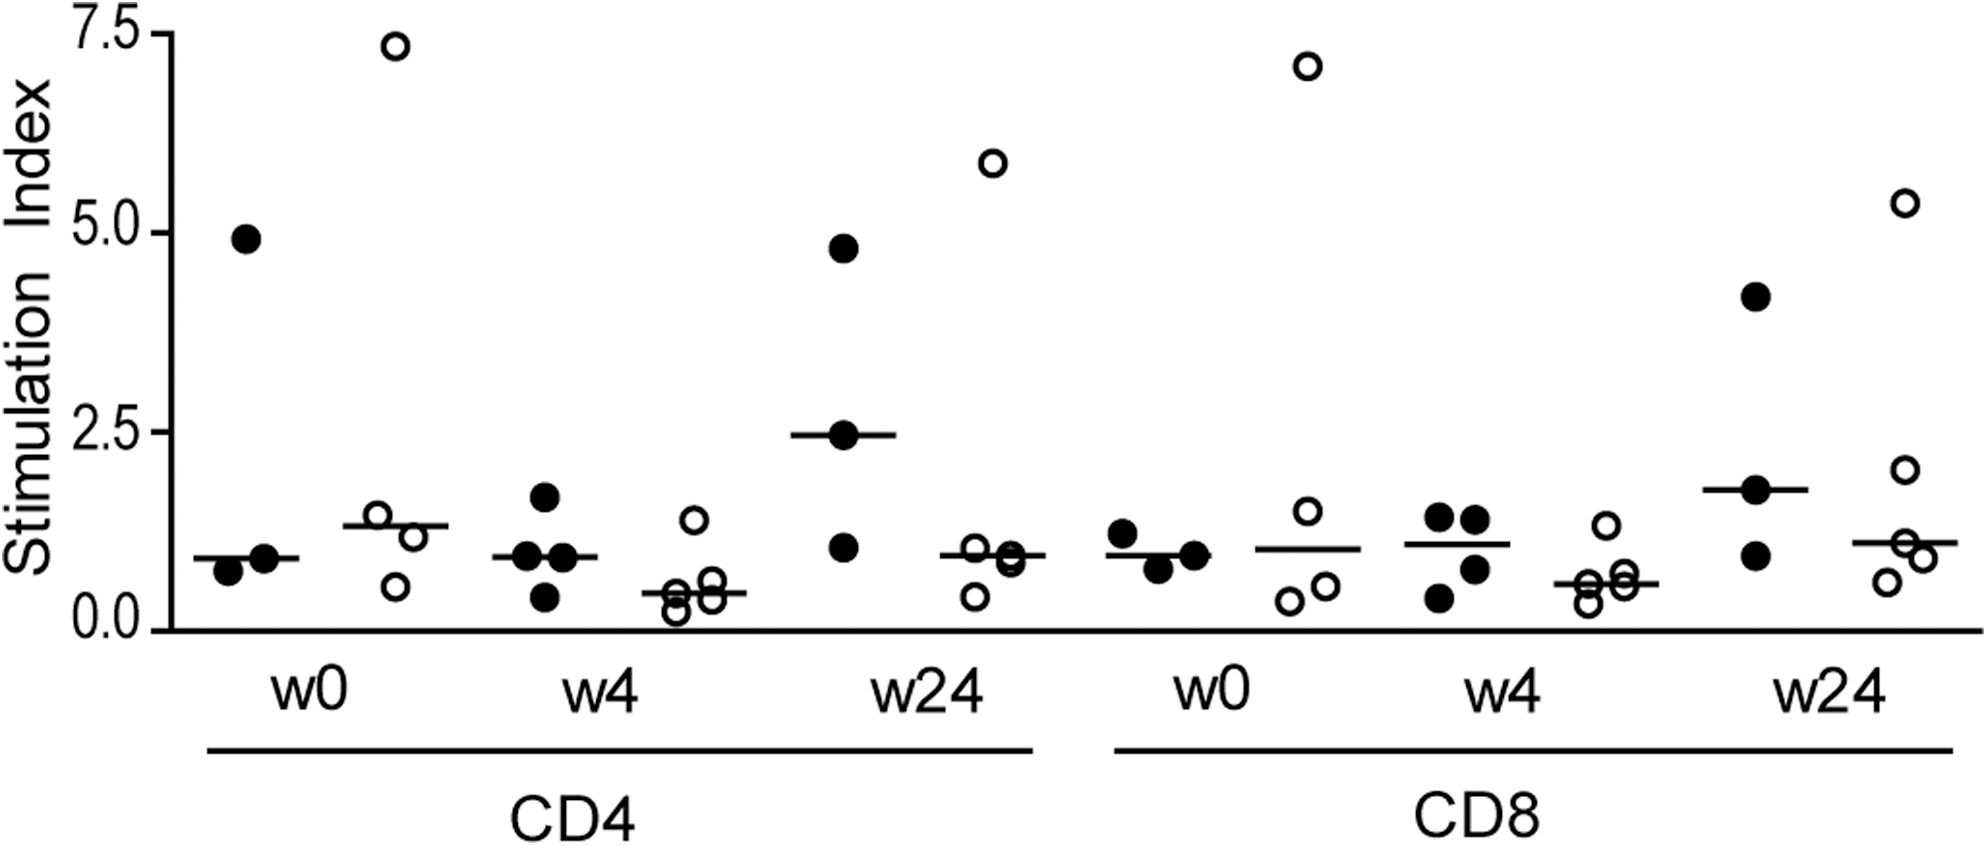
No difference in the proliferative capacity of CD4+ and CD8+ T cells was seen. PBMCs were labeled with CFSE and proliferative capacity was determined 6 d later. Stimulation indices for CD4+ and CD8+ T cells were calculated by dividing the percentage proliferation after stimulation with the Gag peptide pool by the percentage proliferation of unstimulated cells. Open circles represent individuals with a viral load <15,000 copies/mL, while dark circles represent individuals with a viral load >50,000 copies/mL at 24 wk after treatment interruption.
Discussion
Under previous guidelines in the late 1990s many HIV-1-infected individuals started antiviral treatment when CD4 counts reached 350 cells/μL. Although some treatment interruption trials have shown an increase in disease progression (7,8), treatment interruption with high CD4 counts has in principle been shown to be safe (19,31). Here we describe a comprehensive study of 11 patients who initiated HAART with CD4 counts above 350 cells/μL, and subsequently decided to stop treatment. These individuals could be divided into two groups: one with a viral load of <15,000 copies/mL at 24 wk after treatment cessation (n = 6), and a group with a viral load of >50,000 copies/mL at 24 wk after treatment cessation (n = 5). Before HAART was initiated, the viral loads in the two groups were comparable. Here we examined immunological explanations for the observed differences in virologic control between these two groups.
During the 24 wk of follow-up after treatment interruption, the viral load in most individuals did not yet return to pretreatment levels (Table 2), as has been previously described (23). In most individuals, the viral load at 24 wk after treatment discontinuation was still lower compared to pretreatment levels. Although the levels were significantly different at the end of the follow-up period, the kinetics of the changes in viral load after treatment interruption followed a similar trend in the two groups studied (Fig. 1A).
After treatment interruption, the number of activated CD8+ T cells, as well as the number of HIV-1-specific CD8+ T cells, increased in both groups. Emu et al. (9) have recently shown that control of HIV replication is associated with low levels of T-cell activation. In accord with these findings, we found that the increase in activated CD8+ T cells was significantly higher in the individuals with a viral load >50,000 copies/mL at 24 wk after cessation than in individuals who maintained a low viral load. The latter individuals showed a more pronounced increase in the number of HIV-1-specific CD8+ T cells as measured by tetramer staining. Due to the small number of individuals for whom tetramers were available (only two individuals in the high-load group and three individuals in the low-load group had an appropriate HLA type), this difference was not significant.
It has been previously shown that prolonged antiretroviral treatment is able to (at least partially) replenish the supply of IL-2-producing HIV-1-specific CD4+ T cells (11). There was, however, no difference between the two groups studied here in the percentages or the absolute numbers of antigen-specific CD4+ T cells capable of producing IFN-γ and/or IL-2 after stimulation with the overlapping Gag-peptide pool. In agreement with Iyasere et al. (13), and Zimmerli et al. (37), who found that during viremia the reduced in vitro proliferation of HIV-1-specific CD4+ T cells and CD8+ T cells was related to diminished IL-2 production, proliferative capacity was also low in the individuals studied here. Despite differences in viral rebound, no differences in proliferative capacity were observed between the two groups. Recently, Younes et al. (36) showed that the duration of antigen exposure may play a role in the ability of HIV-1-specific memory CD4+ T cells to proliferate upon stimulation with HIV-1-derived peptides. They reported that individuals who started antiretroviral treatment between 3 and 18 mo after HIV-1 infection had a higher proliferative capacity (as measured after 1 y of successful treatment), compared to individuals starting treatment 1 mo before or more than 3 y after HIV-1 infection. In agreement with these results, the two individuals with the highest proliferative responses in our study initiated HAART at 2 and 3 mo after seroconversion.
Degranulation is one of the main pathways by which cytotoxic CD8+ T cells can kill infected target cells (34). The numbers of CD8+ T cells expressing the degranulation marker CD107a after stimulation was higher than the numbers of IFN-γ- and/or IL-2-producing CD8+ T cells in the same individuals, indicating that degranulation may be a more sensitive marker to study HIV-1-specific CD8+ T-cell activity than cytokine production. In agreement with this theory, Betts et al. (4) showed that CD107 expression can be measured at 10- to 100-fold lower peptide concentrations than those required for detectable cytokine production. Four weeks after treatment was discontinued, a negative correlation between degranulation and viremia could be observed (R = −0.581, p = 0.018 by Spearman's rho; Fig. 5). These results suggest that there is a relationship between HIV-1 plasma RNA load and CD8+ T-cell function, as measured by CD107a expression, after treatment discontinuation. We hypothesize that in individuals capable of maintaining low viral loads after treatment interruption, there is a modest increase in HIV antigen levels, which results in a boost of HIV-1-specific CD8+ T cells, leading to increased function. In individuals with high viral loads after treatment interruption, however, the large increase in antigen results in overactivation and thereby impairment of HIV-1-specific CD8+ T cells, leading to a less pronounced increase in their function.
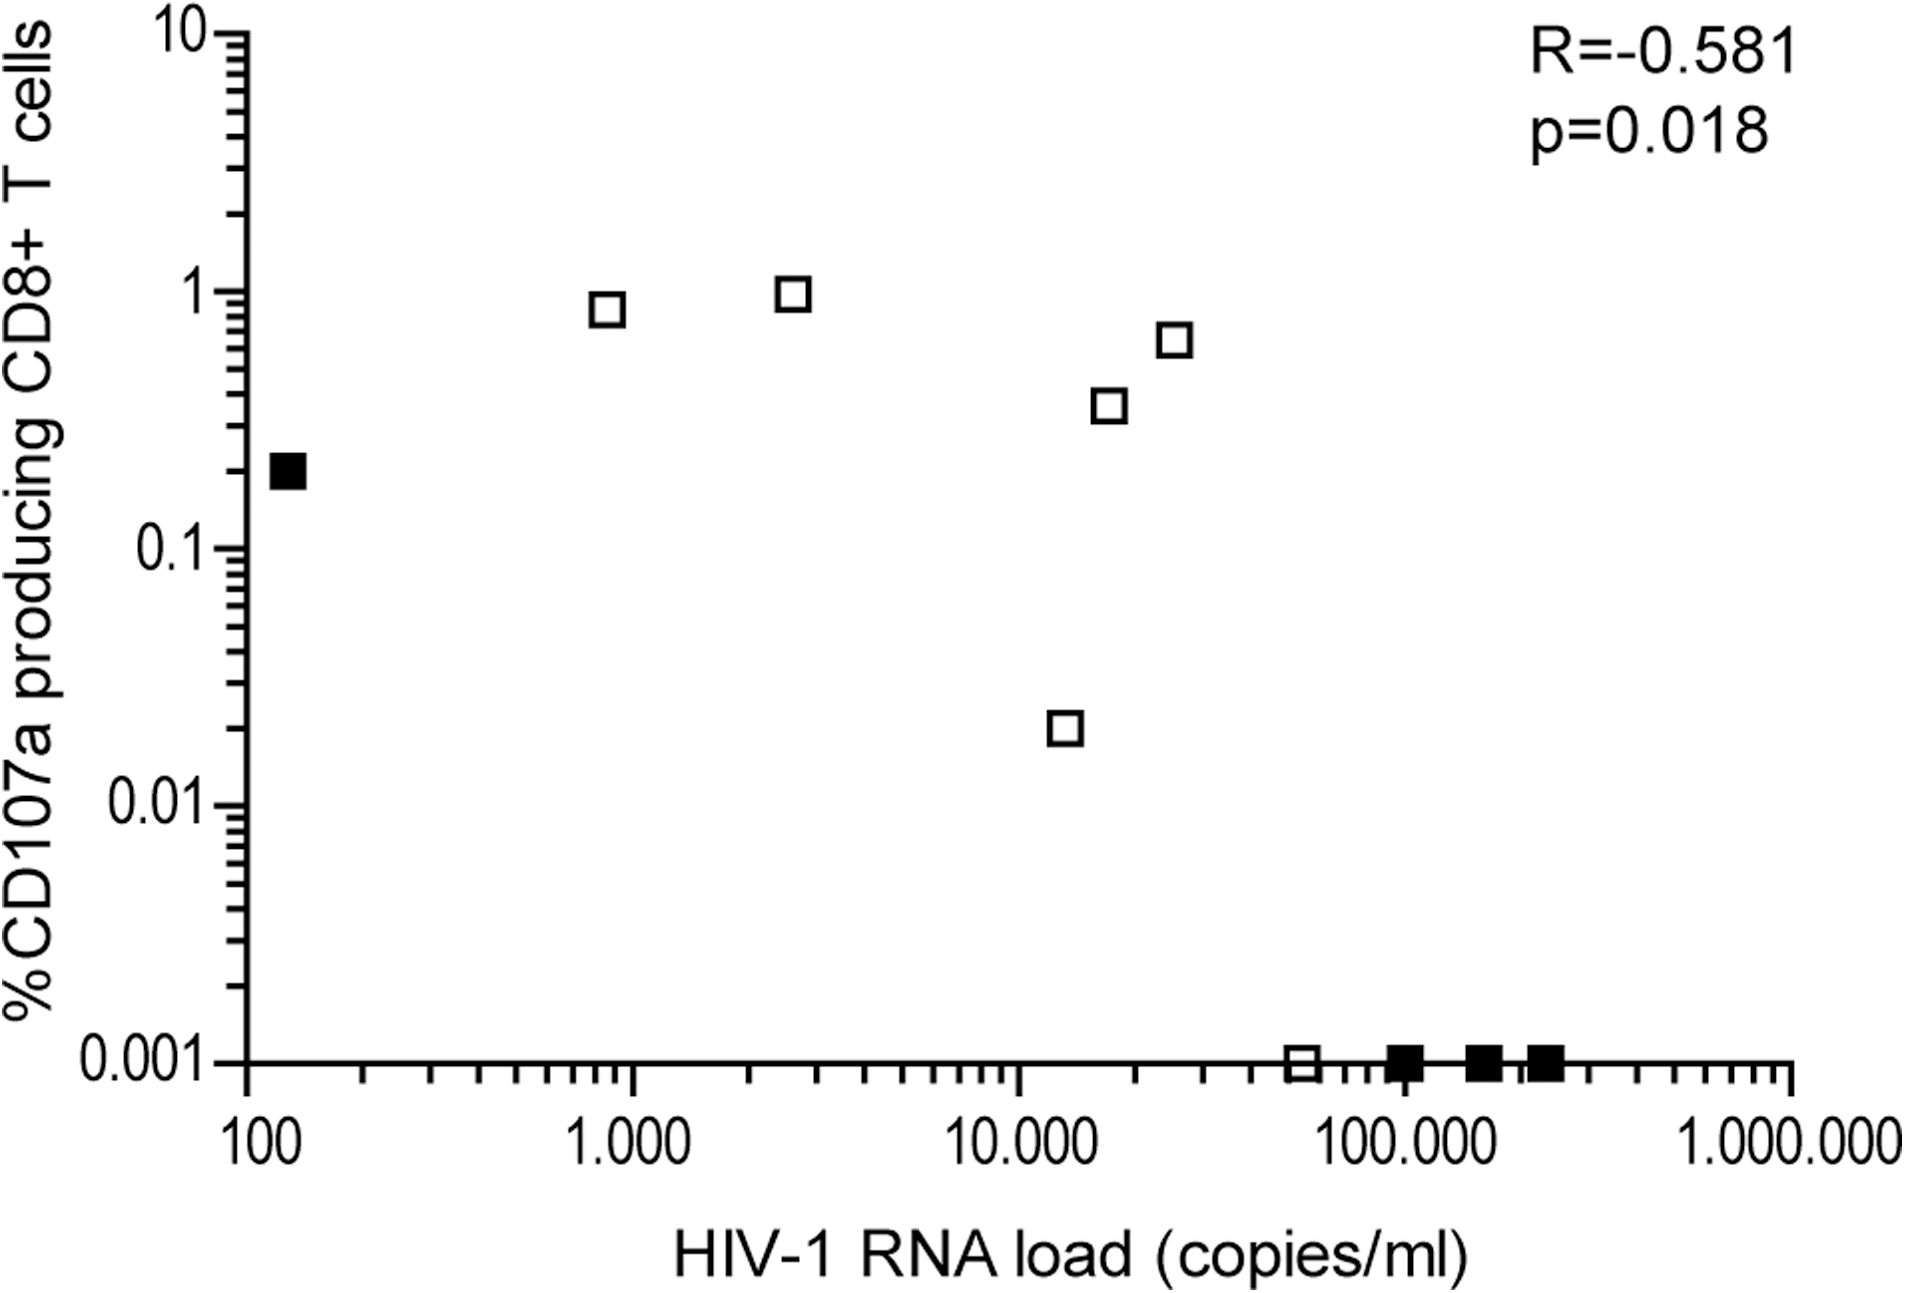
Correlation between degranulation and viremia after treatment interruption. Four weeks after treatment interruption, a negative correlation was seen between degranulation (as measured by CD107a expression) and HIV-1 viral load. Individuals capable of maintaining low viral load are represented by open squares, and individuals who showed a high viral load at 24 wk after cessation of therapy are represented by black squares.
Although treatment interruption in individuals who started HAART with CD4 counts above 350 cells/μL appears to be safe (19,31), there is no evidence that the increase in HIV-1-specific T-cell function seen after treatment interruption is more pronounced compared to individuals who started treatment during acute infection (14 –16), or those with CD4 counts <200 cells/μL (20,27). In these previous studies, the capacity of HIV-1-specific CD8+ T cells to degranulate after treatment interruption was not determined. As degranulation appears to be a more sensitive marker for the study of HIV-1-specific CD8+ T-cell functionality, it remains to be determined if the potential increase in CD107a expression seen after treatment interruption in individuals treated during acute infection, or those with low CD4 counts, is comparable to the increase seen in the individuals described here.
In conclusion, our data show that individuals capable of maintaining a low viral load after treatment discontinuation have increased CD8+ T-cell function at 4 wk after treatment cessation, compared to those who experienced a rapid increase in viral load. However, whether this increased function is a cause or a consequence of the low viral load in this group remains to be elucidated.
Footnotes
Acknowledgements
This work was financially supported by a grant from the Landsteiner Foundation for Blood Transfusion Research (LSBR grant no. 0317). The Gag-derived overlapping peptide pool (15-mers with 11 overlap, Consensus B) was obtained through the NIH AIDS Research and Reference Reagent Program, a division of the National Institute of Allergy and Infectious Diseases.
Author Disclosure Statement
No competing financial interests exist.