
Abstract
To clarify whether the suppressors of cytokine signaling (SOCS) are associated with denguevirus (DENV) evasion of the antiviral response, we analyzed the expression kinetics of SOCS1 and SOCS3 and of the antiviral genes MxA and OAS during DENV infection of U937 macrophages that were or not treated with interferon (IFN)-α. DENV infection produced a viral titer three times higher in untreated than in IFN-α-treated cells (p < 0.001 at 72 h postinfection [p.i.]). Partial inhibition of DENV replication was associated with reduced expression of MxA and OAS antiviral genes as well as higher SOCS1 and SOCS3 expression in DENV-infected cells than in cells treated only with IFN-α. Complete loss of phosphorylated-signal transducer and activator of transcription (p-STAT)2 and reduced nuclear importation of p-STAT1 were observed in DENV-infected cells compared to IFN-α treatment that induced p-STAT1 and p-STAT2. Our data thus suggest that overexpression of SOCS1 and SOCS3 induced by DENV infection leads to impairment of antiviral response through the inhibition of STAT functionality.
Introduction
D
Denguevirus (DENV) is an enveloped, single-stranded positive-sense RNA virus that belongs to the Flaviviridae family, genus Flavivirus, and is transmitted by mosquitoes of the Aedes egypti and Aedes albopictus species. Based on neutralization assay data, four serotypes (DENV-1, DENV-2, DENV-3, and DENV-4) can be distinguished. The RNA genome encodes a long precursor polyprotein containing three structural proteins (capsid [C], precursor membrane [prM], and envelope [E]) and seven nonstructural (NS) proteins (NS1, NS2A, NS2B, NS3, NS4A, NS4B, and NS5) (5).
DENV causes the self-limited febrile illness dengue fever (DF), as well as the potentially lethal severe dengue disease (previously known as dengue hemorrhagic fever and dengue shock syndrome, DHF/DSS). Dengue is clinically characterized by the following: mild to high degree fever, retroorbital pain, headache, myalgia, arthralgia, rash, nausea, vomiting, abdominal pain, mucosal bleeding, and thrombocytopenia. In severe dengue organ dysfunction, vascular permeability, plasma leakage, severe hemorrhage, and shock can occur. The mechanism underlying endothelial cell dysfunction and plasma leakage is of primary importance; however, it is far from being completely understood (5).
Dengue pathogenesis can be partially explained through various hypotheses that implicate immune-related factors, including (i) antibody-dependent enhancement (ADE) of viral infection by non-neutralizing antibodies, (ii) activation of cross-reactive autoantibodies and T cells, and (iii) deregulation of cytokine and complement cascades (16, 27).
DENV can productively infect a wide range of human immune cells, including monocytes, macrophages, B cells, and dendritic cells among others. Cytokines secreted by DENV-infected cells seem to play a critical role in the pathogenesis of dengue. A number of studies propose that interferon (IFN)-α and interleukin 8 (IL-8) are elevated during the early febrile phase of dengue, whereas tumor necrosis factor-alpha (TNF-α), IL-10, and IFN-γ increase during the defervescence phase of infection. Disease severity can also be correlated with circulating levels of IL-1β, IL-6, macrophage inflammatory protein 1 (MIP-1), macrophage inhibitory factor (MIF), and complement components (C3a, C5a, factor D, and factor H) (3, 8, 9, 11, 16, 24 –26, 33, 44). All these data suggest that the control of cytokine signaling is disrupted because of DENV infection.
Innate response to virus infection is primarily mediated by IFN synthesis and signaling through specific receptors that activate the Janus kinase–signal transducer and activator of transcription (JAK–STAT) signaling pathway (7).
Type I IFN (α/β) and Type III IFN (λ) induce phosphorylation of STAT1 and STAT2 (p-STAT1 and p-STAT2), which heterodimerize and associate with IFN regulatory factor-9 (IRF9) to form IFN-stimulated gene factor-3 (ISGF3) (17, 38). Then, ISGF3 translocates into the nucleus and binds to IFN-stimulated response elements in the promoter region of numerous target genes, including those for the antiviral proteins 2′,5′-oligoadenylate synthetase (OAS) and myxovirus resistance A (MxA) that block virus replication and assembly, respectively.
Type II IFN (γ) signaling induces p-STAT1, which homodimerizes and binds to DNA at γ-activated sequences that initiate transcription of several cytokines (32, 38).
Some studies have demonstrated that the DENV evades the antiviral response by interfering with the JAK–STAT pathway. For instance, DENV NS4B inhibits STAT1 phosphorylation (31) and NS5 targets STAT2 for proteasomal degradation (4, 20).
Tight regulation of the IFN system is necessary to ensure that appropriate response is initiated after viral infection. Uncontrolled or aberrant production of type I IFN results in toxicity, prolonged inflammation, tissue damage, and increased morbidity. Therefore, negative regulatory factors are necessary to control cytokine cascades and maintain homeostasis. The suppressors of cytokine signaling (SOCS) downregulate the JAK–STAT pathway by acting either on JAK's catalytic domain or by blocking tyrosine residues at both cytokine receptors and STAT molecules (2, 21, 50). Of the eight family members, SOCS1 and SOCS3 are the most potent inhibitors of cytokine signaling mediated by the JAK–STAT pathway (10, 13, 18).
Several viruses, including herpes simplex virus, respiratory syncytial virus, influenza A virus, hepatitis C virus, and hepatitis B virus, destabilize the host antiviral defense through inhibition of JAK–STAT signaling by upregulating SOCS1 and/or SOCS3 proteins (1, 34, 36, 37, 49).
There are a few studies that evaluate the association of SOCS proteins with deregulation of cytokines in dengue-infected cell cultures and patients (12, 35, 40, 46, 47). The aim of our study was to analyze the kinetics of SOCS1 and SOCS3 expression in human macrophages, to identify their association with downregulation of the antiviral response during DENV infection.
Materials and Methods
DENV replication
DENV type 2 (16681 strain) was kindly donated by Dr. Aguilar Setien at National Medical Center, IMSS, Mexico City. DENV was replicated in A. albopictus C6/36 cell line. Cells were cultured in Eagle's minimum essential medium (MEM; Sigma Aldrich) supplemented with 2 mM glutamine, 100 IU/mL penicillin, 100 mg/mL streptomycin, 10 nM NaHCO3, and 10% fetal bovine serum (FBS), and were incubated at 28°C. Supernatants of DENV-infected C6/36 cells were harvested at 72 h postinfection (p.i.) and stored at −70°C until use. Viral RNA was detected by reverse transcription-polymerase chain reaction (RT-PCR) using reported primers (23). Virus titers were determined by a standard plaque assay using baby hamster kidney clone 21 (BHK-21) cells, which were cultured in supplemented Eagle's MEM at 37°C and 5% CO2.
Macrophage differentiation
The human monocyte U937 cell line was maintained in suspension in RPMI-1640 medium supplemented with 10% FBS, 1%
Experimental design
For all the experiments, U937 cells were seeded in six-well microassay plates, differentiated to macrophages with PMA, and reposed as mentioned previously. Cells were either not treated (plates 1 and 2) or treated with 1,000 IU IFN-α (plates 3 and 4) for 6 h; then cells were washed, plates 2 and 3 were infected with a multiplicity of infection of 1 of DENV, whereas plates 1 and 4 were not infected; all plates were incubated for 1 h, washed, fresh medium was added, and incubated at 37°C. After that, all the cells were processed equally: cell extracts were harvested for RT-PCR, whole cell lysates were recovered for western blot (WB) assay, and live cells were analyzed for immunofluorescence, for several times from 0.5 to 72 h as mentioned hereunder.
Quantitative real-time RT-PCR
Total RNA was extracted from macrophages U937 using TRIzol reagent according to the manufacturer's instructions (Invitrogen); then it was treated with DNAse I (Thermo Scientific Fermentas) and quantified at 260/280 nm. RNA was reverse transcribed using the random primers included in the RevertAid H Minus Reverse Transcriptase kit (Thermo Scientific Fermentas), the reaction mixture was incubated at 25°C for 10 min, 42°C for 60 min, and 70°C for 10 min. Real-time RT-PCR was performed using SYBR Green/ROX-PCR master mix (Thermo Scientific Fermentas). In all experiments, an endogenous control was used: RNase P in assays with SOCS genes and HPRT or β-actin for all other genes (41). The primers used in this study are shown in Table 1.
RT-PCR, reverse transcription-polymerase chain reaction.
All reactions were run in duplicate by using a StepOne real-time PCR system (Applied Biosystems). The mRNA expression level was expressed as the n-fold increase according to the formula to calculate relative expression 2−ΔΔCT ± SD, where ΔCT is the difference in the threshold between any target gene (SOCS1, SOCS3, MxA, and OAS) and the endogenous gene (RNase P, HPRT, or β-actin); ΔΔCT establishes the differences between study and control conditions (42).
Protein detection by WB
Cells were lysed and total proteins were obtained using mammalian cell lysis reagent (Thermo Scientific Fermentas) containing protease inhibitor cocktails (P8340; Sigma Aldrich). Protein concentrations were determined by the Bradford method. Equal amounts of proteins (30 μg) were resolved on SDS-PAGE in 12% acrylamide gels and transferred to polyvinylidene difluoride membranes (Bio-Rad) at 100 mA for 1 h.
Membranes were blocked in Tris buffer solution, 0.2% Tween 20 (TBST), and 5% nonfat dried milk at room temperature (r.t.) for 1 h, followed by incubation at 4°C overnight with 1 μg/mL of primary antibodies against STAT1 (PAF-ST1), p-STAT1 (AF-2894), STAT2 (MAB1666), and p-STAT2 (AF2890), all these from R&D Systems (Boston Biochem); SOCS1 (ab3691), SOCS3 (ab3693), and β-actin (ab82361); all these from ABCAM, followed by incubation with horseradish peroxidase (HRP)-conjugated antirabbit (ab97051), antimouse (ab97023), or antigoat IgG antibodies (ab6741) (ABCAM), for 2 h at r.t. Membranes were incubated with Immobilon Western Chemilum HRP Substrate (Merck Millipore).
Digital signals were acquired using the C-Digit chemiluminescence scanner and densitometry analyses were conducted using Image Studio Digits software version 3.1 (LI-COR). Relative optical density (OD) was calculated by comparing the luminescence signal of each protein against β-actin endogenous protein control.
Immunofluorescence microscopy
U937 monocytes (5 × 10⁵ cells/mL) were seeded in 24-well plates and differentiated to macrophages by treatment with PMA as previously mentioned. Cells were treated or infected as described under experimental conditions. Cells were fixed with 4% paraformaldehyde–PBS, washed and treated with 0.1% Triton X-100-PBS for 2 min, and washed and blocked with 2% FBS–2% (w/v) gelatin in PBS for 30 min. Cells were incubated with 2 μg/mL rabbit p-STAT1 specific antibody (AF-2894) from R&D Systems (Boston Biochem) at 37°C for 2 h; after washing, cells were incubated with a 1 μg/mL goat antirabbit-FITC antibody (F0382; Sigma Aldrich). Cells were counterstained with DAPI and observed under a fluorescent microscope Axiovert (Carl Zeiss). Images were analyzed with Axiovision SE64 (version 4.8.3) software (Carl Zeiss).
Statistical analysis
Results are reported as means ± SD and were analyzed using the two-way ANOVA and Bonferroni test to determine the statistical significance between experimental and control cells. p < 0.05 values were considered statistically significant.
Results
Four experimental conditions were tested simultaneously: DENV infection without IFN, IFN treatment before DENV infection (IFN+DENV), IFN-treated noninfected cells, and control cells. For comparative purposes, their results are reported with respect to the time of infection. Indeed, for all the time lines 0 corresponded with the beginning of infection, this is applicable to every experimental condition, either infected or not.
Effect of IFN-α priming on viral replication
DENV produced a viral titer of 81 ± 7 × 10³ plaque forming units (PFU)/mL in cells without IFN but reduced its titer to 27 ± 2 × 10³ PFU/mL in IFN-α-treated cells (p < 0.0001), at 72 h p.i. (Fig. 1).
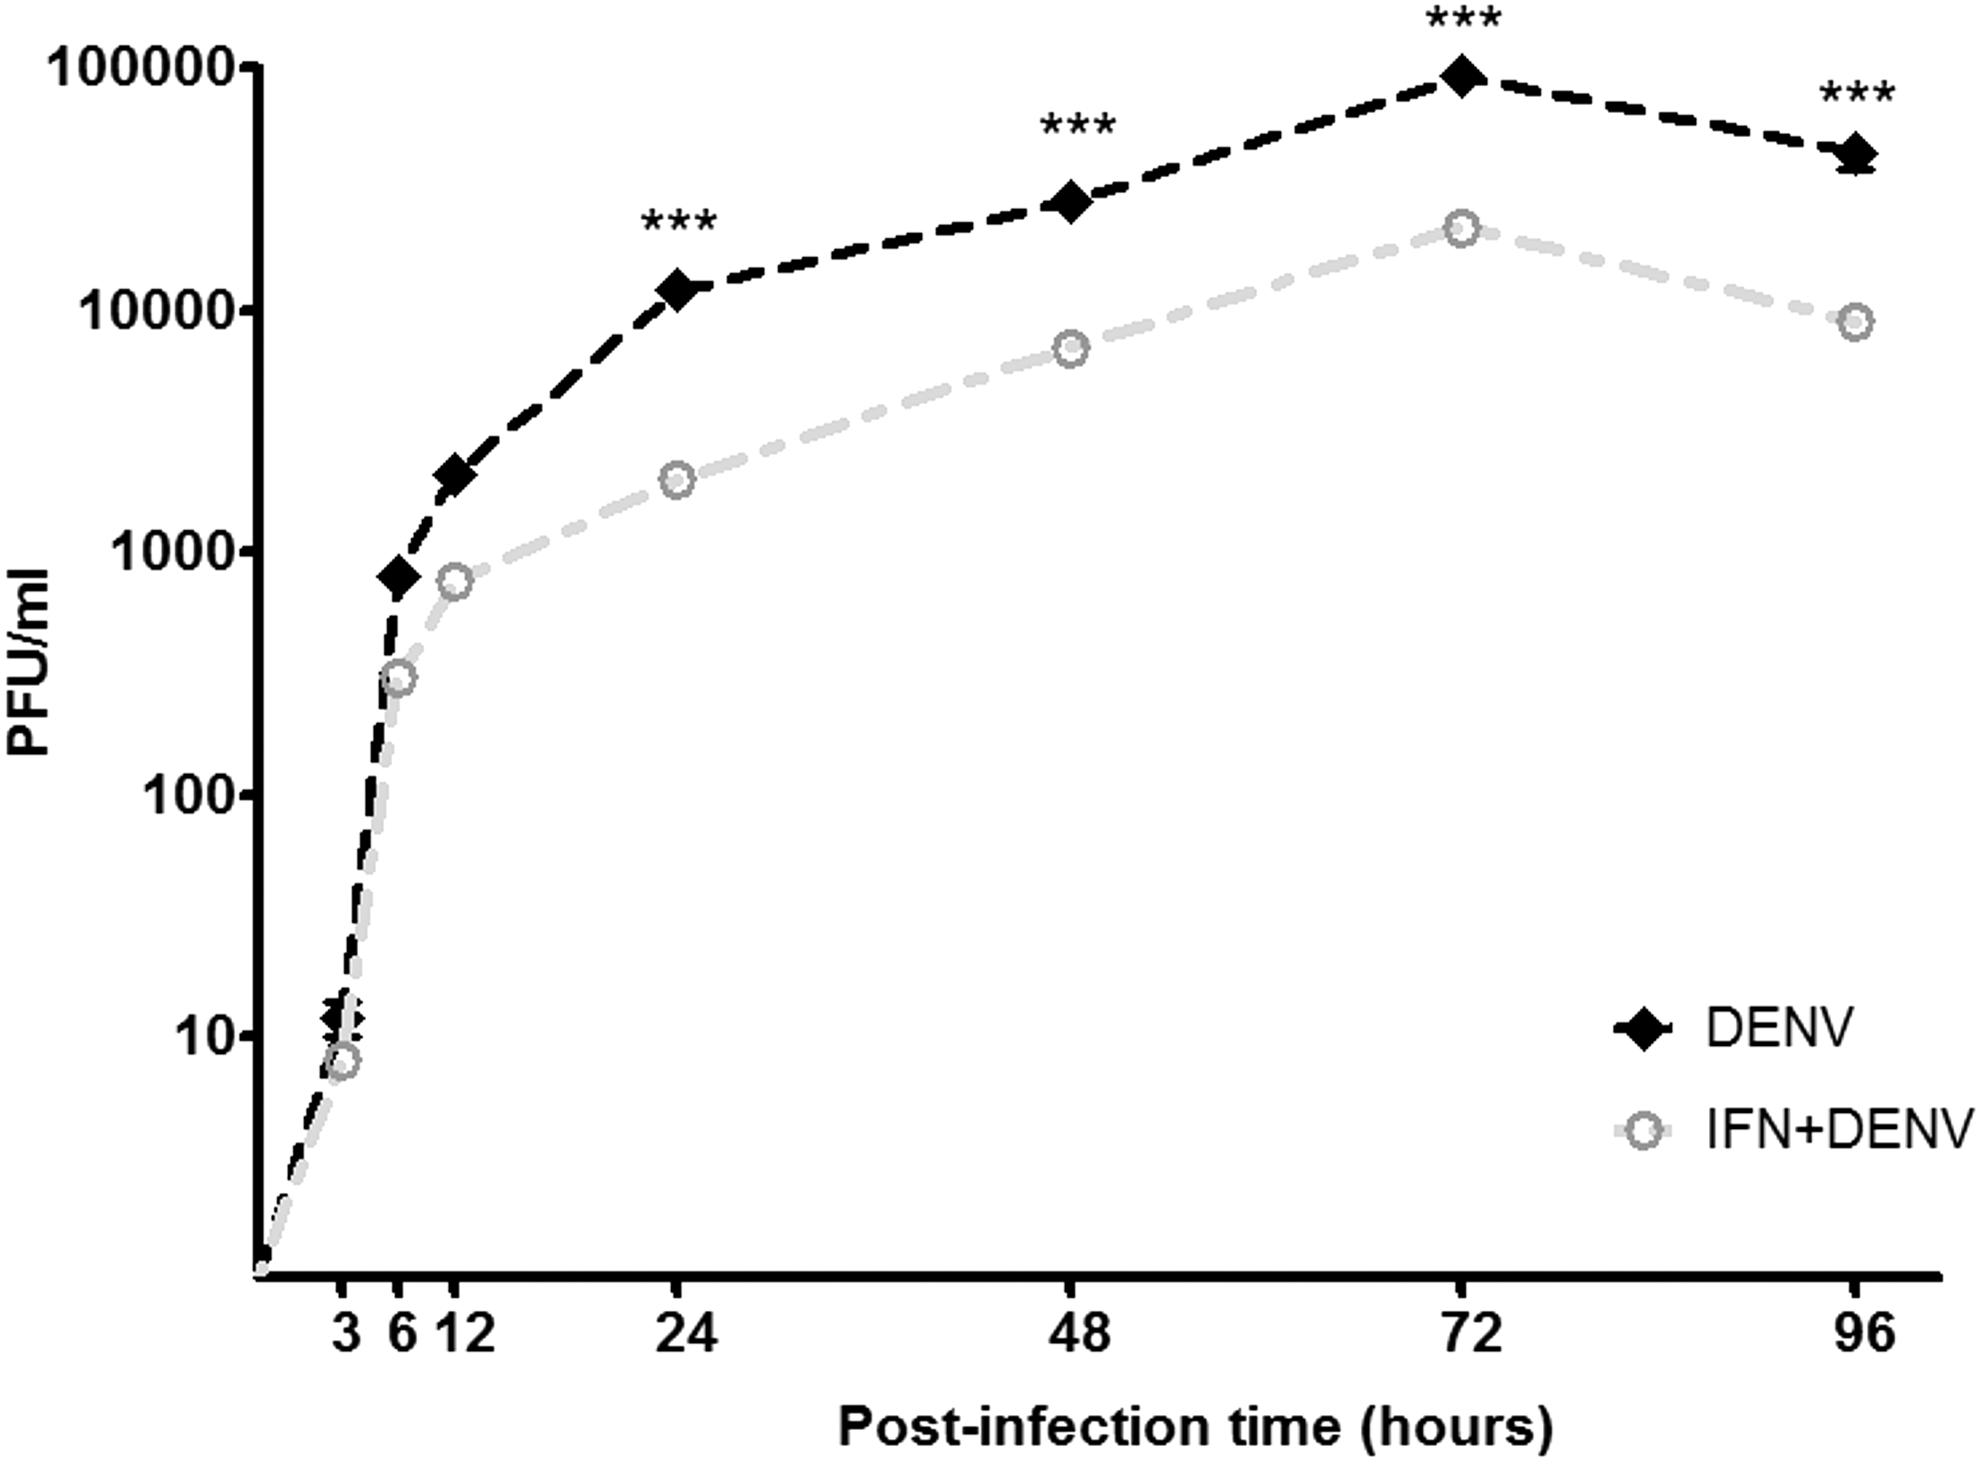
Denguevirus (DENV) evades interferon (IFN)-α action. Macrophages U937 were untreated (black line) or treated (gray line) with IFN-α for 6 h before infection with DENV. Cell supernatants were obtained at different times between 1 and 96 h p.i. and viral titers (PFU/mL) were determined in BHK-21 cells at 72 h p.i. Data are means ± SD of three independent experiments. ***Statistical difference determined by two-way ANOVA p < 0.001. PFU, plaque forming units; p.i., postinfection; SD, standard deviation.
Kinetics of SOCS1 gene expression
The kinetics of SOCS1 and SOCS3 gene expression was analyzed by means of real-time RT-PCR. The baseline expression in the control cells was set as 1, and the changes in expression induced by any experimental condition were calculated as fold increase in comparison to the control cells. DENV infection in cells without IFN induced high transcription of SOCS1, with an initial increment around 436.7-fold at 3 h and the maximal peak of 1,282 ± 117-fold at 6 h (p < 0.001); this transcriptional response decayed after 48 h (Fig. 2A). This represents 3.6 times the expression level found in IFN+DENV cells, which induced smaller SOCS1 transcription with the maximal level of 356 ± 14-fold at 6 h, and totally decayed at 48 h.
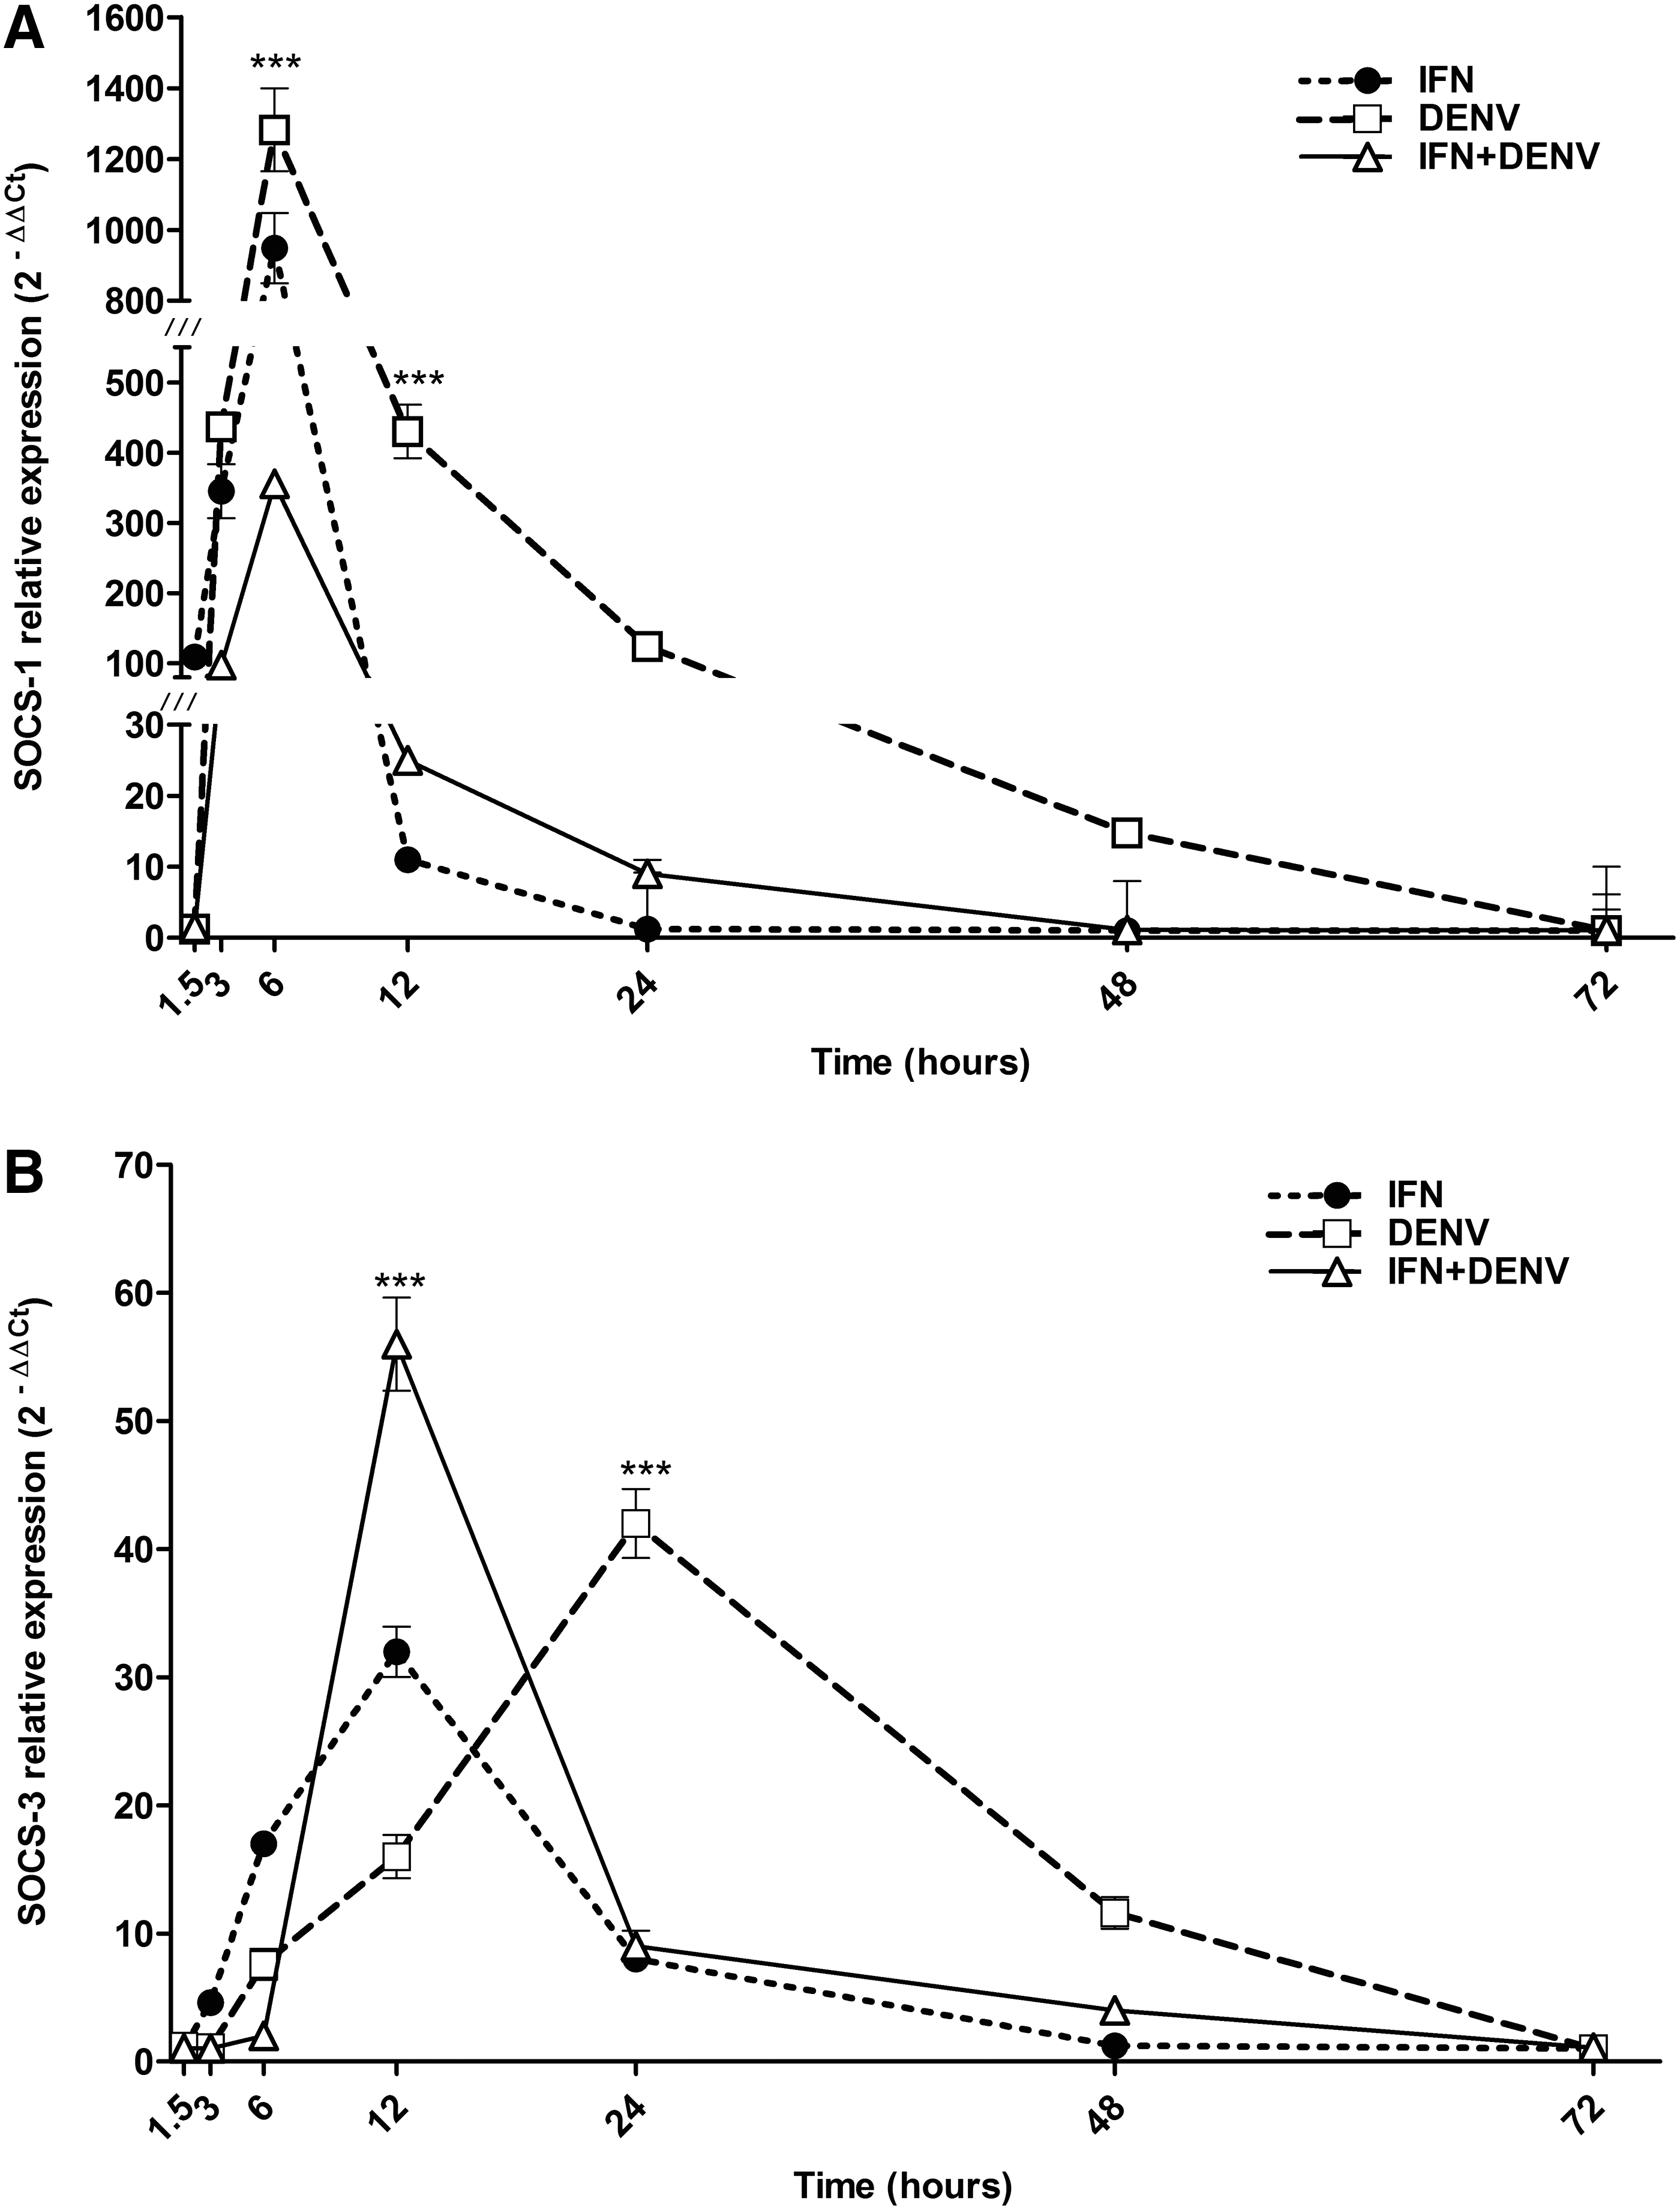
Kinetics of SOCS gene expression. U937 macrophages were treated with or without IFN-α for 6 h; after that they were infected or not with DENV; then SOCS1 (
Meanwhile, IFN treatment in uninfected cells induced transient transcriptional response of SOCS1 with 948 ± 99-fold at 6 h; this was 2.6-fold higher than the level of SOCS1 induced by IFN+DENV cells (p < 0.001) (Fig. 2A); but was 1.3-fold lower than the level of SOCS1 induced by DENV infection alone.
Kinetics of SOCS3 gene expression
Transcription of SOCS3 gene was ∼30 times lower than SOCS1 expression. DENV infection in cells without IFN induced prolonged SOCS3 transcription starting at 6 h and finishing at >48 h, with the maximal peak of 42 ± 2.7-fold at 24 h (p < 0.001) (Fig. 2B). In contrast, DENV infection in IFN-α-treated cells induced higher transcription of SOCS3, with the maximal peak of 56 ± 3.64-fold at 12 h, but dropped to 9 ± 1.2-fold at 24 h. IFN-α treatment in uninfected cells induced lower transcriptional response (32 ± 1.96 at 12 h) than in DENV+IFN cells at corresponding times.
WB assays confirmed stable expression of SOCS1 and SOCS3 proteins induced by DENV infection either treated with or without IFN. SOCS1 protein shows maximal expression at 6–24 h in DENV, at 12 h in IFN+DENV, and at 3–24 h in IFN-treated cells. SOCS3 protein was evident from 6 to 48 h in DENV, from 12 to 48 h in INF+DENV, and from 3 to 48 h in IFN-treated cells (Fig. 3). SOCS1 and SOCS3 protein expression was coincident with RNA levels at most of the times analyzed; however, some discrepancies were also observed.
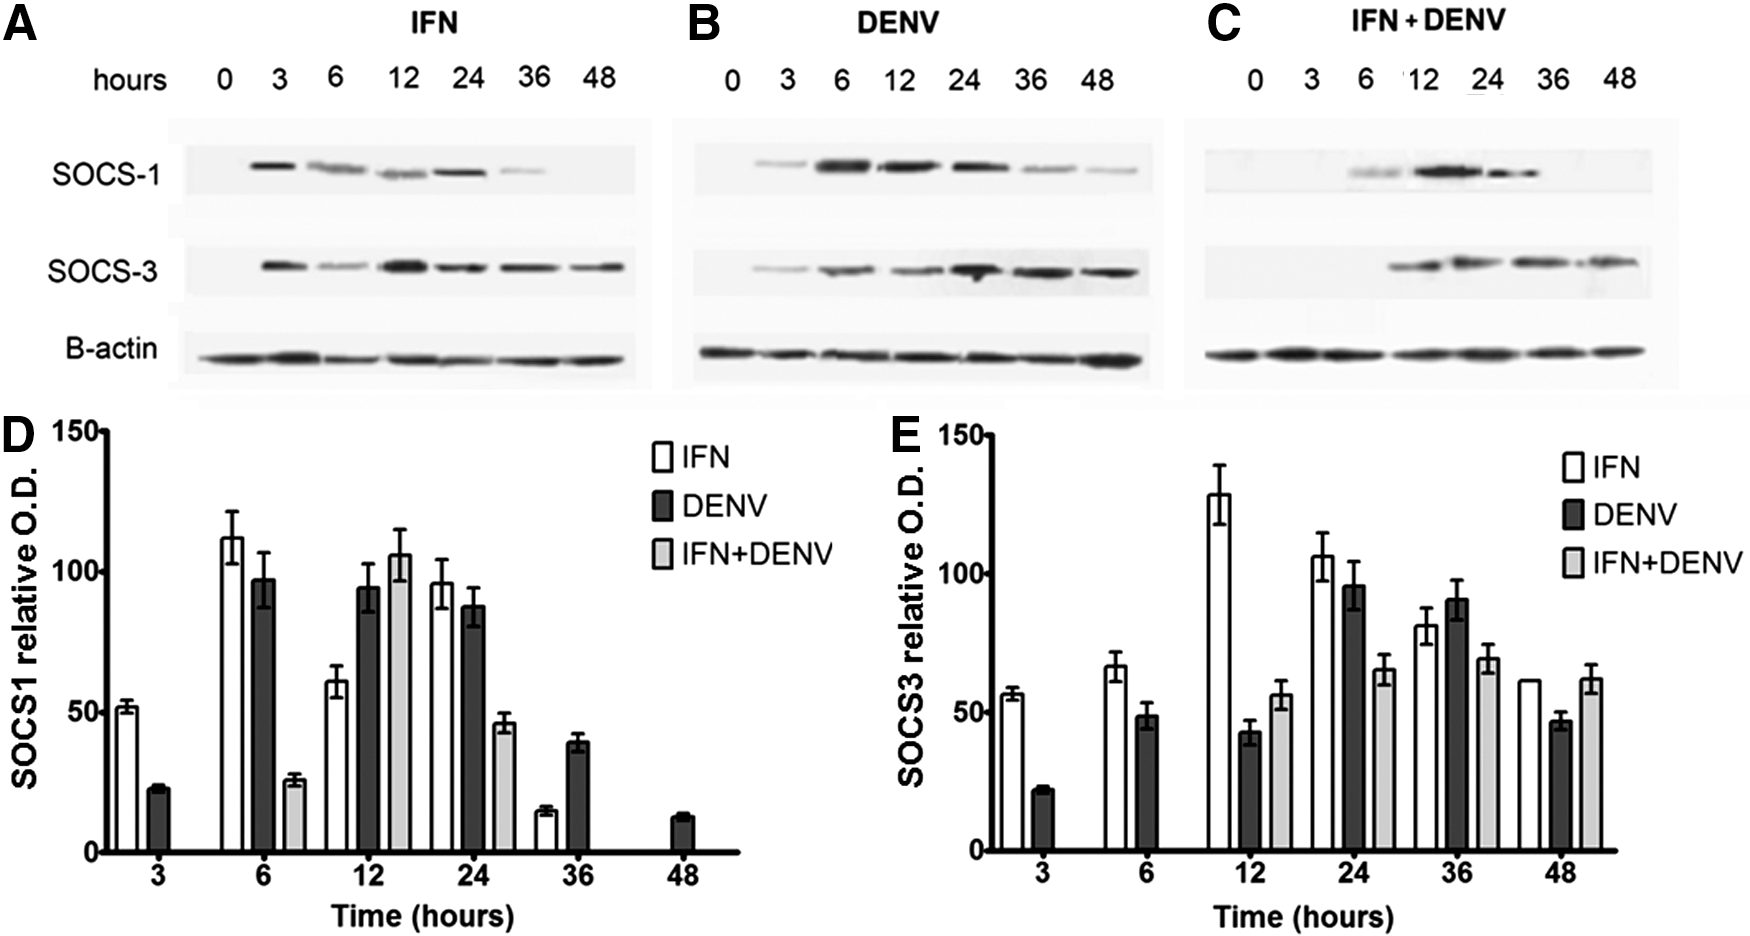
DENV increases the expression of SOCS proteins. U937 macrophages were treated with or without IFN-α for 6 h; after that they were infected or not with DENV; then SOCS1 and SOCS3 proteins were identified by western blot (WB) assays at 3, 6, 12, 24, 36, and 48 h using total cell extracts
Kinetics of MxA gene expression
MxA expression and OAS expression were analyzed by real-time RT-PCR because these antiviral genes are induced through the JAK–STAT pathway, under the negative control of SOCS1 and SOCS3 (54). DENV infection in IFN-untreated cells induced MxA expression from 6 to 48 h, with the maximal peak of 45.6 ± 2.2-fold at 24 h (Fig. 4A). DENV infection in IFN-α-treated cells induced a fast transcriptional response of MxA with the maximal peak of 66.9 ± 2.6-fold at 6 h, but decaying to less than 20-fold at 12 h (p < 0.0001), and remained at the same level for >48 h. In contrast, the response to IFN-α treatment in uninfected cells showed a higher and longer pattern of MxA expression with respect to DENV-infected cells with or without IFN treatment with the maximal expression peak of 89 ± 4.1-fold at 24 h, and remaining at evident levels after 48 h.

DENV infection reduces MxA and OAS expression. U937 macrophages were treated with or without IFN-α for 6 h; after that they were infected or not with DENV; then MxA (
Kinetics of OAS gene expression
DENV infection in cells without IFN induced a unique peak of OAS expression of 47.8 ± 2.7-fold at 12 h that drops almost to baseline levels at 24 h (Fig. 4B). Meanwhile DENV infection in IFN-α primed cells induced a very small transcriptional response of OAS with 17.1 ± 1.2-fold at 6 h. In comparison, IFN-α treatment in uninfected cells induced higher OAS expression from 3 to 48 h, with two peaks of 53.3 ± 3.8 and 89.2 ± 3.8-fold at 6 and 24 h, respectively.
Detection of STAT proteins
STAT proteins and their phosphorylated forms were analyzed by WB and densitometry. Control cells expressed low amounts of STAT1 and null of STAT2, p-STAT1, or p-STAT2. STAT1 increased 15-fold in response to DENV, 8-fold in response to IFN+DENV, and 3.3-fold in response to IFN treatment compared to controls at 0.5 h (Fig. 5D). p-STAT1 increased 40-fold in response to DENV at 0.5 h, 54- to 58-fold in response to IFN+DENV, and 77- to 113-fold in response to IFN alone at 0.5–1.5 h. In addition, p-STAT1 increased 47- to 126-fold at 12–24 h in response to DENV and 115- to 91-fold at 18–24 h in response to IFN+DENV (Fig. 5E). STAT2 increased 31- to 82-fold at 1.5–6 h in DENV-infected cells, 21- to 114-fold at 0.5–12 h in IFN+DENV, and just 24-fold in IFN-treated cells (Fig. 5F). p-STAT2 was null in DENV-infected cells throughout the experiment, but increased to 92- and 97-fold at 1.5 and 18 h in IFN+DENV-infected cells and 30-, 80-, and 77-fold in IFN-treated cells at 0.5, 3, and 12 h (Fig. 5G).
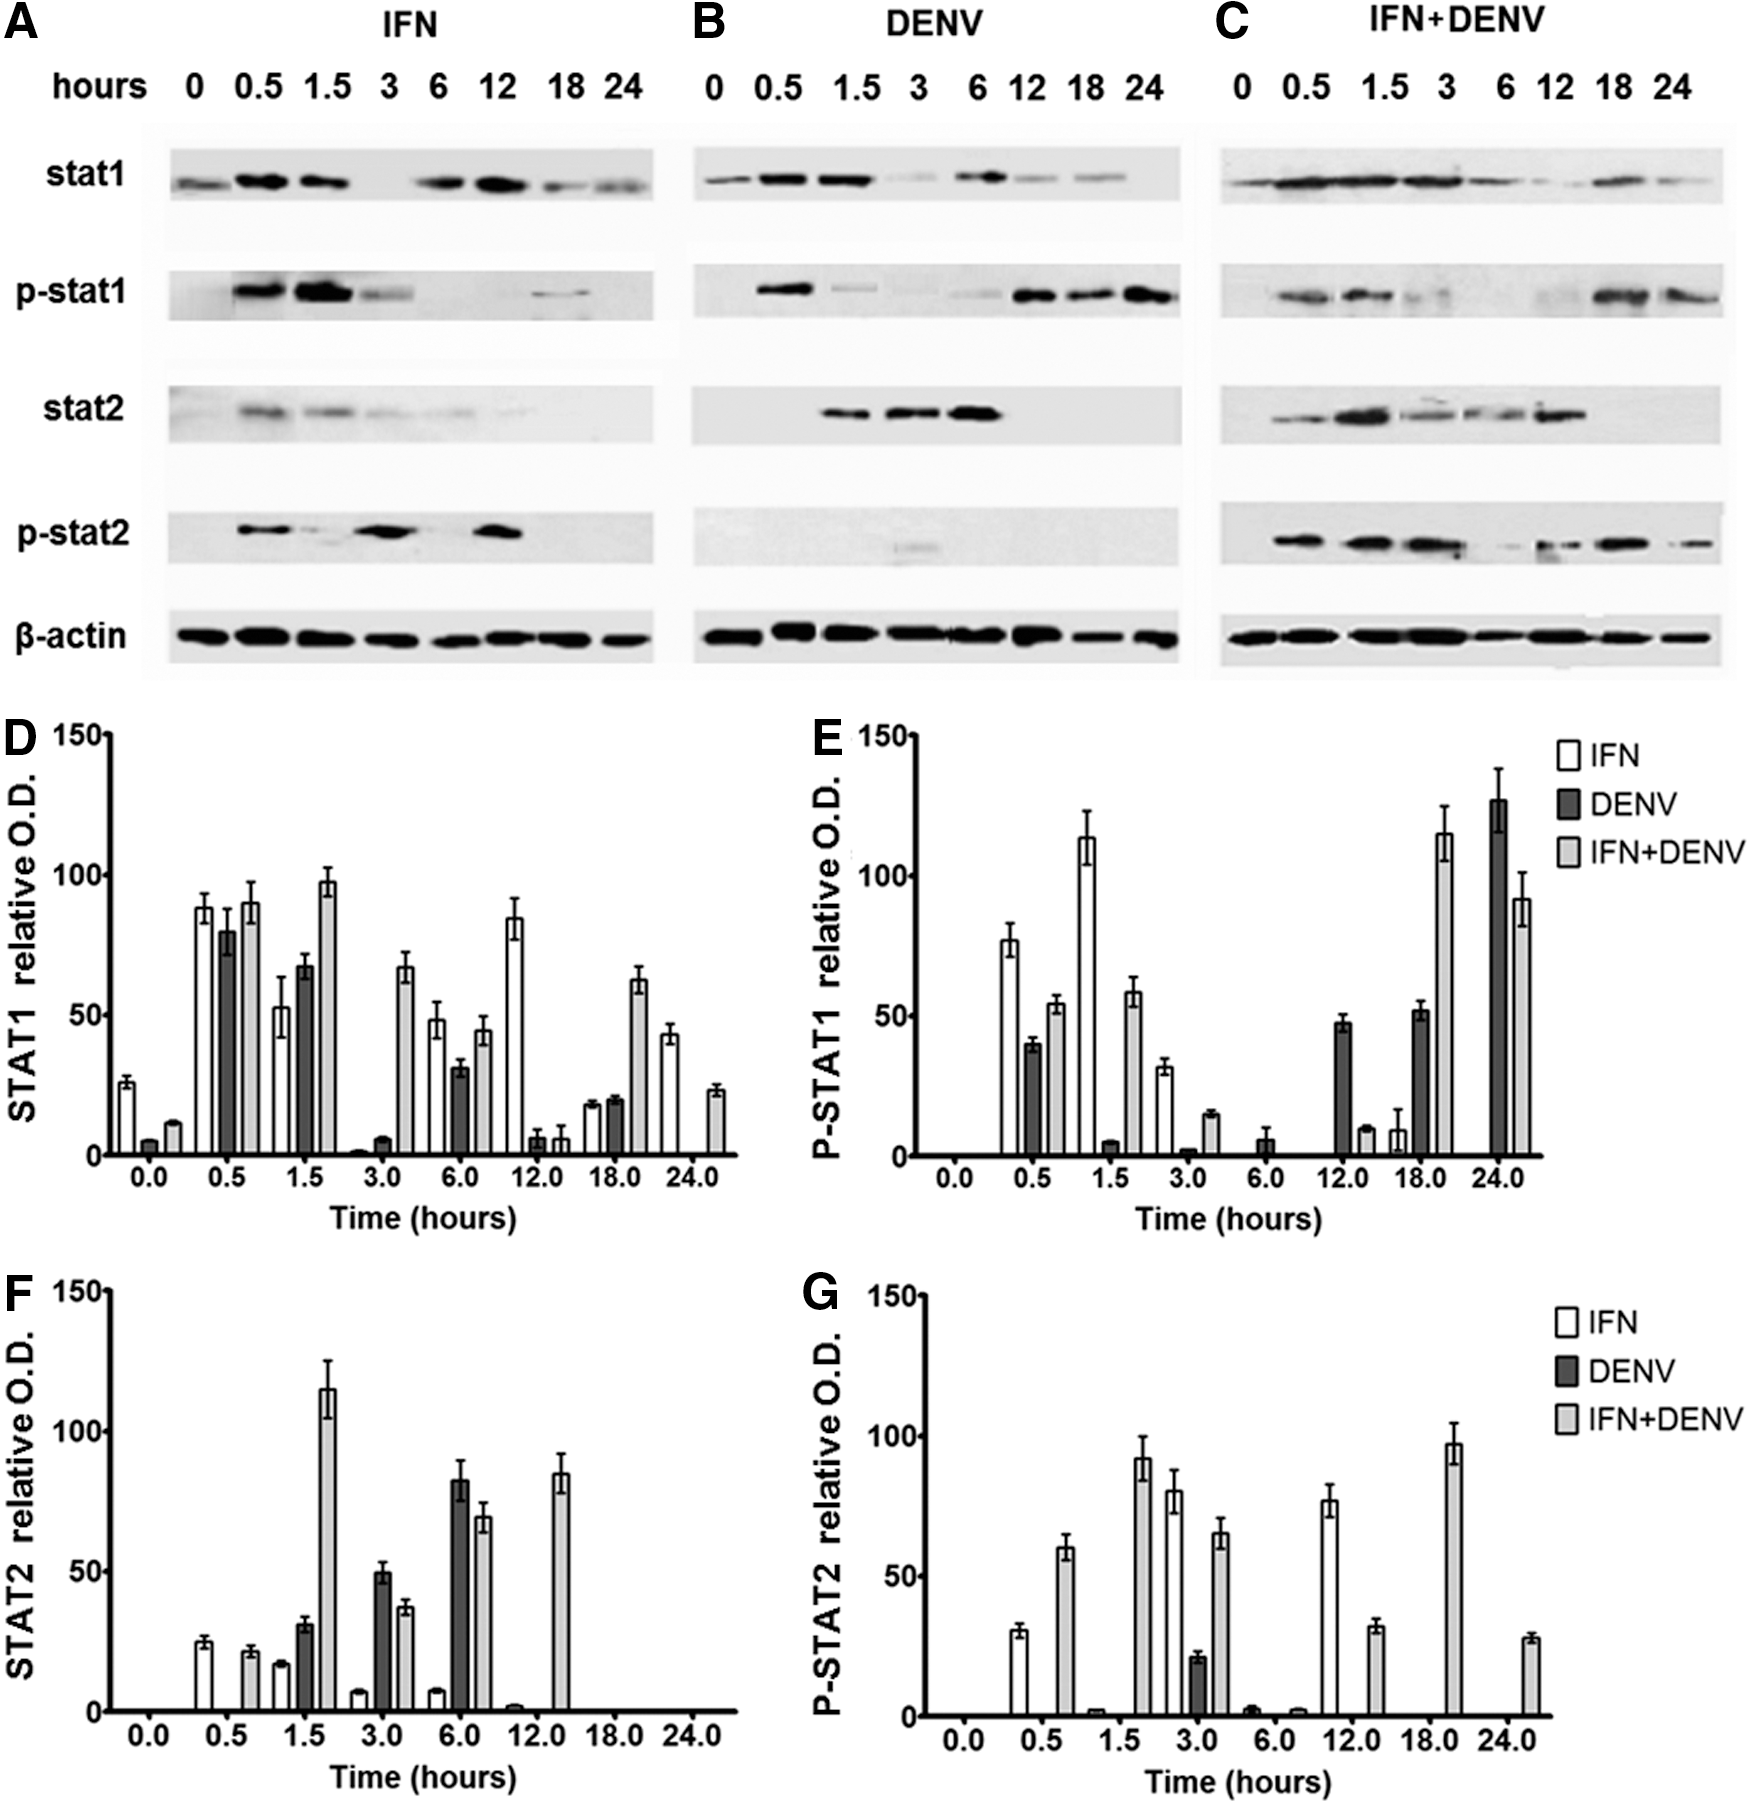
DENV infection changes the expression of STAT proteins. U937 macrophages were treated with or without IFN-α for 6 h; after that they were infected or not with DENV; then total cell lysates were separated by SDS-PAGE, and the presence of STAT1, STAT2 proteins, and their phosphorylated forms p-STAT1 and p-STAT2 was detected by WB at 0, 0.5, 1.5, 3, 6, 12, 18, and 24 h p.i
Cellular distribution of p-STAT proteins
The persistence of p-STAT1 in DENV-infected cells identified by WB was contradictory with previous reports (31). Therefore, we evaluated the presence and cellular distribution of p-STAT1 by means of immunofluorescence. Phosphorylated STAT1 was found in IFN-untreated and DENV-infected cells, showing cytoplasmic and perinuclear distribution at 3 h, but p-STAT1 was retained in the cytoplasm at 12 and 24 h (Fig. 6B, 12 h–c, d).

DENV infection affects cellular distribution of p-STAT1 proteins. Cell distribution of p-STAT1 was identified by immunofluorescence in U937 macrophages treated with IFN-α
By accounting the proportion of nuclear fluorescent cells per well, it was determined that p-STAT1 was absent in >80% of the nuclei of DENV-infected cells (Fig. 7). In contrast, p-STAT1 showed both cytoplasmic and nuclear distribution in IFN+DENV-infected cells (Fig. 6C, e, f); although these cells also showed significant reduction of nuclear fluorescence (Fig. 7), IFN-treated-uninfected cells in comparison showed both cytoplasmic and nuclear fluorescence at any time (Fig. 6A, a, b).
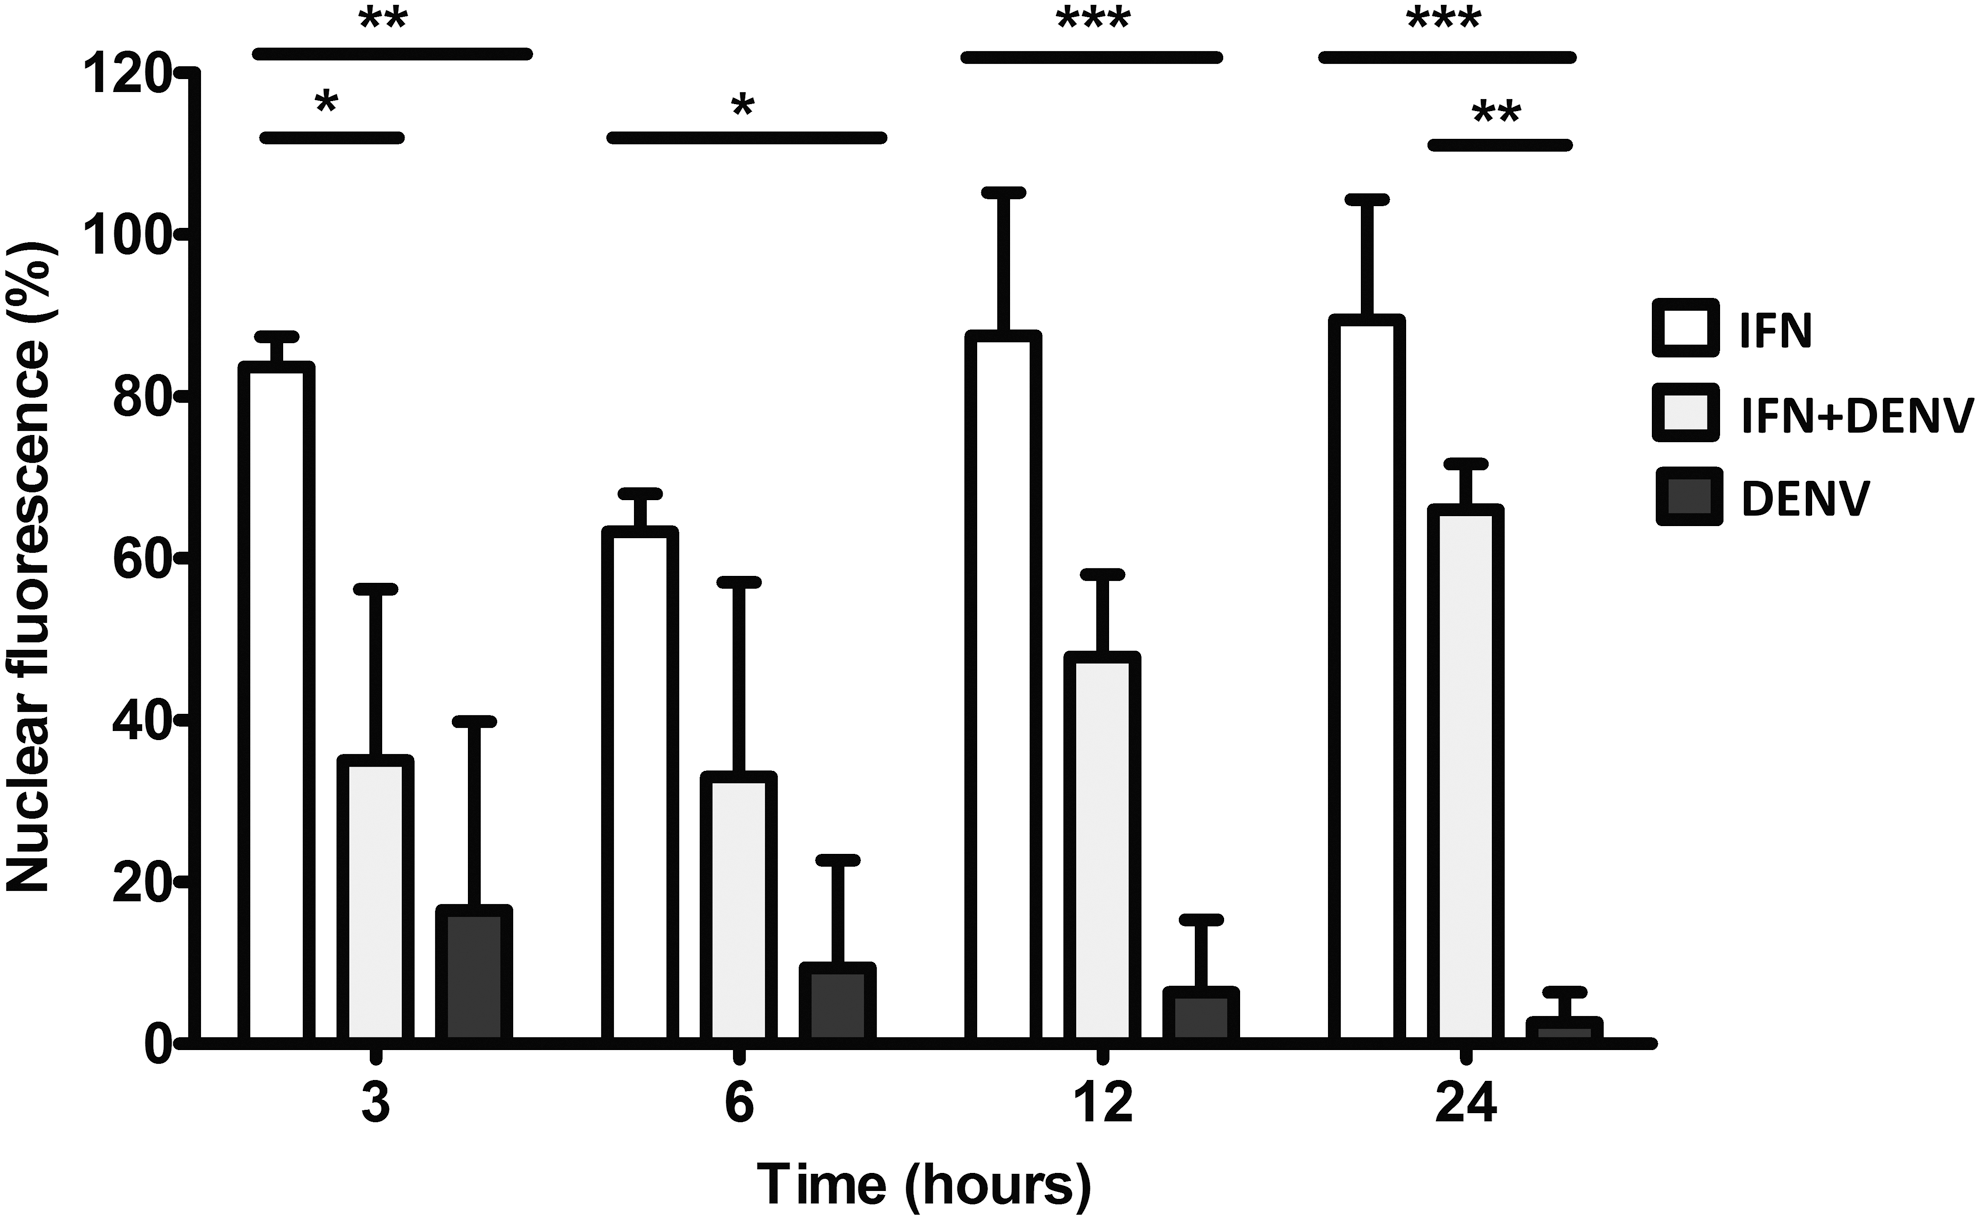
DENV infection reduces nuclear import of p-STAT proteins. Cell distribution of p-STAT1 was identified by immunofluorescence in U937 macrophages treated with IFN-α, infected with DENV, or both (IFN+DENV) as shown in Figure 6. One hundred cells were counted by plate and the proportion of nuclear fluorescent cells was recorded. Data represent means ± SD of three independent experiments. Statistical difference was determined by two-way ANOVA: *p < 0.05, **p < 0.001, ***p < 0.0001.
Discussion
The purpose of this study was to determine the expression kinetics of SOCS1 and SOCS3 in response to infection with DENV in U937 macrophages either untreated or treated with IFN-α. Our results showed that in the absence of a previous IFN-α stimulus, DENV infection induced high expression of SOCS1 and SOCS3, which correlate with lack of p-STAT2, limited nuclear importation of p-STAT1, and reduced expression of the antiviral genes MxA and OAS.
Reduced antiviral response could be a consequence of the combined effects of DENV (4, 15, 28, 39) and SOCS (48) proteins acting on diverse JAK–STAT components. Proteasomal degradation of p-STAT2 is a frequent effect of DENV infection caused by NS5 (4, 28 –30), which disrupts the activation of the innate response mediated by IFN. We found a complete lack of p-STAT2 in DENV-infected cells without a previous IFN-α stimulus, but abundant p-STAT2 proteins were observed when cells were treated with IFN-α and then infected. This suggests that once the innate response was established, because of IFN-α priming, p-STAT2 proteins were not susceptible to proteasomal degradation induced by DENV infection. More research is necessary to elucidate this observation.
SOCS1 and SOCS3 have been implicated in the inhibition of the JAK–STAT pathway and immune evasion in several viral infections (34, 36, 37, 49, 50). However, the role of SOCS proteins in dengue has been scarcely explored. Induction of SOCS1 and SOCS3 expression has been associated with ADE of DENV infection (12, 40, 46, 47). Ubol et al. found a decrease in IFN-β but increased IL-10, SOCS1, and SOCS3 expression, with a predominance of SOCS3, using subneutralizing concentrations of DENV antibodies in THP-1 cells. In addition, they found higher IL-10 and SOCS3 levels in DHF patients than in DF patients (47).
In contrast, Rolph et al. found increased SOCS3 and IL-6, but not IL-10 or SOCS1, when evaluating the enhancement phenomenon in macrophages differentiated from peripheral blood mononuclear cells (40). Chen et al. found that SOCS1 expression and IFN-γ expression were elevated in patients with DF, but not in patients with DHF, which in contrast had higher IL-10 level. In addition, they found SOCS1 expression in DENV-2-infected CD14 positive mononuclear cells (12).
We also found that expression of SOCS1 was higher than expression of SOCS3 in our study, with a 30:1 proportion between them by comparing their peaks of highest expression; but their ratio increases to 150:1 at the highest peak of SOCS1 at 6 h p.i. and decays to 3.5:1 at the highest peak of SOCS3 at 24 h p.i. Our results suggest that OAS expression is affected by SOCS1 more than by SOCS3, because the highest SOCS1 level is coincident with low OAS level at 6 h p.i., and the decay of SOCS1 parallels the increase of OAS at 12 h p.i. in DENV-infected cells (Figs. 2A and 4B).
The abundance of p-STAT1 in DENV-infected cells in WB assays was contradictory to previous observations (31). Thus we analyzed the cell distribution of p-STAT1 proteins, because persistence of p-STAT1 and its reduced nuclear translocation was found as the cause of antiviral response evasion in other viral infections (14, 43, 49). We observed the expression of cytoplasmic p-STAT1 and its transit into the nucleus in response to IFN-α in uninfected cells; in contrast, reduction of p-STAT1 nuclear import was found in cells treated with IFN and infected with DENV. Moreover, DENV infection in cells without IFN showed cytoplasmic but almost null nuclear fluorescence for p-STAT1 from 6 to 24 h of infection, indicating that p-STAT1 traffic into the nucleus was stopped.
Our results linked high expression of SOCS1 and SOCS3 with reduced translocation of p-STAT1. The crucial question is how these regulatory proteins interfere with the nuclear import of p-STAT1? Several works showed that high SOCS1 levels are directly associated with reduced JAK kinase activity, STAT phosphorylation, and entry into the nucleus in virus-infected cells (14, 19, 48). However, we found abundant p-STAT1, indicating that the kinase activity was not blocked by SOCS1 in DENV-infected cells in our study. Another explanation is that the lack of p-STAT2 leaves useless p-STAT1 molecules accumulated in the cytoplasm. Accumulation of cytoplasmic p-STAT1 has also been associated with overexpression of SOCS1 in other virus infections (14, 37, 45, 48, 50).
Another possibility is that a concurrent viral (45, 22) or cellular protein obstructed the formation of the nuclear import complex as did other negative regulatory proteins, such as PIAS1, that avoid the translocation of STAT1 by interfering with α-importin (43). In addition, SOCS proteins have been associated with failures in the nuclear import of other signaling molecules (21, 36). Further research is necessary to identify the precise molecular process involved in the inhibition of p-STAT1 translocation and their relevance in dengue pathogenesis.
Conclusions
Our results support that SOCS1 and SOCS3 upregulation is part of an immune evasion mechanism induced by DENV, because they contribute to inhibition of the cell signaling required for efficient control of virus infection.
Footnotes
Acknowledgments
T. Estrada-Jiménez had scholarships from CONACYT (No. 209881) and IMSS (98220625). This study was supported by the Mexican Institute of Social Security (IMSS, grants FIS/IMSS/PROT/G11/927, FIS/IMSS/PROT/G11/980, and CTFIS/1ORD/12/2011), and by Redes Temáticas-SEP (BUAP-CA-147). None of these institutions participated, determined, or interfered in any form with the design and development of the study, decision to publish, or preparation of the article.
Author Disclosure Statement
No competing financial interests exist.