
Abstract
The prevalence of genital warts (GW) and self-reported human papillomavirus (HPV) as well as disease-related psychosocial impact among male and female patients aged 18–60 years in India were assessed. GW prevalence was estimated using a 2-week daily log of patients examined from June 7-September 22, 2011 by 200 participating physicians in 6 regions of India. Psychosocial impact was estimated using one-time, self-administered surveys, including HPV Impact Profile (HIP), Cuestionario Específico para Condiloma Acuminado ([Spanish] CECA; “Specific questionnaire for Condylomata Acuminata”) and EuroQol-5 Dimension survey. T-tests or Mann–Whitney U-tests were used for continuous comparisons and Chi-square or Fisher exact tests were applied for categorical comparisons. Overall GW prevalence in India was estimated at 1.07% (95% confidence interval = 0.97–1.17) and was higher among men than women. Regional prevalence ranged from high in Delhi (2.17%) to low in Bangalore (0.40%). Patients aged 25–29 years had the highest GW prevalence (1.42%). GW patients were most often newly diagnosed (74.07%). Among those with existing GW, 56.24% were recurrent, and 43.76% were resistant. According to total HIP scores, 55.4% of male GW patients and 20.0% of those without GW reported moderate psychological impact (p < 0.0001). HIP scores among women revealed that patients with abnormal Papanicolaou (Pap) test results (34.3%), precancerous lesions (46.2%), external GW (48.0%), and those without HPV-related disease (18.5%) reported moderate psychological impact (p = 0.0089) (Psychosocial impact results are reported in the Supplementary Data). Estimated national GW prevalence, diagnosis, and treatment costs in India were higher for men than for women. GW in men and HPV infection in women had a negative psychosocial impact on well-being and health-related quality of life (HRQoL) scores, especially among women diagnosed with GW and precancerous lesions compared to those with other selected HPV-related diseases. Despite its limitations, this study provides an estimation of GW data in India not previously available.
Introduction
T
In India, GW incidence has been reported to vary from 2% to 25% among STI clinic attendees. (22) However, data on national GW incidence is limited, and prevalence estimates range from 1.4% to 25.06% (4,6,8). Research conducted in India has focused primarily on cervical cancer, one of the most common cancers among women in India. Cervical cancer constitutes from one-tenth to one-quarter of all female cancers with age-adjusted incidence rates ranging from 17.3 to 28.0 per 100,000 in the population-based cancer registries in the country (12).
Although a large number of newly diagnosed GW cases resolve without treatment, a GW diagnosis can have a tremendous psychosocial impact on patients. Studies have shown that GW can cause physical disfigurement, embarrassment, increased rates of anxiety and negatively impact sexual relationships (11). Research by Maw et al. indicated that up to two-thirds of male and female GW patients made lifestyle changes that impacted their relationships (17).
Research conducted in India focuses on high-risk HPV genotypes associated with cervical cancers. Current literature discussing GW caused by low-risk HPV infection in Indian society is limited. The aim of this study was to estimate GW prevalence in physician practices and to estimate self-reported HPV disease-related psychosocial impact (Supplementary Data; Supplementary Data are available online at
Materials and Methods
Study design
This was a cross-sectional study conducted by survey in six regions in India including Mumbai, Bangalore, Hyderabad, Chennai, Kolkata, and Delhi.
Inclusion and exclusion criteria
Participating physicians
Participating physicians were identified from the Intercontinental Marketing Services (IMS) database in India, which includes information on ∼191 obstetricians/gynecologists (OB/GYN), dermatologists (DERM), and medical doctor associations. In addition, the snowball sampling method was applied once the list from IMS data was exhausted. Physician offices located in Mumbai, Delhi, Kolkata, Chennai, Bangalore, and Hyderabad were selected, and data collected from these physicians were used to represent the entire country.
Physicians included in this study were those who: (a) Provided informed consent to participate and were specialists (primary care physicians [PCP], OB/GYN, urologists [URO], DERM) with 2–30 years of practice experience; (b) devoted at least 50% of their time to treating patients for outpatient visits three or more work days per week (as opposed to inpatient surgery, teaching, or other activities); (c) treated at least 50 patients for outpatient visits in a typical week; and (d) treated at least 50% of patients aged 18–60 years for outpatient visits.
Male patients
Male patients were included in the study if they were aged 18–60 years, in good self-reported physical health, and belonged to one of the following categories: (a) Newly diagnosed or existing external GW within 3 months of study recruitment; and (b) control group of patients who have never been diagnosed with GW, prescribed GW treatment, or had surgery or therapy in the genital area.
Female patients
Female patients were included in the study if they were aged 18–60 years, experienced an HPV-related event within the past 3 months, were in good self-reported health, and belonged to one of the following categories: (a) Abnormal Papanicolaou (Pap) test results with no definitive histology, conforming to the Bethesda Category-2001 category of squamous or glandular cell abnormality (e.g., atypical squamous cells of undetermined significance, atypical glandular cells of undetermined significance, low-grade squamous intraepithelial lesion, high-grade squamous intraepithelial lesion). Patients in this category were not diagnosed with precancerous cervical lesions and were required to have no previous high-risk HPV tests performed; (b) diagnosis of external GW or treatment for recurrence; (c) histological diagnosis of precancerous or cancerous cervical lesion (e.g., CIN1, CIN2, CIN3). Patients with precancerous cervical lesions and abnormal Pap test results within the last 3 months were placed in this category; and (d) normal Pap results (no cellular evidence of neoplasia). Patients in this category were required to meet: (i) No abnormal Pap test results within the past year; and (ii) never had definitive therapy.
Exclusion criteria
Patients were excluded from the study as follows: (a) Female GW patients with precancerous cervical lesions, abnormal Pap, and HPV-positive test results or abnormal Pap test results; (b) patients with presence of any other concurrent/active STI; (c) patients concurrently enrolled in clinical studies of investigational agents; (d) patients with a history of known prior HPV vaccination or recent (within 1 year from enrollment date) or ongoing alcohol or other drug abuse; (e) patients unable to give informed consent.
Statistical analysis
All study outcomes were summarized descriptively. For continuous variables, strata or subgroups were compared by Student's t-tests or analysis of variance models or the equivalent nonparametric tests depending on the normal distribution of continuous variables. For categorical variables, the differences between strata or subgroups were analyzed by Chi-square tests or Fisher exact tests depending on the distribution of patients across response categories. The corresponding p-values were provided. Data analysis was performed with SAS version 9.1 statistics software.
Prevalence
The prevalence of GW was estimated from a physicians' daily log of patients seen over a 2-week period. The number of new or existing GW cases was captured during consultations recorded in the physicians' daily logs.
GW prevalence in physician practices was calculated using the number of new or existing GW cases observed, divided by the total number of patients seen during the 2-week study period. Prevalence was estimated and stratified by physician specialty, age group, and sex for all patients. GW prevalence was estimated according to the underlying sample population to provide a national-level prevalence estimate. The national-level prevalence was estimated based on the estimated prevalence for each specialty and the distribution of GW patients who sought care. The proportion of GW patients at the national level seeing each specialty was calculated based on the formula, Gi = (Si × Di)/(Σi = 1–4 Si × Di), where S is the number of physicians of a specific specialty in the country (obtained from a database maintained by IMS consulting), D is the mean number of patients with GW (based on 2-week daily logs) seen by the specific specialty, and i is the specialty (PCP, OBGYN, URO, DERM). The proportions of patients seeing each specialty were used in the following formula to derive weights applied to patients included in the study database and then to derive national-level prevalence estimate: W = (Gi × nT)/(ni), where Gi is the proportion of GW patients at a national level attending to each specialty, nT is total number of patients counted in the study, and ni is the total number of patients counted in the study for specific specialty, i. Weighted prevalence was calculated based on the proportion of GW patients at the national level for each specialty, multiplied by the total number of patients in the study, and divided by the total number of patients seen by each specialist. In addition, prevalence was calculated using normal distribution, due to the large number of patients recorded in the daily logs (2). Prevalence rates were stratified by age group, sex, and physician specialty. Number, mean, and 95% confidence intervals (CIs) were reported.
Additional methods used for evaluating the psychosocial impact of GW and selected HPV diseases have been included in the Supplementary Data.
Results
Prevalence
A total of 322 physicians met the inclusion criteria, of which 122 declined to participate in the study. The final study sample of 200 physicians included 52 PCP, 50 DERM, 72 OB/GYN, and 26 URO (Appendix Table A1). Overall, the weighted GW prevalence was estimated at 1.07% (95% CI: 0.97–1.17; Table 1). GW prevalence was higher in DERM practices (1.74%), followed by OB/GYN (1.20%), URO (1.15%), and PCP (0.64%).
Percentage and 95% CI calculated accounting for the number of patients with identified GW status.
Due to the low number of male patients treated by OB/GYN (only 10), these patients have been excluded.
Data weighted according to specialty type.
GW, genital warts; CI, confidence interval; PCP, primary care physician; OB/GYN, obstetrician/gynecologist; URO, urologist; DERM, dermatologist.
A slightly higher overall prevalence was observed in male patients (1.22%; 95% CI: 1.06–1.38) compared with female patients (0.99%; 95% CI: 0.87–1.11). Prevalence differed significantly (p < 0.05) by region. The highest GW prevalence was found in Delhi (2.17%), followed by Hyderabad (1.35%), and Kolkata (1.21%; Table 2).
Data weighted according to specialty type.
“All patients” includes all patients reported in India.
Includes those patients with available information (excluding missing values) about GW status (yes/no).
Percentage and 95% CI calculated accounting for the number of patients with identified GW status.
Overall, the highest GW prevalence (1.42%) was found among patients aged 25–29 years, and the lowest prevalence (0.54%) was found among those aged >54 years (Fig. 1). Among men, GW prevalence increased until age 30–34 years, and among women, the highest prevalence was found in younger patients (aged 25–29 years). Prevalence was lower among women than men aged 18–40 years, and among older patients aged >54 years. GW prevalence was only higher among female patients aged 40–54 years.
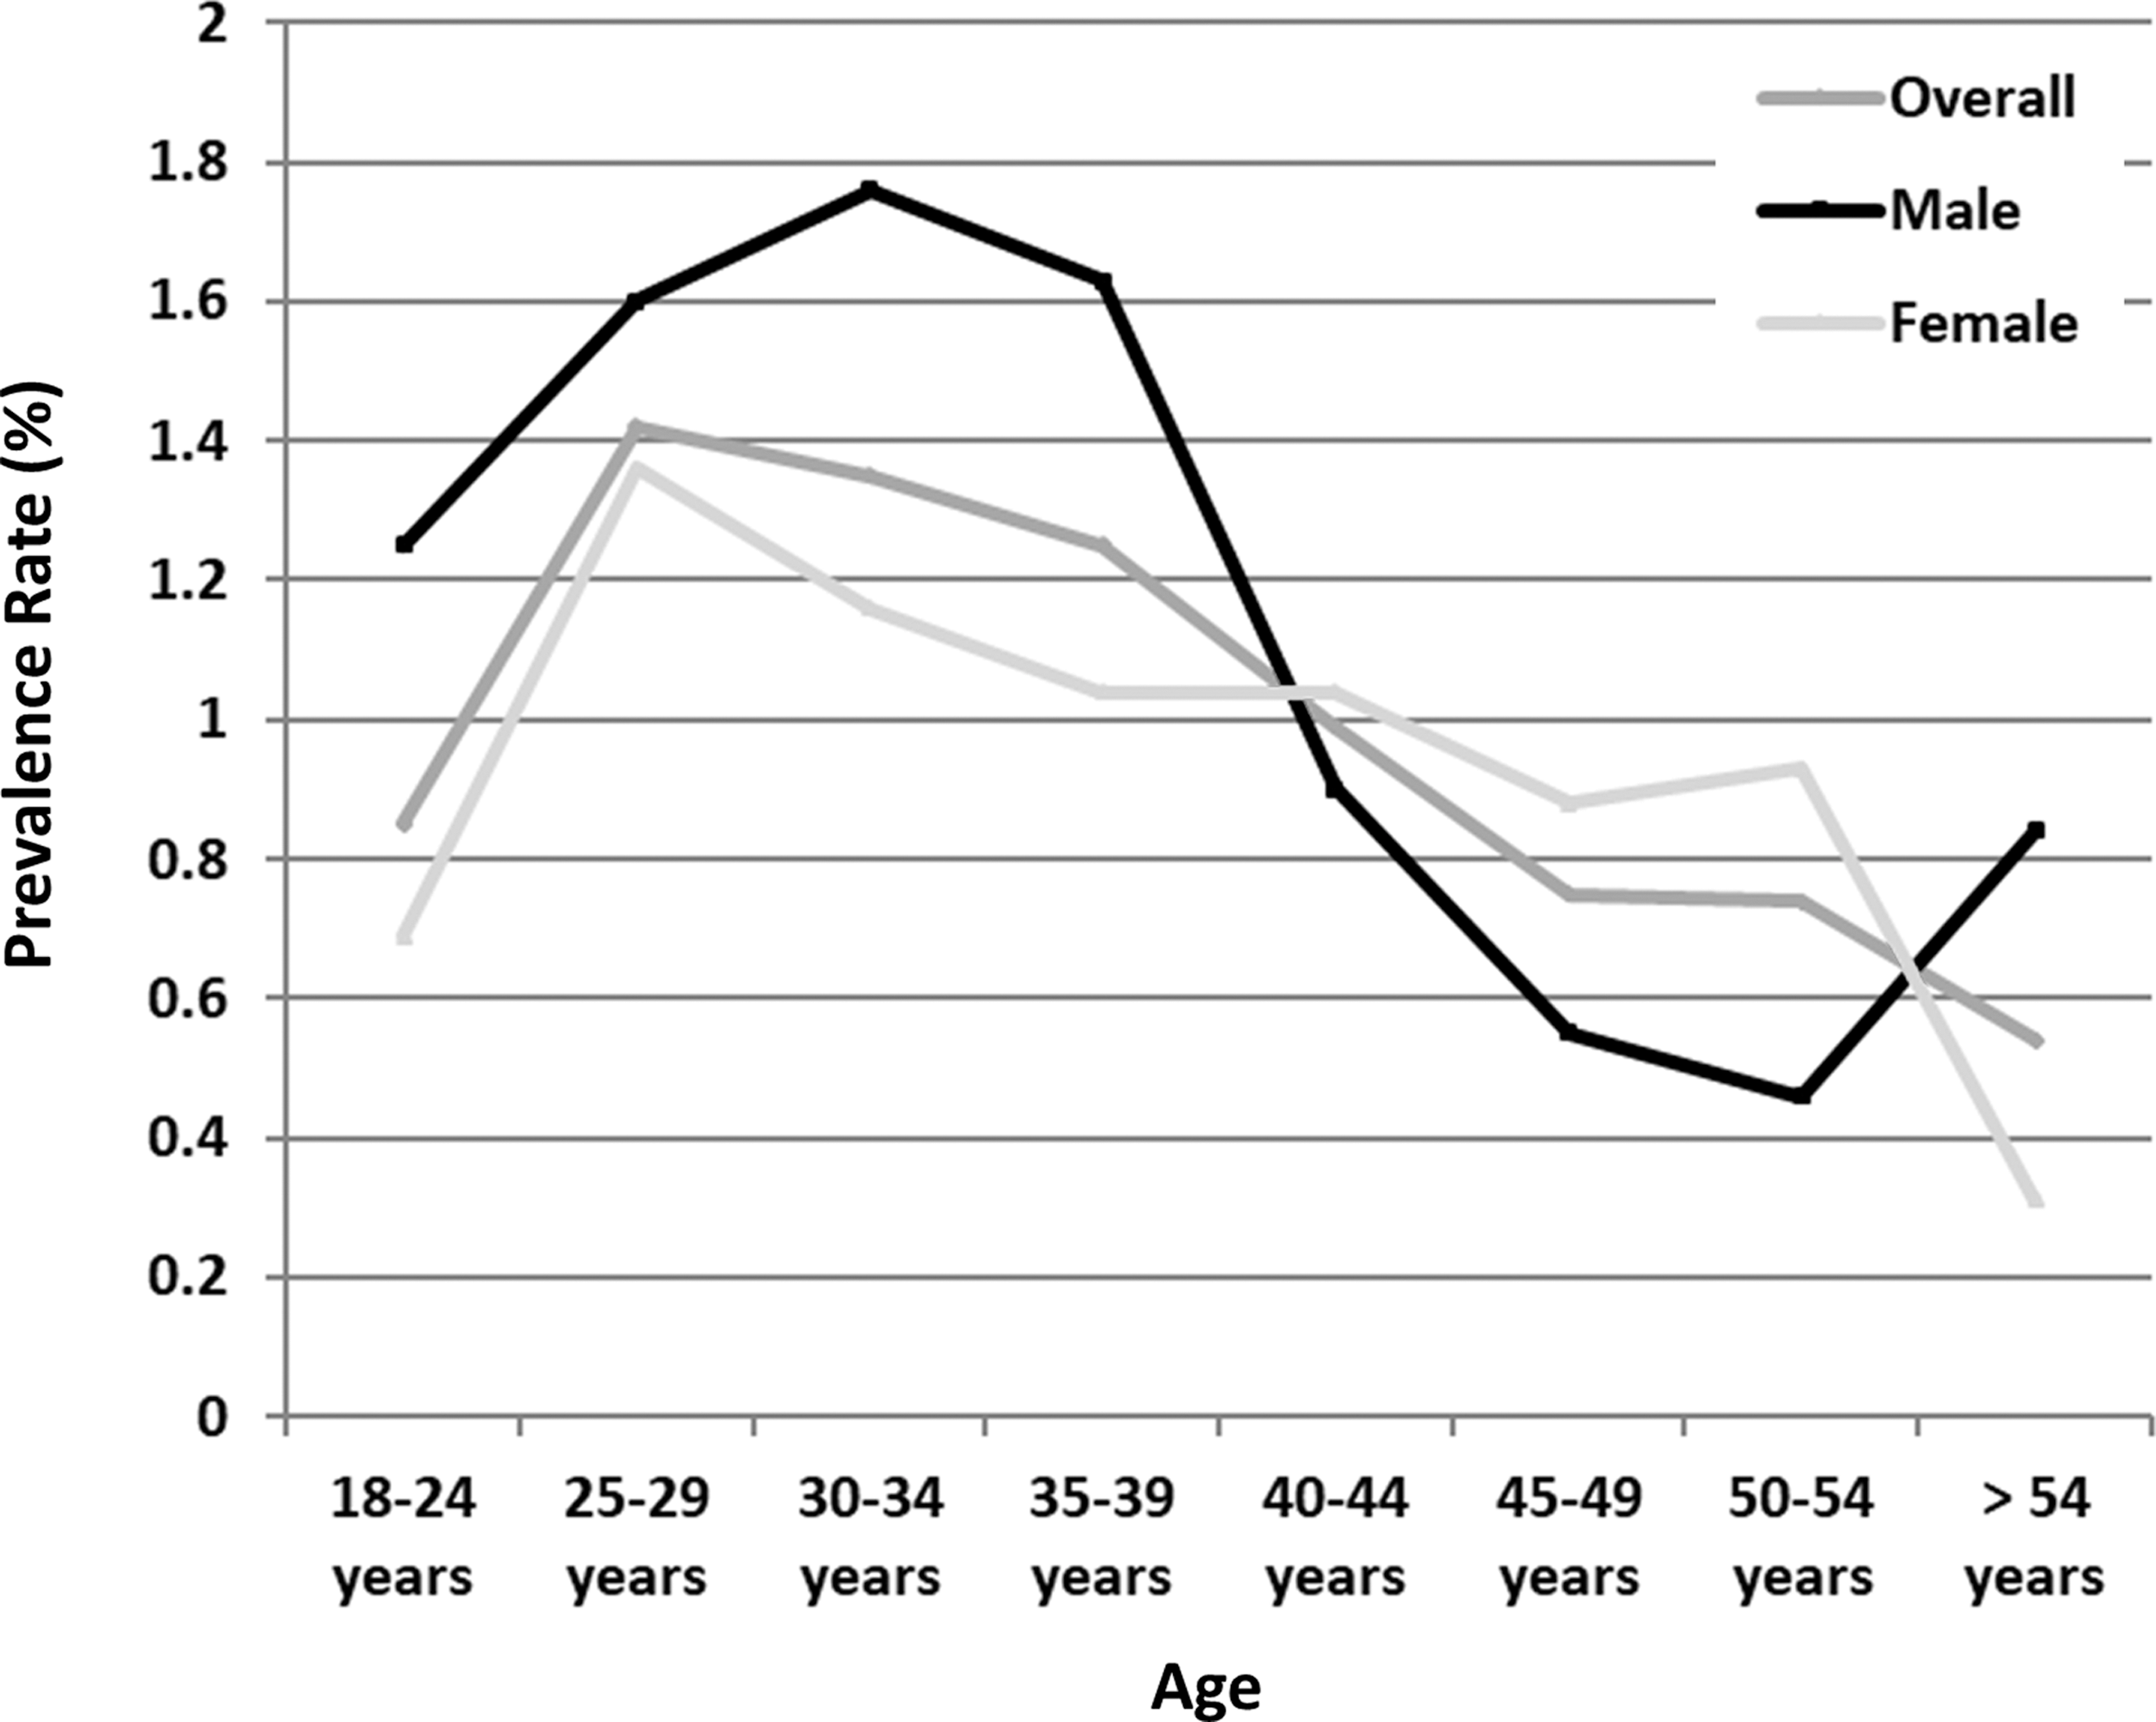
Genital warts prevalence by age and sex in India (weighted data).
For GW patients visiting physician offices during the 2-week study period, the percentage of existing GW cases was slightly higher in DERM offices (32.2%) than in the other specialties (22.5–25.5). The distribution of existing cases between recurrent and resistant cases was more heterogeneous by specialty. The percentage of resistant GW cases ranged from 57.9% in PCP to 25.0% in URO (Table 3).
New case: GW case that was not diagnosed previously by self or another physician.
Existing case: GW case that was diagnosed previously by self or another physician.
Recurrent case: GW case where previous episodes had resolved with treatment.
Resistant case: GW case where previous episodes had not resolved with treatment.
Additional results for the psychosocial impact of GW and selected HPV diseases have been included in the Supplementary Data.
Discussion
This cross-sectional study estimated the burden of GW in India by determining GW prevalence.
The current study estimated national GW prevalence at 1.22% among men and 0.99% among women in India, which is similar to reported estimates in recent literature (4,5,14,16). When analyzing all patients included in the study, GW prevalence was higher among male than female patients (1.22% vs. 0.99%), although the difference was not as significant as previously reported. In a previous study in India, Ray et al. reported a male-to-female ratio of 3.7:1.0 (20), including patients who visited a STI clinic for genital herpes and for GW treatment in New Delhi over a 15-year period. Differences were also obtained in the prevalence of GW according to geographical regions. Higher prevalence rates were obtained in Delhi (2.17%), followed by Hyderabad (1.35%), and Kolkata (1.21%). These regional differences should be interpreted with caution as the profile of participating physicians was not homogeneous across geography. Delhi had a higher number of participating OB/GYN physicians, which can be related to higher prevalence.
In terms of age, 62.5% of GW patients identified from the physicians' daily logs were 18–34 years, compared to 51.6% of patients in this age range in the entire study sample, showing a higher GW prevalence in younger patients. This age group is also observed to be more frequently diagnosed with STIs in other studies in India (3,7,10,15,21). In the Ray et al. study, most STI cases (68.5%) were reported to be aged 21–30 years, followed by 28.1% of patients aged 31–40 years (7).
After considering age distribution, GW prevalence further differs by sex. Among the younger population, male patients showed a higher GW prevalence rate than female patients. However, in an older population, GW prevalence was higher in females than in male patients. A retrospective study consulting with an STI clinic in India reported that 59.7% of male STI cases were aged 25–44 years (24). In the current study, this age group was defined as being more sexually active and at a higher risk of behavioral vulnerability to acquiring STIs, given the higher number of sexual partners, more concurrent partnerships, and frequent partner changes compared with older age groups.
In the current study, GW patients were primarily newly diagnosed (74.07%). Among those with existing GW, 56.24% were recurrent and 43.76% resistant. No previous data have been published in India related to the proportion of newly diagnosed or existing GW cases.
Additional discussion on the psychosocial impact of GW and selected HPV diseases has been included in the Supplementary Data.
Limitations
The current study has several limitations. Selection criteria defined for participating physicians required a minimum time to see patients for outpatient visits, which may have resulted in some physicians seeing more GW patients than other physicians of the same specialty, which may overestimate GW prevalence when data for each specialty office are projected at the national level. In addition, GW patients who did not seek treatment were not included in the study, which can underestimate the true prevalence in India, since weighting was applied.
Conclusion
GW is the most commonly diagnosed STI worldwide. In India, the overall GW prevalence was estimated at 1.07%. In addition, GW imposes a significant psychosocial impact on the individual and society. Study results also suggest that GW among men and HPV-related disease among women have a negative impact on patients' well-being and health-related quality of Life (HRQoL). In female cases, a major impact was observed in those diagnosed with GW and precancerous lesions. Despite its limitations, this study provides an excellent estimation of data not currently available. The results of this study indicate that the burden of GW is substantial in India and should be considered by physicians and public health officials when making recommendations for measures aimed to reduce GW-related prevalence.
Footnotes
Acknowledgments
The authors thank Furaha Kariburyo and Adesuwa Ogbomo of STATinMED Research for medical writing assistance.
Author Disclosure Statement
U.S.K., M.R., and A.R.C. have no conflicts to disclose. K.Y. was a paid contractor for Merck and Co. at the time of the study and was an employee of Cubist Pharmaceuticals December 2014–July 2015; it was acquired by Merck and Co. in January 2015. A.K., S.K.-T., and P.K.S. are employees of Merck and Co. S.M.G. received grants from the Commonwealth Department of Health for HPV, Merck and Co., and Glaxo Smith Kline to perform phase 3 clinical vaccine trials: Merck to evaluate HPV in RRP postvaccination program; CSL for HPV in cervical cancer study, and VCA for a study on the effectiveness of a public health HPV vaccine study, and a study on the associations of early onset cancers. Merck and Co. paid for travel and accommodation to present at HPV advisory board meetings. A.R.G. is a member of Merck and Co, Inc. advisory boards. Her institution has received grants and contracts to support HPV-related research. N.L. and M.R. are employees of IMS Health Barcelona, which is a paid consultant to Merck and Co.
Appendix
| PCP (n = 52) | DERM (n = 50) | OB/GYN (n = 72) | URO (n = 26) | Overall (n = 200) | |
|---|---|---|---|---|---|
| Region | |||||
| Mumbai, n (%) | 10 (19.2) | 9 (18.0) | 17 (23.6) | 7 (26.9) | 43 (21.5) |
| Bangalore, n (%) | 8 (15.4) | 7 (14.0) | 11 (15.3) | 5 (19.2) | 31 (15.5) |
| Hyderabad, n (%) | 7 (13.5) | 7 (14.0) | 13 (18.1) | 2 (7.7) | 29 (14.5) |
| Chennai, n (%) | 7 (13.5) | 5 (10.0) | 3 (4.2) | 15 (7.5) | |
| Kolkata, n (%) | 10 (19.2) | 10 (20.0) | 14 (19.4) | 6 (23.1) | 40 (20.0) |
| Delhi, n (%) | 10 (19.2) | 12 (24.0) | 14 (19.4) | 6 (23.1) | 42 (21.0) |
| Valid n | 52 | 50 | 72 | 26 | 200 |
Percentages calculated over the corresponding valid n.
PCP, primary care physician; DERM, dermatologist; OB/GYN, obstetrician/gynecologist; URO, urologist.
References
Supplementary Material
Please find the following supplemental material available below.
For Open Access articles published under a Creative Commons License, all supplemental material carries the same license as the article it is associated with.
For non-Open Access articles published, all supplemental material carries a non-exclusive license, and permission requests for re-use of supplemental material or any part of supplemental material shall be sent directly to the copyright owner as specified in the copyright notice associated with the article.