
Abstract
Virus replication and host cell growth require host cell metabolic networks to provide energy and precursors for the synthesis of macromolecules. The aim of this study was to investigate the most direct changes in energy metabolism and small-molecule metabolism of Madin–Darby canine kidney (MDCK) cells infected with H3N2 canine influenza virus (CIV) and to determine whether small metabolites contribute to the pathogenesis of CIV. To study the metabolomics of MDCK cells infected with H3N2 CIV, we used liquid chromatography–tandem mass spectrometry combined with multivariate statistical analysis. The results showed that 798 positive ions were detected, among which 33 were upregulated and 11 were downregulated, and 406 negative ions were detected, among which 33 were upregulated and 9 were downregulated. Through Kyoto Encyclopedia of Genes and Genomes (KEGG) enrichment analysis, we found that these differentially expressed molecules were mainly concentrated in the steroid hormone biosynthesis, amino sugar and nucleotide sugar metabolism, sphingolipid metabolism, vitamin B6 metabolism, cysteine and methionine metabolism, vitamin digestion and absorption, arginine and proline metabolism, biosynthesis of amino acids, and folate biosynthesis metabolic pathways. These pathways are involved in energy metabolism and nucleic acid and protein synthesis, which are essential for virus replication. Our experimental data suggest that H3N2 CIV infection reconstitutes/influences cellular metabolic processes, which in turn may contribute to viral replication. These findings are important for the development of enzyme inhibitors or metabolites for the identification of antiviral drugs. In addition, understanding the metabolic interaction between CIV and host cells is also very important for the complex pathogenicity of CIV, providing certain guidance for the treatment of canine influenza.
Introduction
Canine influenza virus (CIV), an influenza A virus, which is the influenza A virus, can cause cough, runny nose, fever, and other clinical symptoms in dogs. There are two main subtypes of CIVs: equine H3N8 and avian H3N2 (5,21,32). The influenza A virus genome consists of eight single-stranded RNA segments of negative polarity that encode ribonucleoproteins (PA, PB1, PB2, NP), hemagglutinin (HA), neuraminidase (NA), nonstructural proteins (NS1 and NS2), and matrix proteins (M1 and M2). In addition, the nonstructural proteins PA-X, PA-N182, PA-N155 (18), PB1-F2 (41), PB1-N40 (42), M42 (17), NS3 (30), and PB2-S1 have also been discovered (2).
The metabolome is defined as the total of all small-molecular-weight metabolites (<1,000 Da) that an organism or cell produces during a specific physiological period. Metabolomics, which is an omics technology that emerged after genomics, transcriptomics, and proteomics, is an important part of systems biology. Metabolomics aims to investigate the changes in metabolites in biological systems (cells, tissues, etc.) after stimulation or disturbance or with change over time. By determining the different metabolites between the experimental group and the control group, metabolomics studies biological processes. Metabolomics is a more phenotypic omics compared with transcriptomics or proteomics; it is an extension of transcriptomics and proteomics, and can reflect the physiological state of organism more directly and accurately. Inferring biochemical mechanisms from metabolomics data is of great significance, and it can provide new insights into the pathophysiological mechanisms of diseases and enhance diagnostic and prognostic tools (10,13,27). For example, people have successfully found that fatty acids are an important marker of abnormal lipid metabolism in diabetic patients by metabolomic analysis (39,44); nucleosides are important tumor markers as a class of metabolites (26,45). Metabolomics also has important research and therapeutic value in cardiovascular disease (19), post-transplant detection (31) and inflammatory bowel disease (23).
Previous metabolomics reports have shown great promise in assessing the mechanisms of viral infection by human cytomegalovirus, dengue virus, herpes simplex virus-1, classical swine fever virus, Zika virus, and respiratory syncytial virus (1,6,8,15,20,37,38). Metabolomics research has been instrumental to diagnose and characterize certain metabolic diseases, such as cancer, diabetes, obesity, and metabolic syndrome (4,7,14,16,22,34,48). Currently, common metabolic pathways that have been well studied include the tricarboxylic acid cycle, glycolysis, and arachidonic acid/inflammatory pathways.
To explore the complex interactions between CIV and host cells, transcriptomics and proteomics methods have been used to analyze the relevant cellular mechanisms (11,33,35,46,47). However, the systemic changes of metabolites in CIV-infected cells remain unknown. In this study, we used liquid chromatography–tandem mass spectrometry (LC-MS/MS) (9,40) and characterized the metabolomics of Madin–Darby canine kidney (MDCK) cells infected with H3N2 CIV with multivariate statistical analysis.
Materials and Methods
Viruses and cells
This study did not involve animal experiments and IRB is not applicable. The CIV H3N2 (A/canine/Guangdong/B/2013) was isolated from the nasal swab of a pet dog with severe respiratory symptoms in Guangdong Province. MDCK cells were obtained from the American Type Culture Collection (ATCC) and propagated in Dulbecco's modified Eagle's medium (DMEM) with 10% fetal bovine serum.
Titration of viral infectivity and HA activity
To measure viral titers, cells cultivated in 96-well plates were infected with a series semilogarithmic dilution (10−3, 10−3.5…10−8) of CIV. The HA titer was measured after the cytopathic lesion stopped developing (usually 72–96 h). The TCID50 titer was calculated by the Reed-Muench method. A specific reference (No. CNICSOP07013) was made to the titration of tissue cell infection volume by the National Influenza Center of China.
Virus growth curve
MDCK cells with 80% confluence in a 25-cm2 cell culture flask were infected with CIV (multiplicity of infection [MOI] = 1 and 0.1). Subsequently, 100 μL of viral supernatant was harvested at 6, 12, 18, 24, 30, 36, and 42 hpi (repeated three times). The virus growth curve was drafted according to viral titers.
Sample preparation and LS-MS/MS analysis
MDCK cells were cultured in a 10-cm Petri dish. When the cells reached 80% confluence, the cells were inoculated with H3N2 CIV (MOI = 1) for 24 h (the time point of 24 h was chosen as the fastest reproduction rate of the strain was from 18 to 24 h, and it had almost completed the proliferation at about 24 h. The control group received the same treatment without virus, six duplicate samples in each group), the cells were washed repeatedly three times with precooled PBS, then the cells were removed from the Petri dish, and 1 mL of precooling 60% methanol solution (Thermo Fisher) was added to quench intracellular metabolism. The cells were then centrifuged at 4°C for 1 min at 1,000 g low speed. The supernatant was removed, and the cells were collected in 2-mL cryopreserved tubes. The samples were placed in frozen liquid nitrogen for 15 min and then stored at −80°C until analysis. The samples were then sent to Novogene (Beijing, China) for untargeted metabolomics analysis.
Cells (100 mg) were individually grounded with liquid nitrogen, and 100 μL of the homogenates was resuspended with precooled 100% methanol (−20°C) followed by well vortexing. The samples were incubated at −20°C for 60 min and then centrifuged at 14,000 g and 4°C for 15 min. Then, the supernatants were transferred to a fresh microcentrifuge tube and dried under vacuum in a centrifugal evaporator. The dried metabolite pellets were redissolved in 80% methanol and analyzed by LC-MS/MS.
LC-MS/MS (43) analyses were performed using a Vanquish UHPLC system (Thermo Fisher) coupled with an Orbitrap Q Exactive HF-X mass spectrometer (Thermo Fisher) operating in the data-dependent acquisition mode. Samples were injected onto an Accucore HILIC column (100 × 2.1 mm, 2.6 μm) using a 20-min linear gradient at a flow rate of 0.3 mL/min. The eluants of the positive polarity mode were eluant A (0.1% formic acid, FA, in 95% acetonitrile, ACN, 10 mM ammonium acetate) and eluant B (0.1% FA in 50% ACN, 10 mM ammonium acetate). The eluants of the negative polarity mode were eluant A (95% ACN, 10 mM ammonium acetate, pH 9.0) and eluant B (50% ACN, 10 mM ammonium acetate, pH 9.0). The solvent gradient was set as follows: 2% B, 1 min; 2–50% B, 16.5 min; 50–2% B, 2.5 min. The Q Exactive HF-X mass spectrometer was operated in positive/negative polarity mode with a spray voltage of 3.2 kV, capillary temperature of 320°C, sheath gas flow rate of 35 arb, and aux gas flow rate of 10 arb.
The quality control in the LC-MS/MS analyses
Metabolomes are susceptible to external factors and change rapidly. Therefore, data quality control (QC) is an essential step to obtain reproducible and accurate metabolome results. The Pearson correlation coefficient between QC samples was calculated based on the peak area value. The higher the correlation of QC samples (R2 is closer to 1), the better the stability of the whole detection process and the higher the data quality.
Screening differential metabolites
Because of the characteristics of high dimensionality and high correlation between variables, traditional univariate analysis cannot quickly and accurately explore the potential information in the data. Therefore, multivariate statistical methods, such as principal component analysis (PCA) and partial least squares discrimination analysis (PLS-DA), should be used in the metabolomics data analysis. Based on the maximum retention of the original information, downscaling and regression analyses were carried out on the collected multidimensional data, followed by screening of differential metabolites and subsequent analysis.
Differential metabolite analysis
In this experiment, cluster analysis of differential metabolites, correlation analysis of differential metabolites, and enrichment analysis of differential metabolite Kyoto Encyclopedia of Genes and Genomes (KEGG) (24) were used to conduct in-depth analysis of the data.
Results
Growth kinetics of H3N2 in MDCK cells
To determine the fastest growth time of CIV (GD2014) in MDCK cells, MDCK cells were infected by CIV (MOI = 1 and MOI = 0.1), and the TCID50 of CIV was detected at the time points of 6, 12, 18, 24, 30, 36, and 42 h, and the infectivity (TCID50/mL) of CIV was plotted. The results showed that the infection measures differ by a factor of 10, with almost no significant difference at the late stage of infection, and the growth curves after cells are infected with different doses are similar, possibly because MDCK cells are very suitable for the growth of influenza virus and the fastest growth time of CIV was 18–24 h after the infection of cells (Fig. 1).
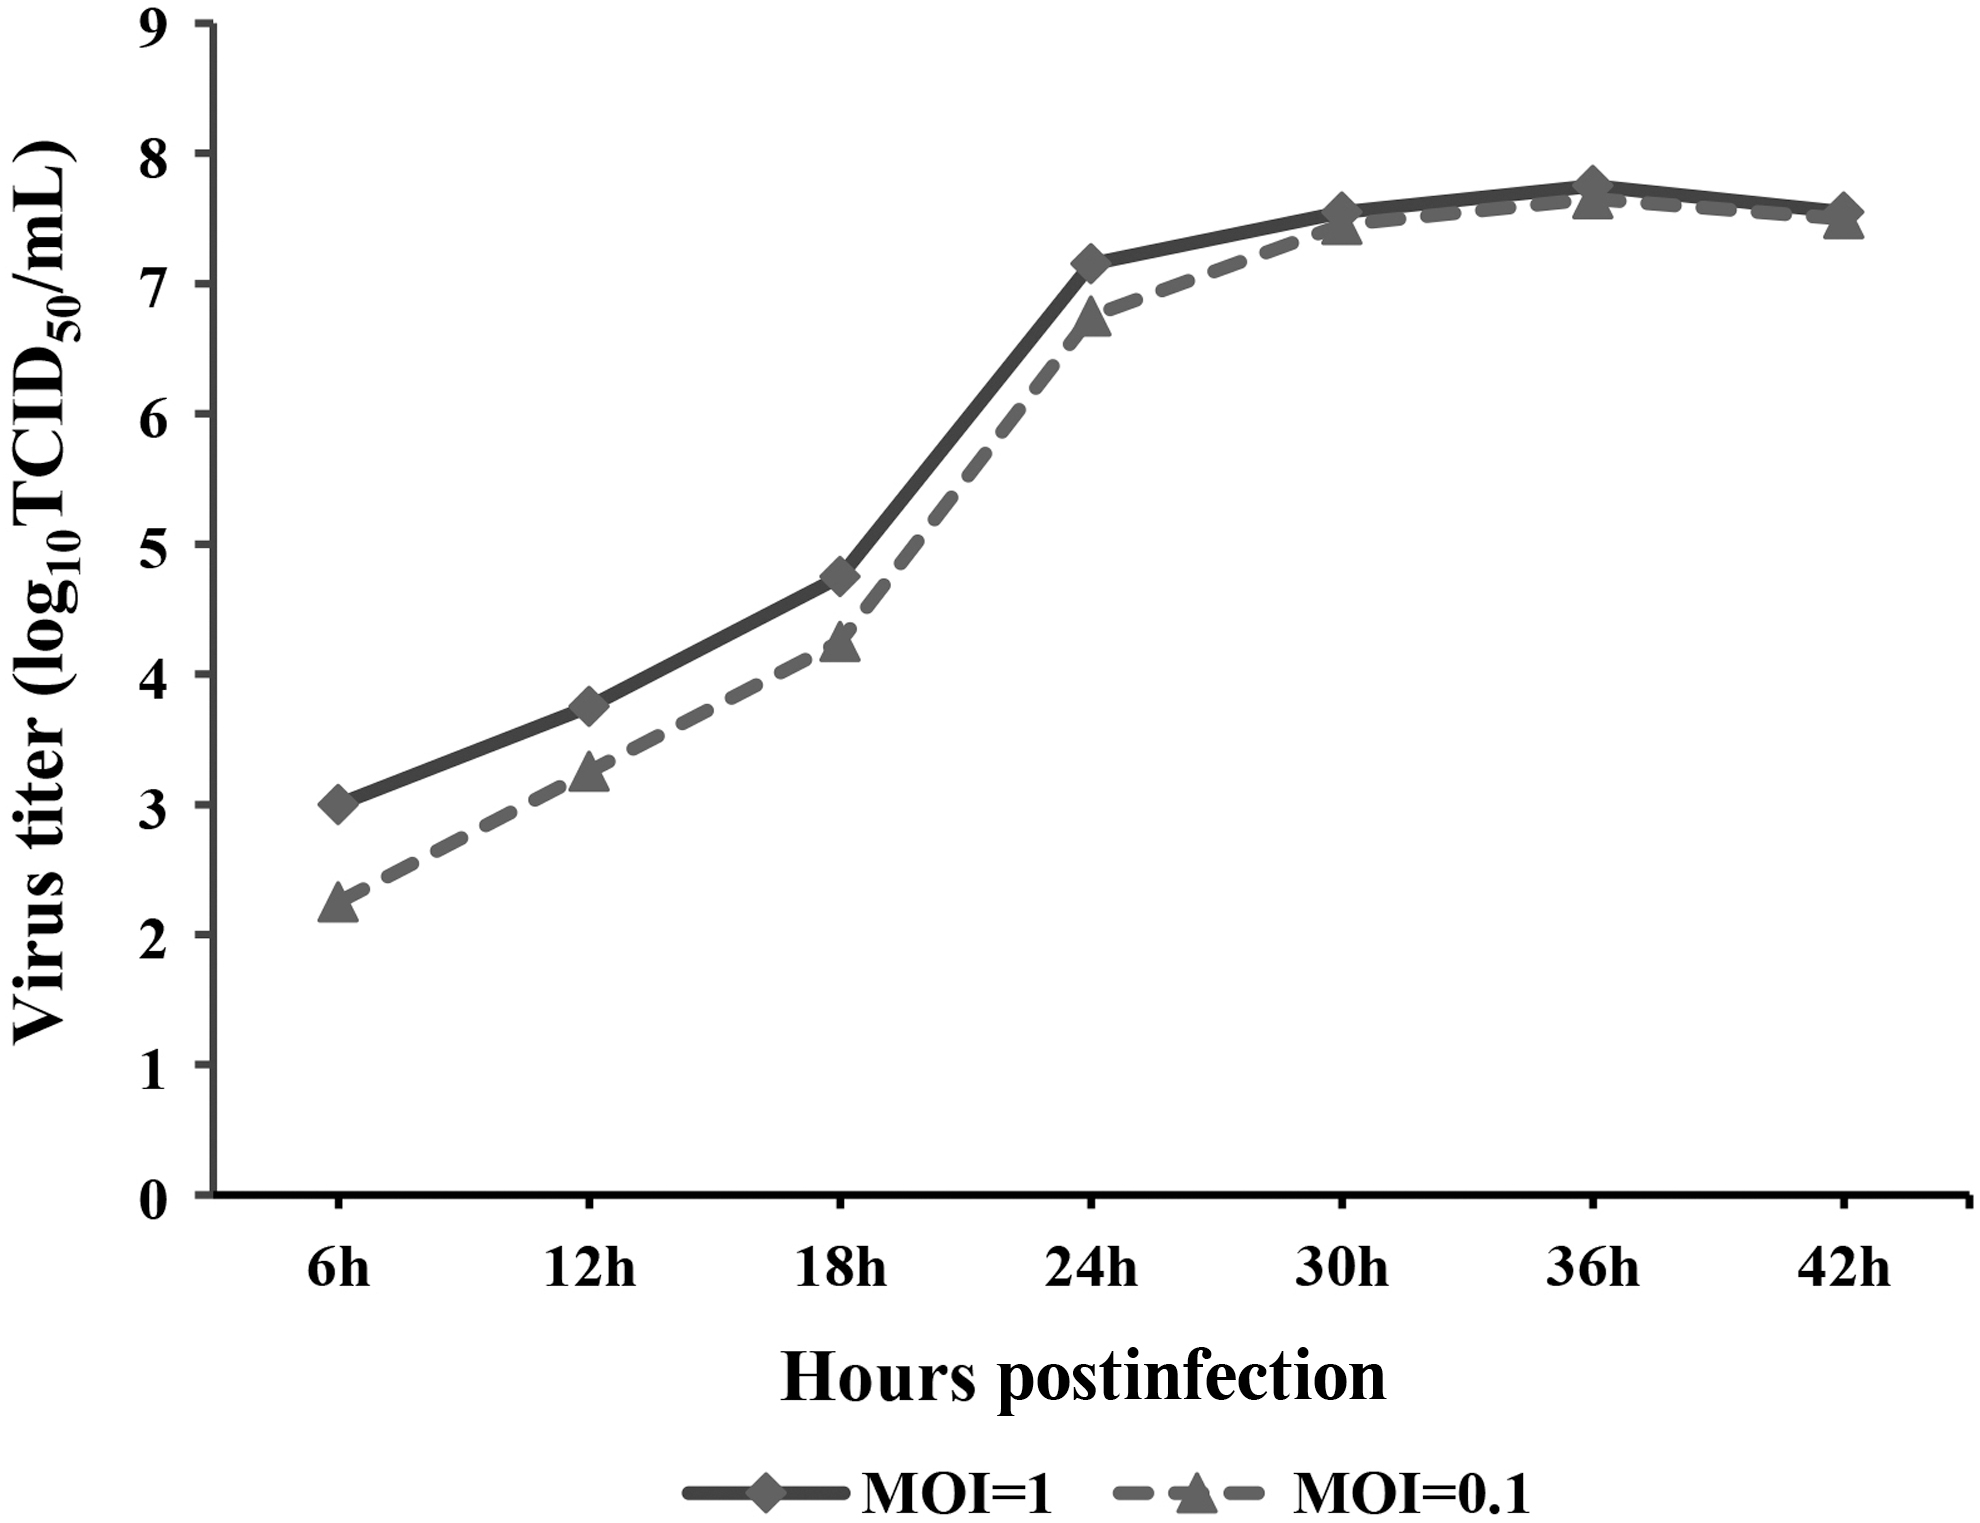
Replication kinetics of H3N2 in MDCK cells. The data were analyzed using one-way ANOVA (p < 0.05). Data are presented as the mean ± SD of independent triplicate experiments. MDCK, Madin–Darby canine kidney.
Screening differential metabolites
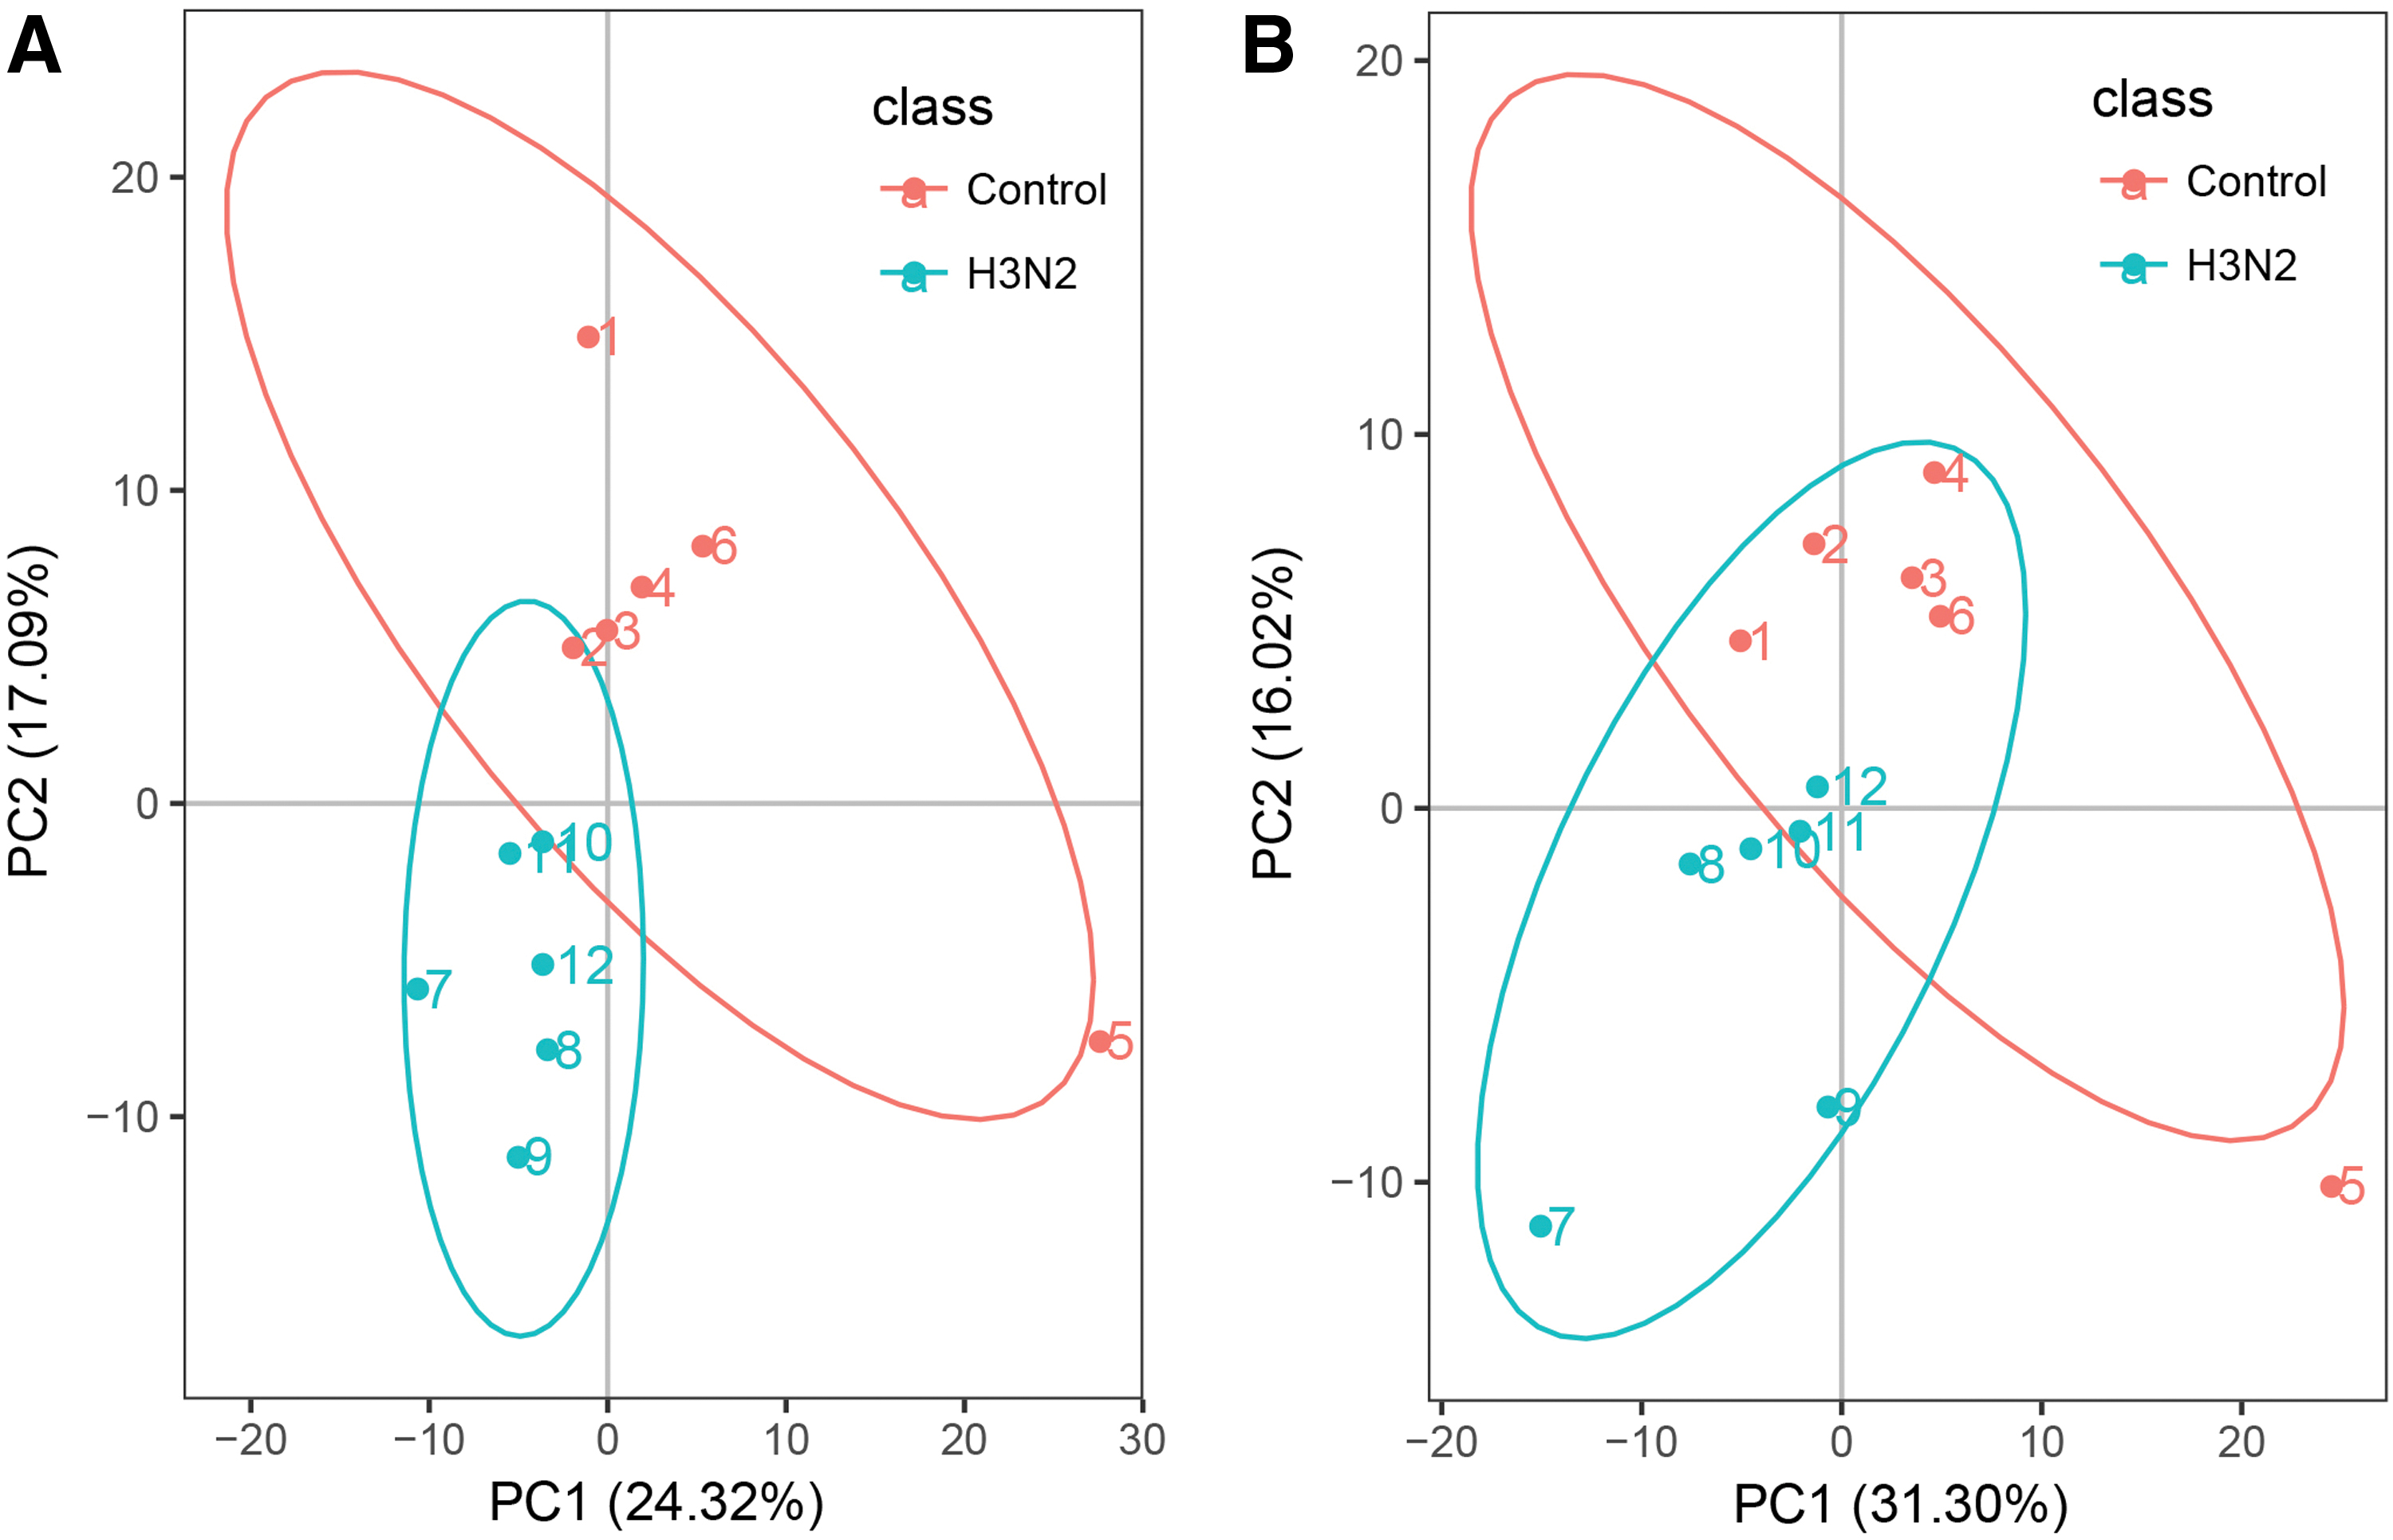
PCA was used to observe the overall distribution trend between the two groups of samples. The figure clearly shows that the control group and H3N2 group are divided into two parts with obvious differences (Fig. 2).
PCA
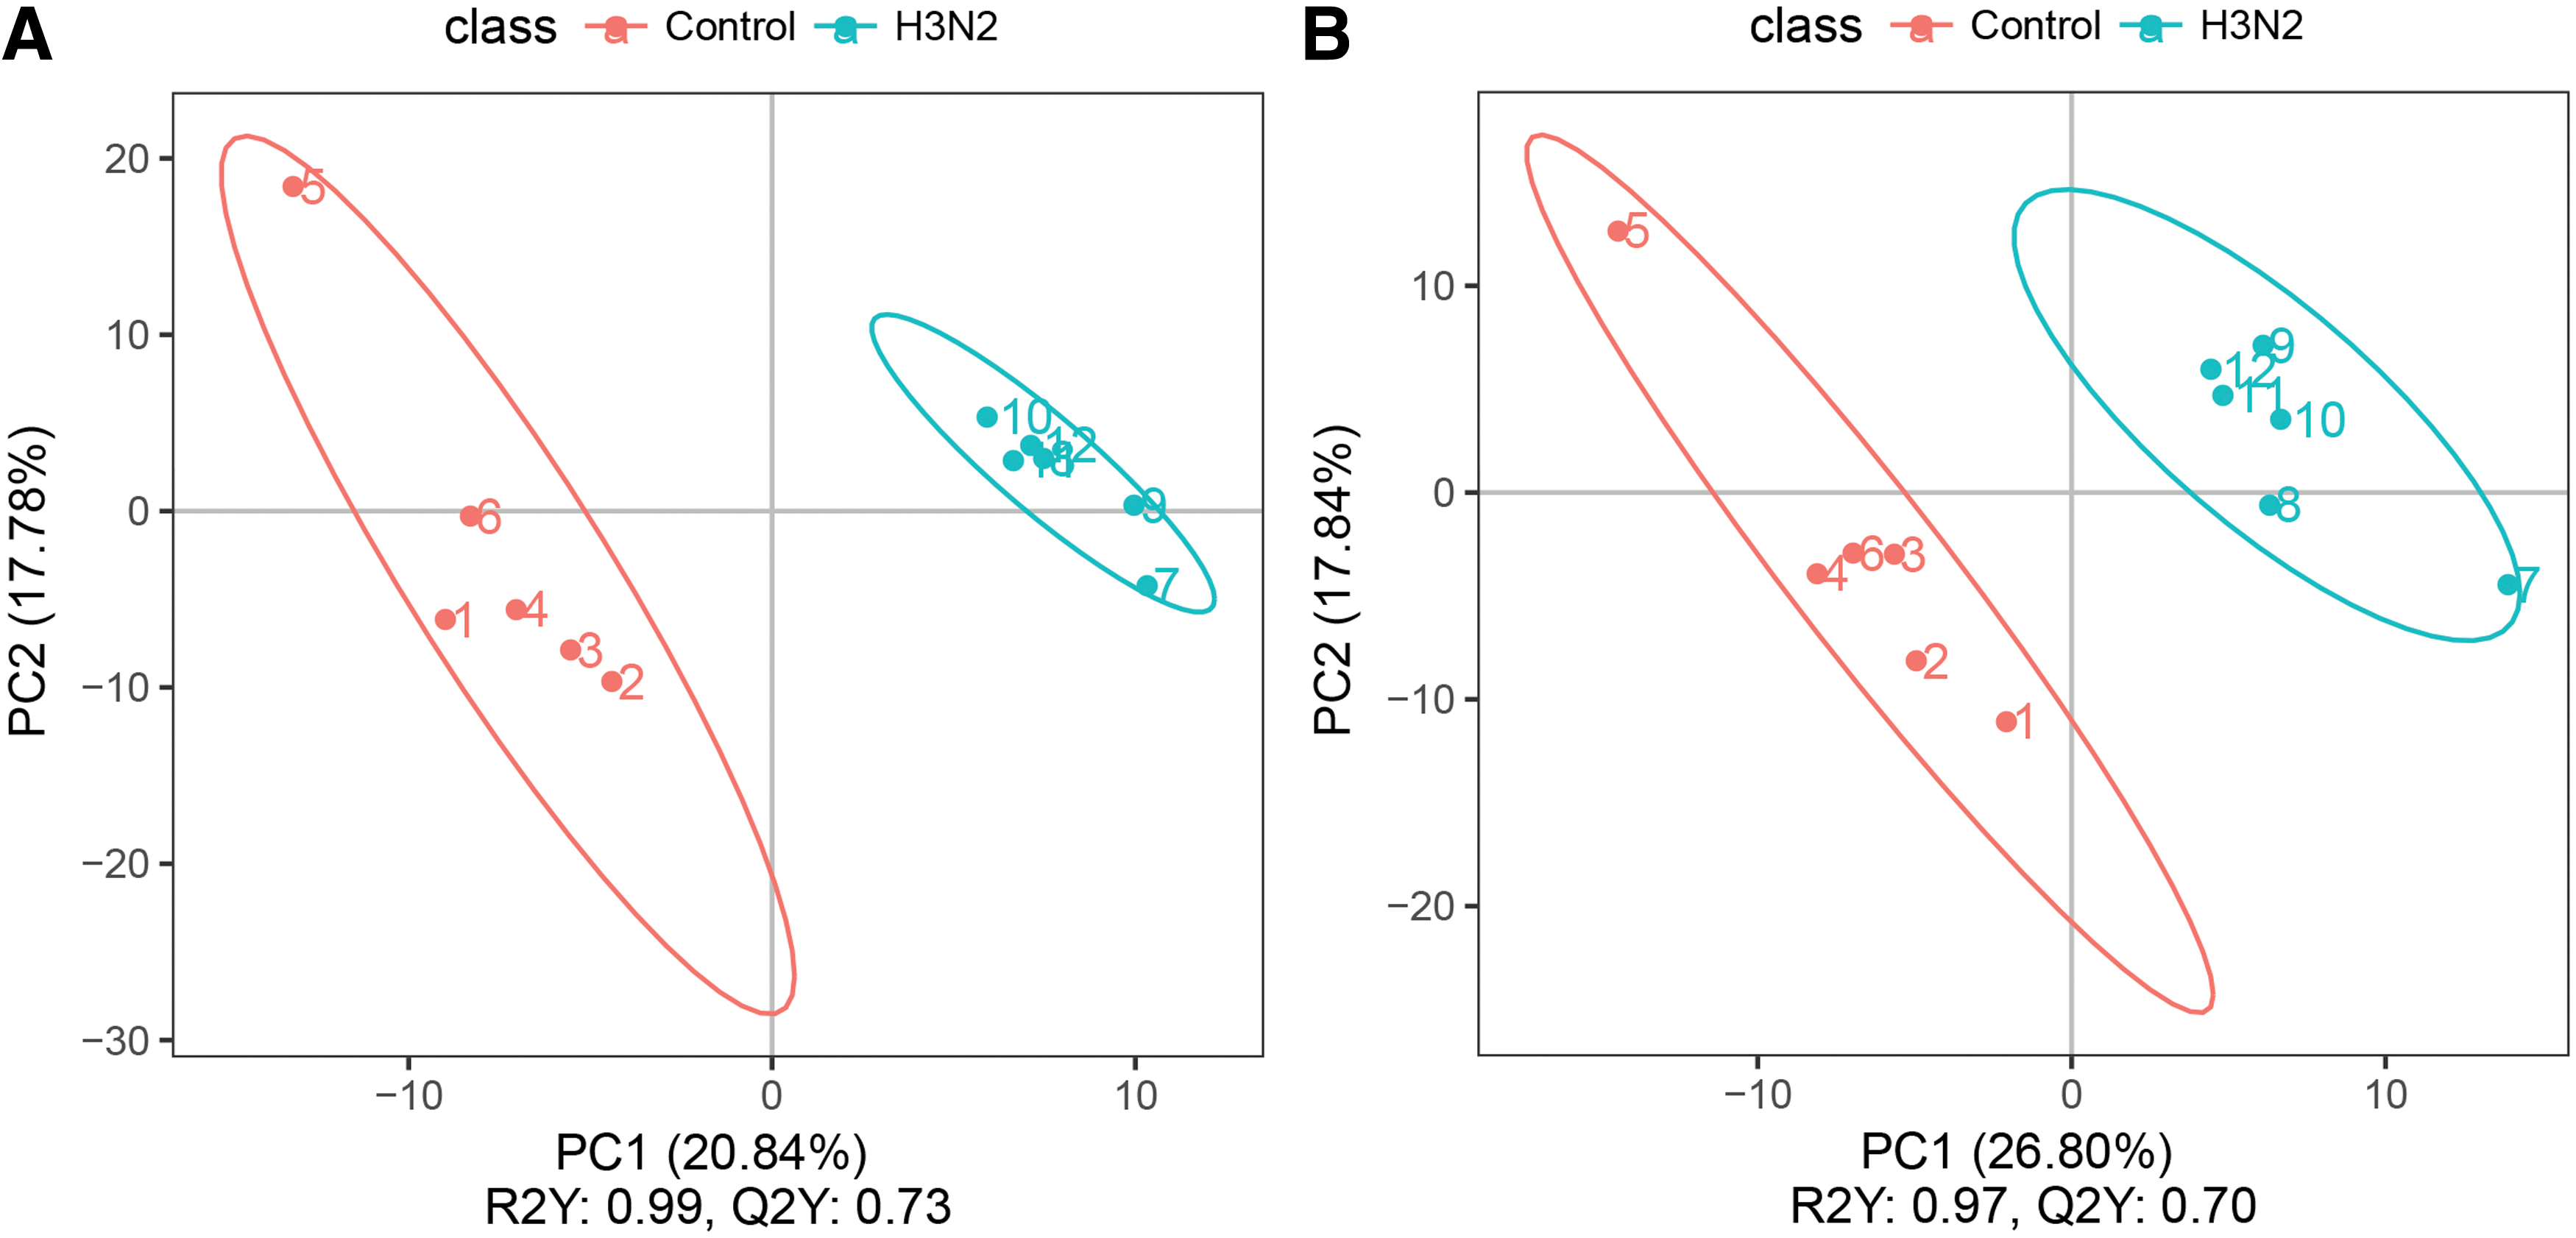
PLS-DA is a supervised discriminant statistical method. In this method, partial least squares regression (3) was used to establish the relationship model between metabolite expression and sample category to predict the sample category. The PLS-DA model of each comparison group was established, and the model evaluation parameter (R2, Q2) was obtained by sevenfold cross-validation. The closer R2 and Q2 are to 1, the more stable and reliable the model is. Through PLS-DA, the positive ion mode had R2 = 0.99 and Q2 = 0.73, and the negative ion mode had R2 = 0.97 and Q2 = 0.7, indicating that our data model with differential expression was well established (Fig. 3).
PLS-DA scatter point diagram and sorting validation diagram
Differential expression metabolite analysis of MDCK cells infected with H3N2
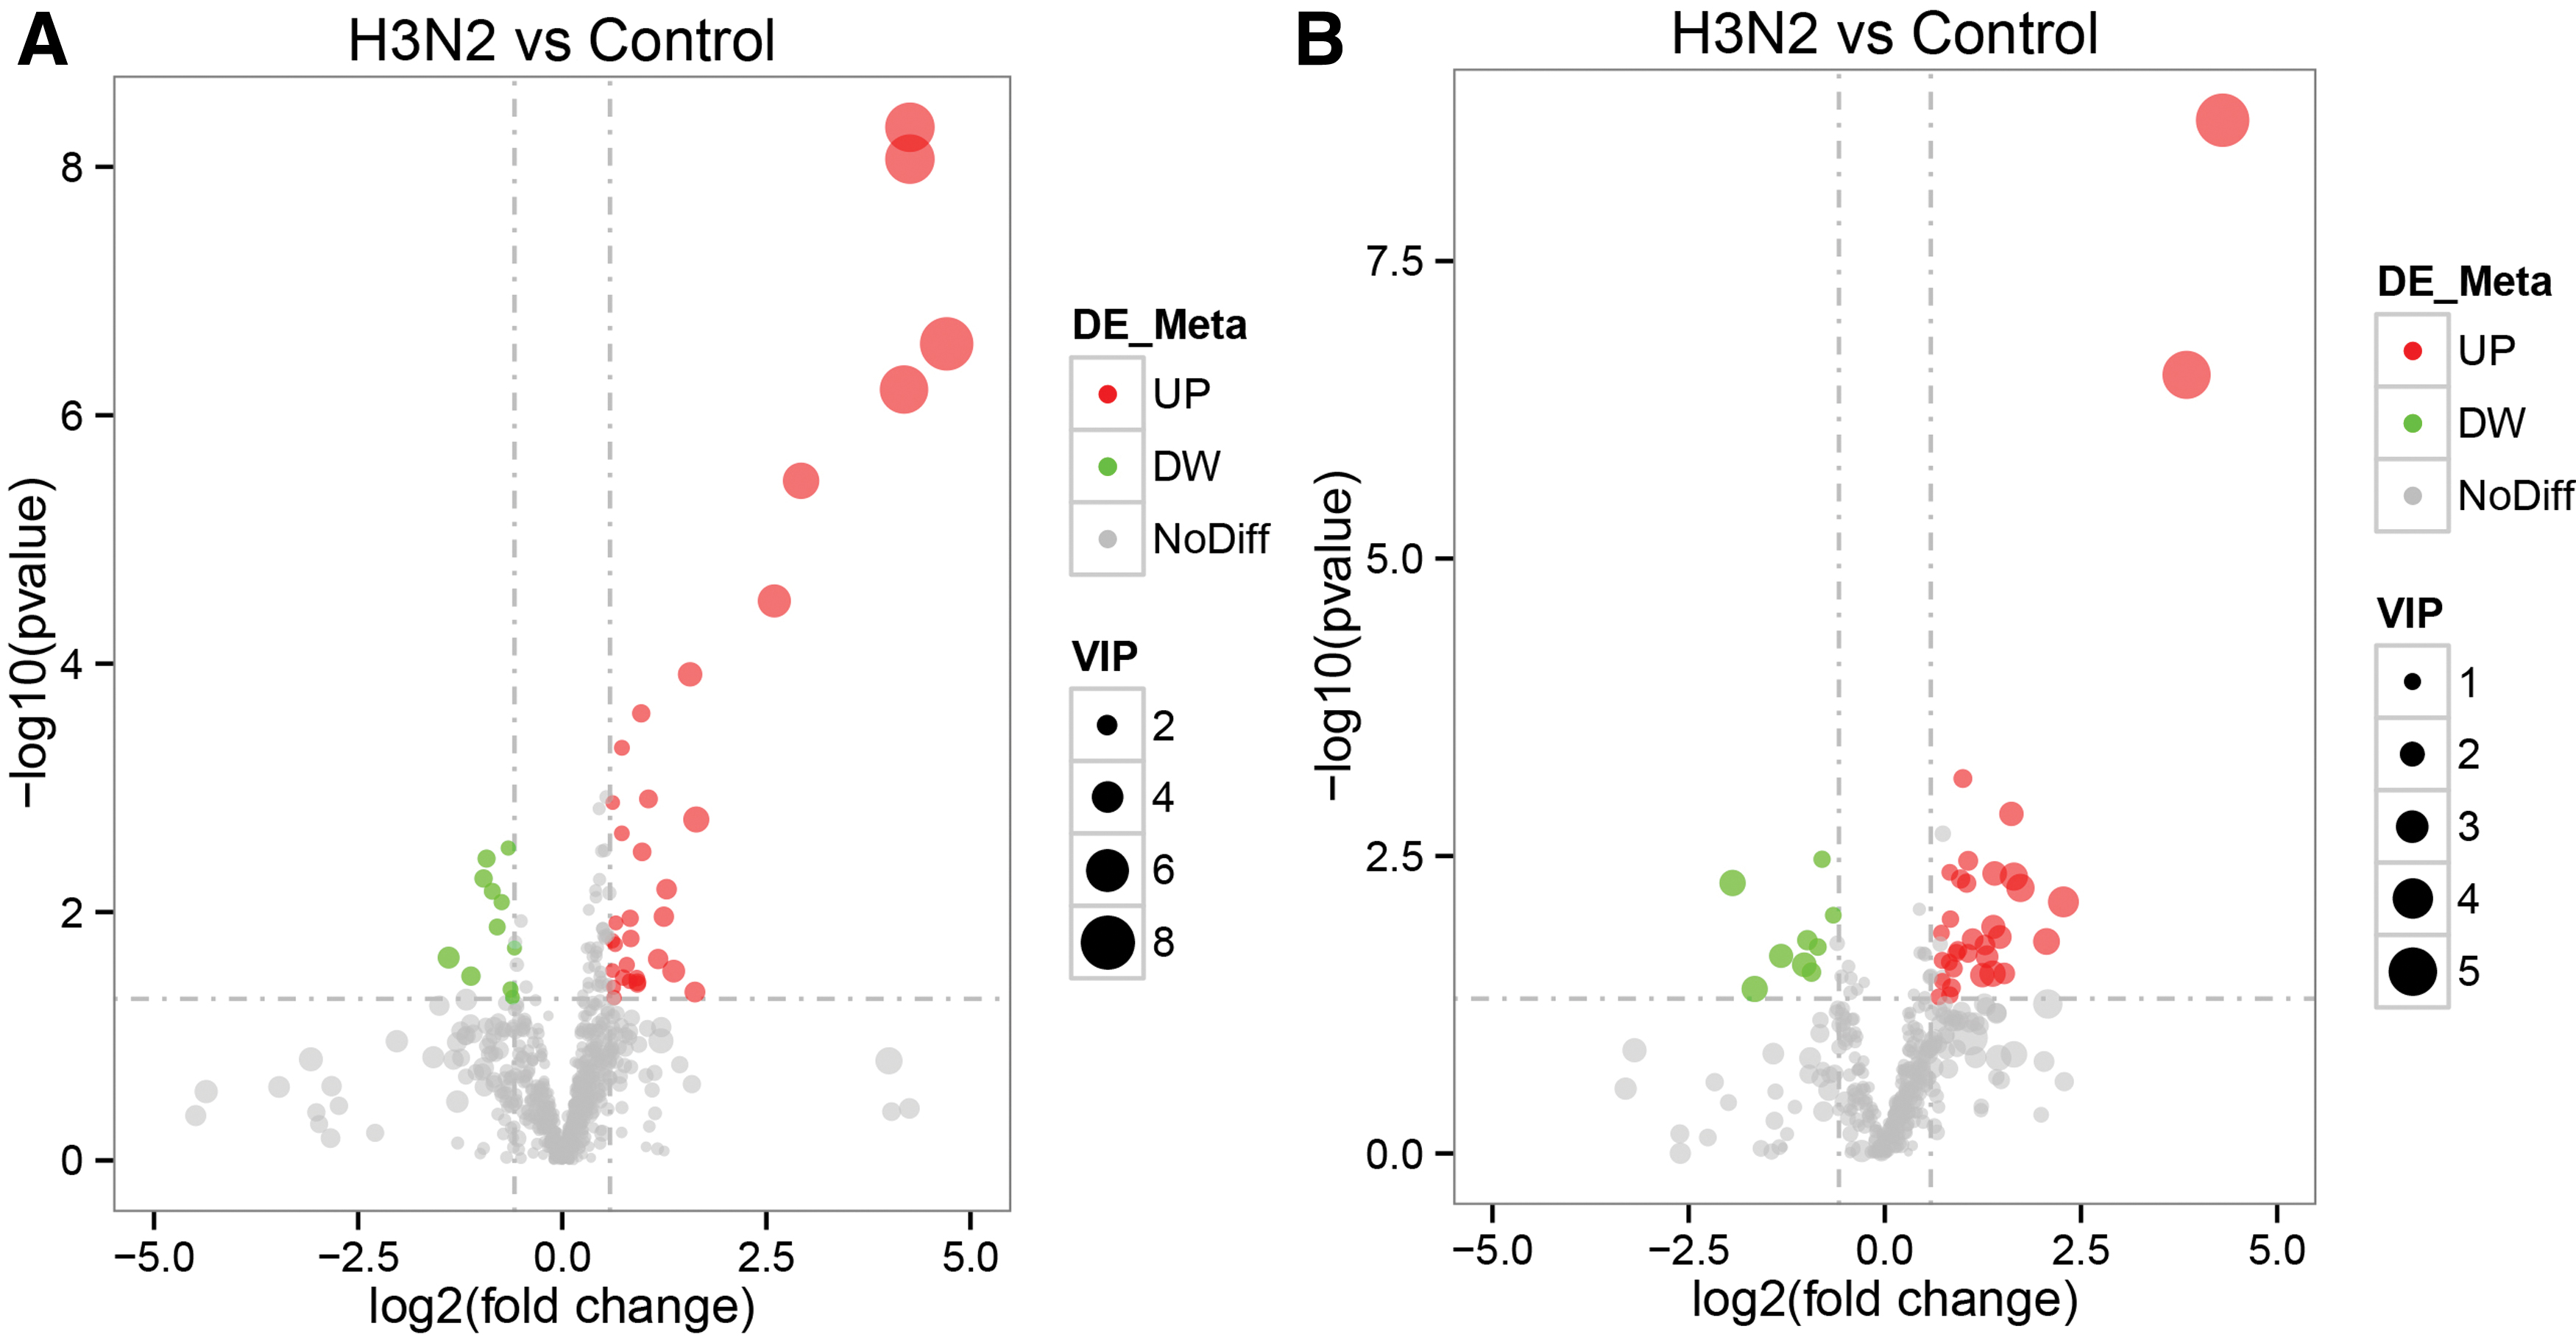
In the PLS-DA model, the variable importance in the projection (VIP) value of the first principal component was adopted. The VIP value represents the contribution rate of different metabolites in different groups. Fold change (FC) is the ratio of the mean of repeated quantitative values of each metabolite in the comparison group. In addition, combined with the p-value of the t-test to find the differential expression metabolites, the threshold value was set as VIP >1.0, difference multiple FC >1.5 or FC <0.667, and p-value <0.05. There were 798 positive metabolites, with 44 significant differences in H3N2 versus control, and 33 upregulated and 11 downregulated metabolites. Four hundred six negative metabolites were identified, with 42 significant differences compared with the control group, among which 33 were upregulated and 9 were downregulated (Supplementary Data S1).
Differential metabolite volcano diagram
The volcanic figure shows differences in metabolites of the overall distribution of horizontal expressions of multiple changes in metabolites in different groups (log2 FC). The ordinate shows a significant difference level (-log10 p–value). Each dot on the volcanic figure represents a metabolite, and a significant increase in metabolites in the red dots and a significant decrease in metabolites in the green dots. The size of the dots represents the VIP value. It can be seen from the figure that several metabolites increase most significantly, including N(6)-methyladenosine, 4-o-(beta-l-araf)-cis-l-hyp, 2′-o-methyladenosine, n-acetylneuraminic acid (Fig. 4, Supplementary Data S1).
Volcano diagram of differential metabolites
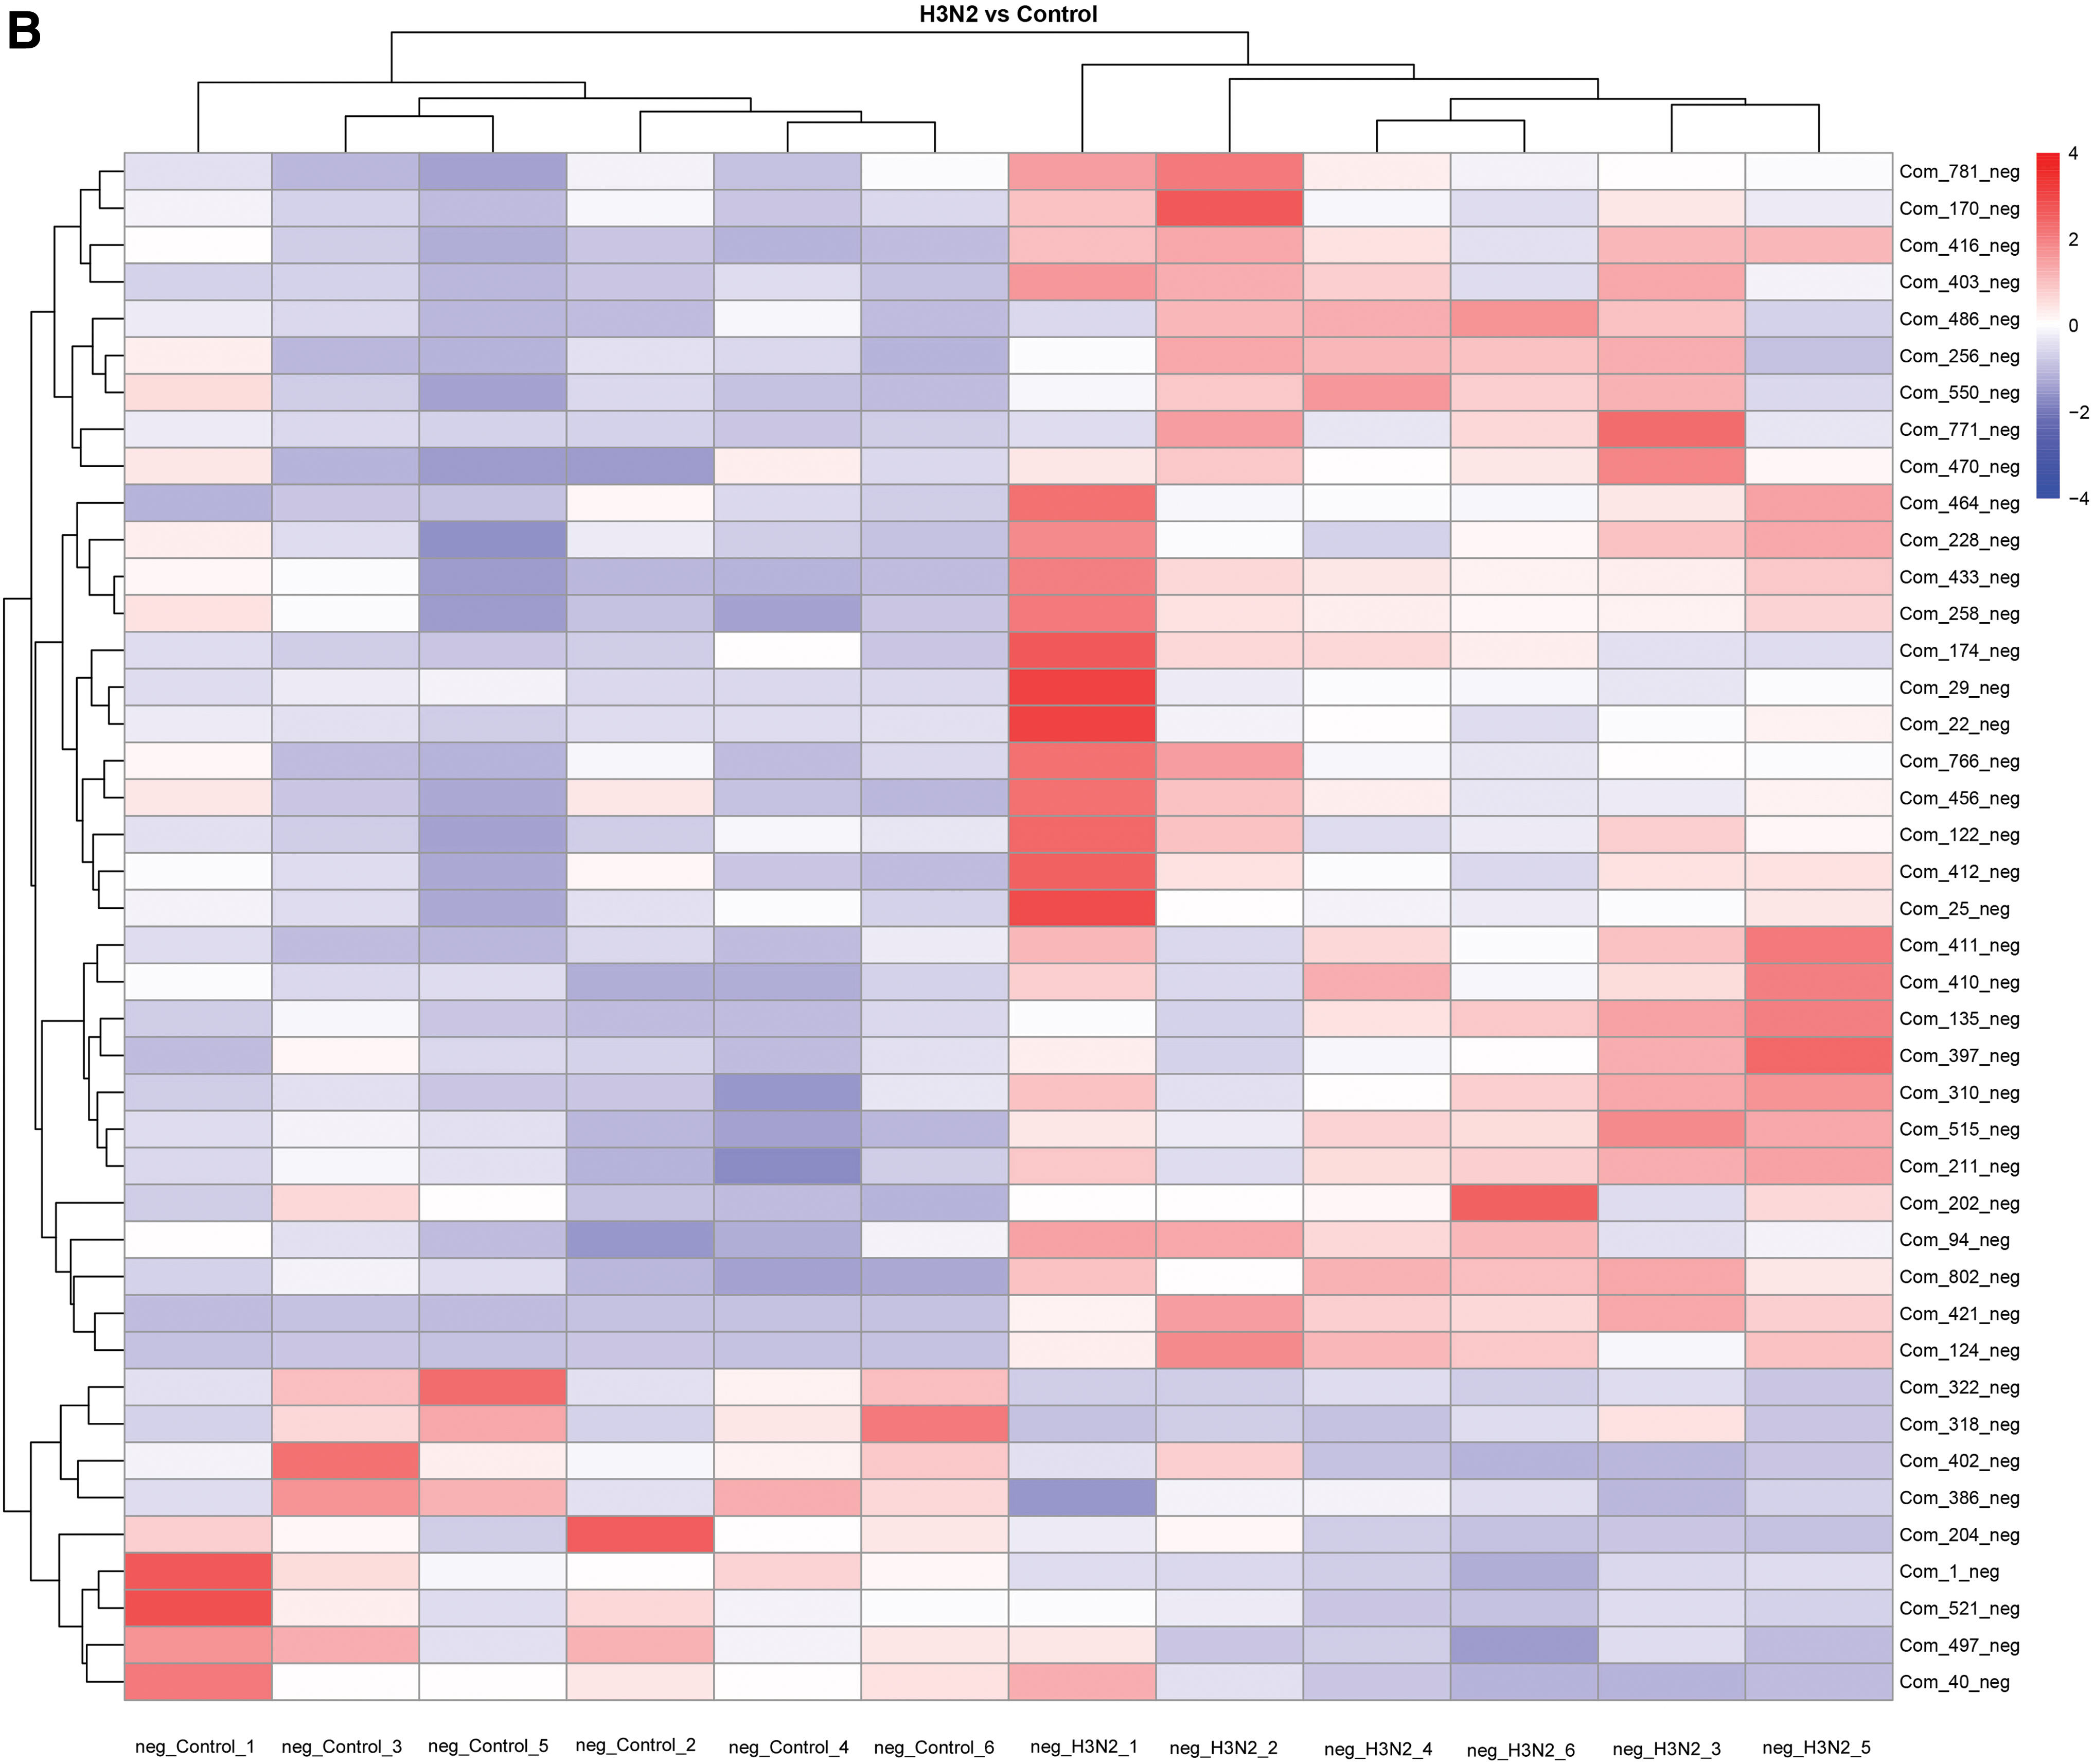
Cluster analysis of differential metabolites
Cluster analysis was used to determine metabolic patterns of metabolites under different experimental conditions. Metabolites with similar metabolic patterns may have similar functions or participate in the same metabolic process or cell pathway. Therefore, the function of some metabolites can be inferred by clustering metabolites with the same or similar metabolic patterns. Hierarchical cluster analysis was carried out on the obtained metabolites of each group, and the differences in metabolic expression patterns between and within the two groups were obtained. As can be seen from the figure, the control group and the experimental group are obviously divided into two categories, with significant differences and very high experimental repeatability (Fig. 5).
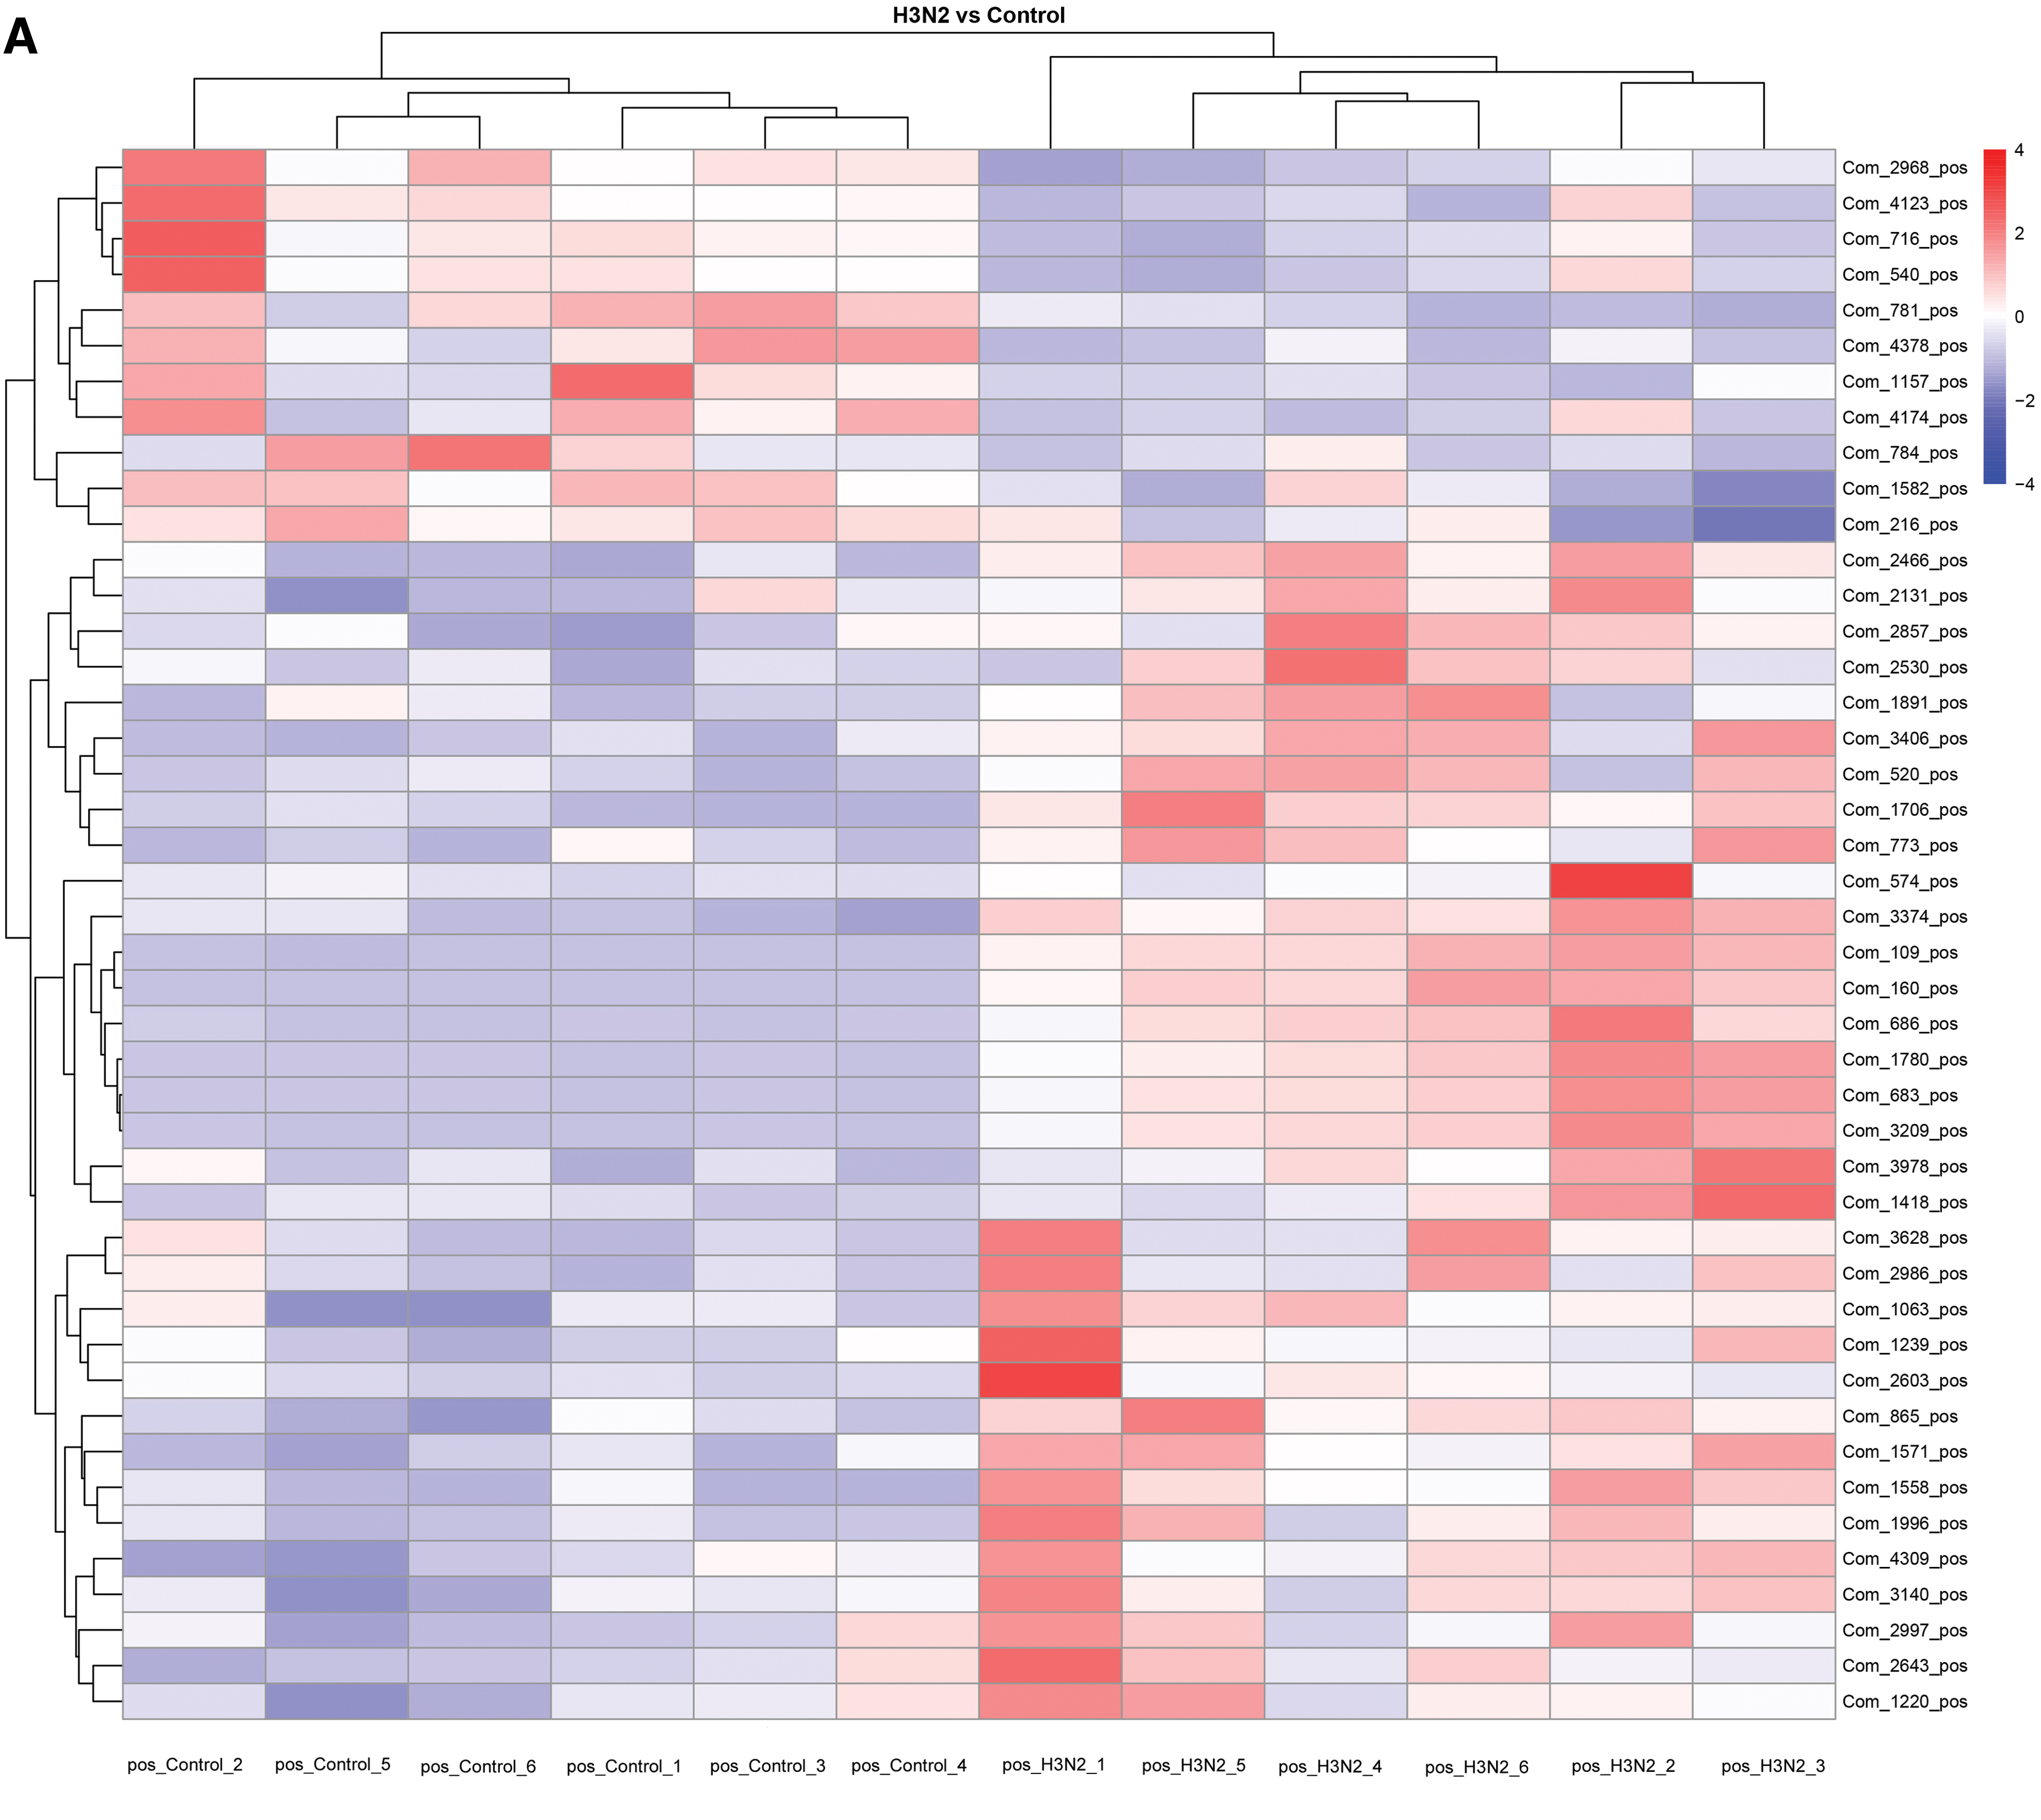
Heat diagram of differential metabolite clustering
The Corresponding Names of Metabolite Numbers
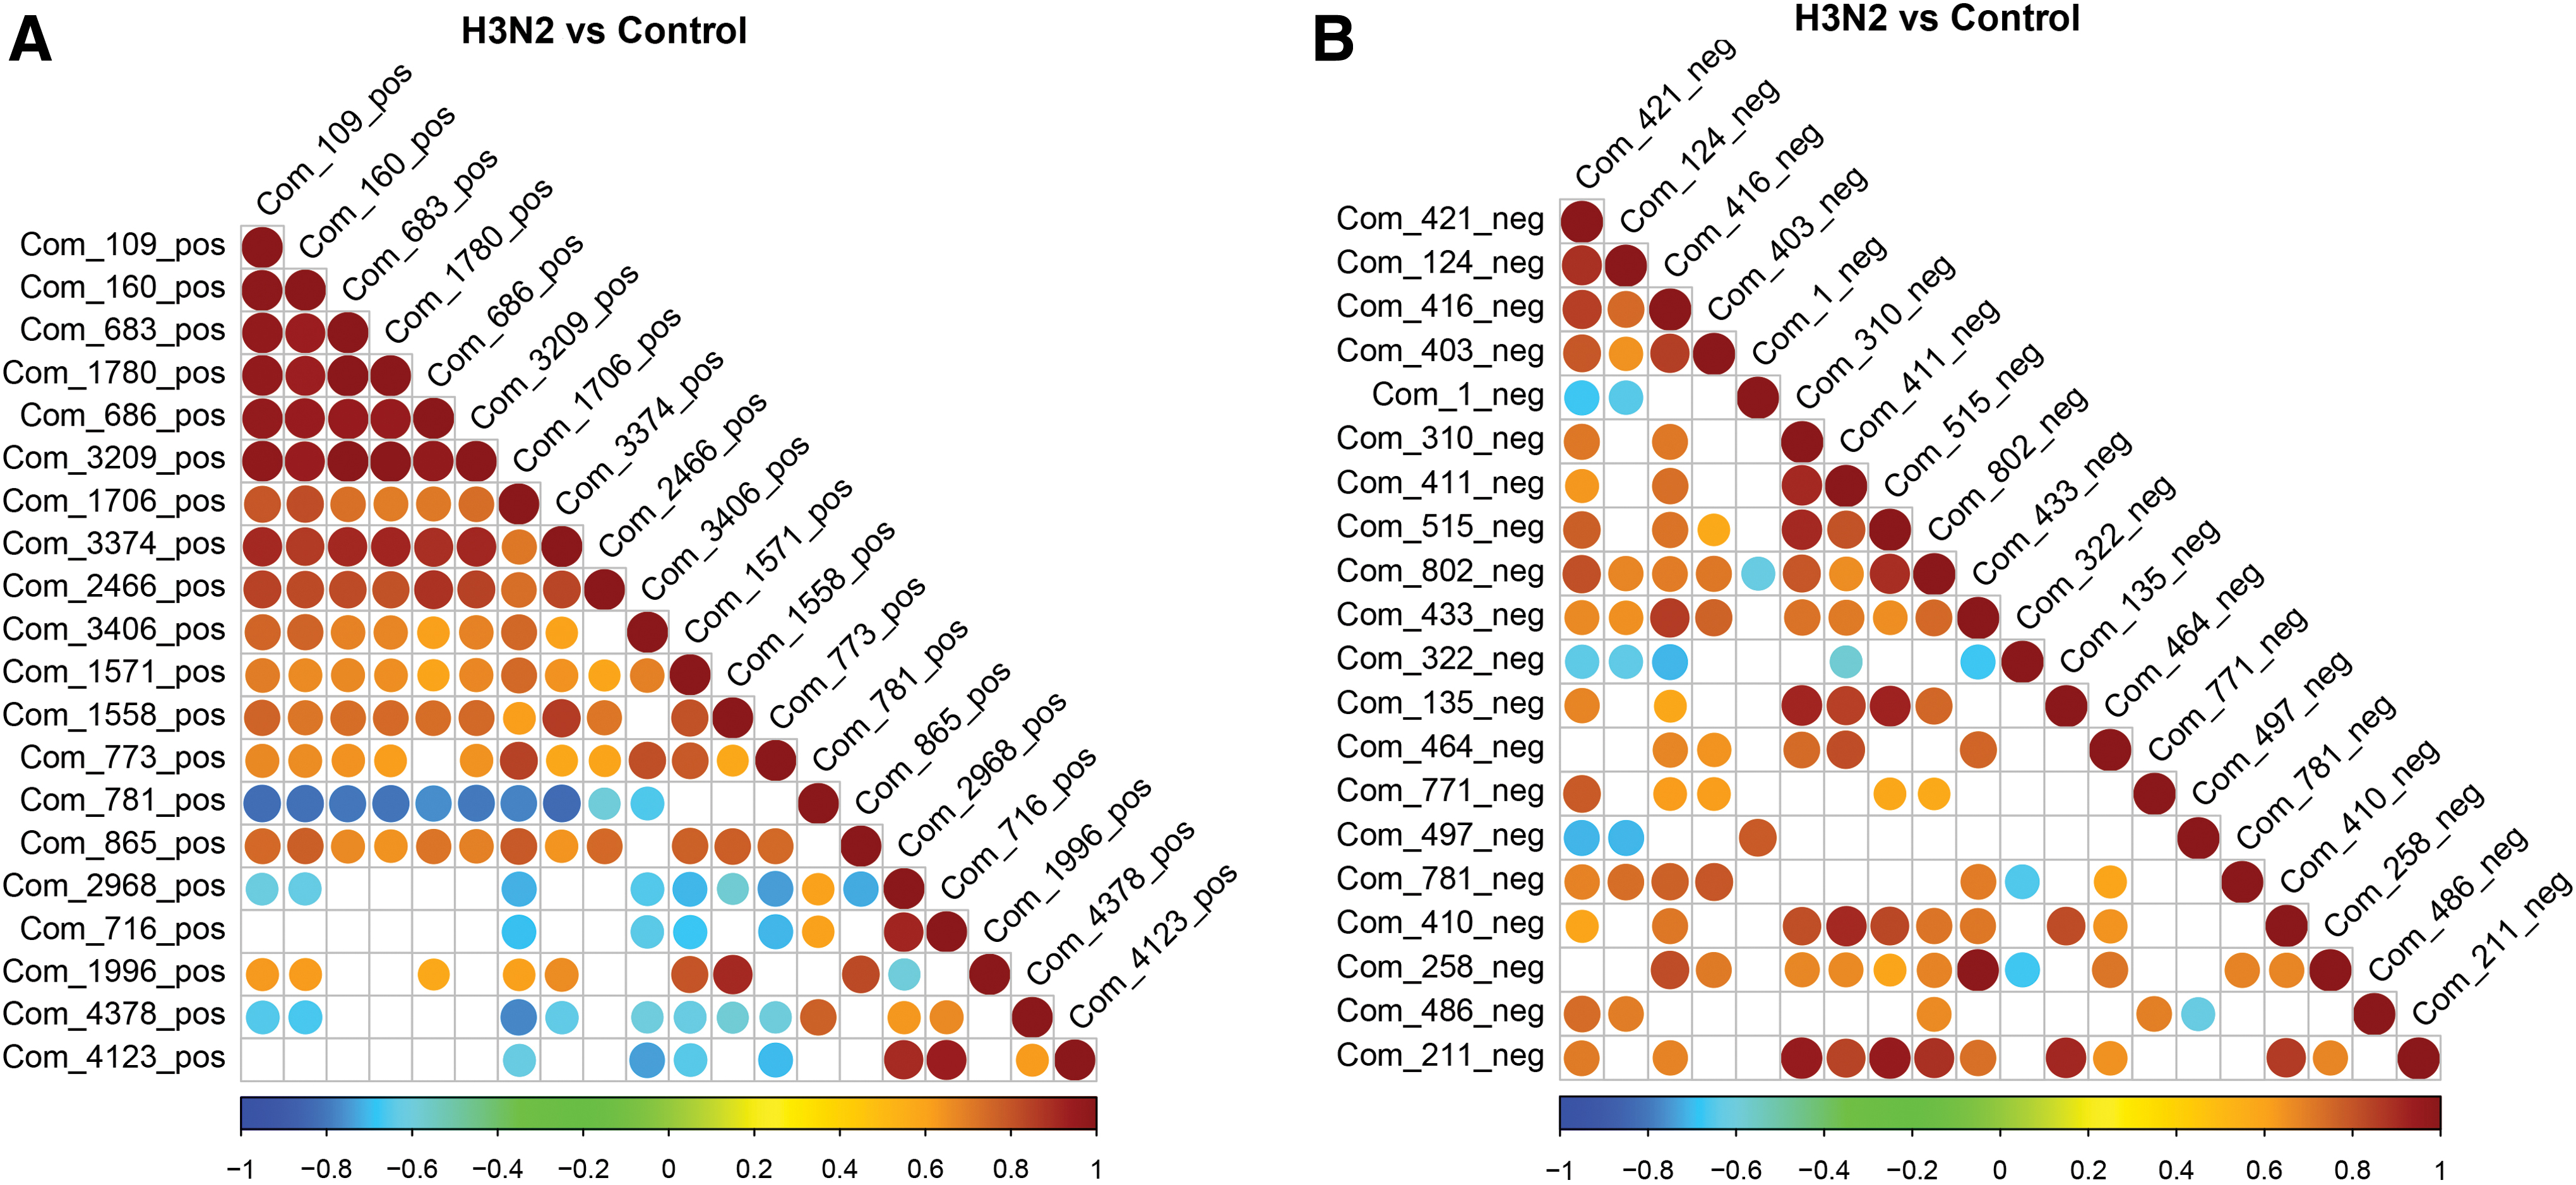
Correlation analysis of differential metabolites
There is a synergistic or mutually exclusive relationship between different metabolites. For example, if the variation trend of certain metabolites is the same, it is a positive correlation. Contrary to the change trend of some metabolites, it was negatively correlated. The purpose of differential metabolite correlation analysis is to check the consistency of metabolite and metabolite change trends and to analyze the correlation between metabolites by calculating the Pearson correlation coefficient between all metabolites.
As the linear relationship between the two metabolites increases, the positive correlation tends to 1, and the negative correlation tends to −1. In addition, the significance of correlation analysis of metabolites was statistically tested. A significance level p-value <0.05 was selected as the threshold of significance correlation. The correlation analysis of metabolites in the difference table showed that Cationic: Com_109_pos (2,3-Dehydro-2-deoxy-N-acetylneuraminic acid), Com_160_pos (8-methyl −8-azabicyclo[3.2.1]oct-3-yl (3S) −1,2-dithiolane-3-carboxylate), Com_683_pos (N(6)-methyladenosine), Com_1780_pos (4-o-(beta-l-araf)-cis-l-hyp), Com_686_pos (n-acetylneuraminic acid), Com_3209_pos ((2E)-2,3-diphenyl-3-(2-pyridinyl)acrylonitrile) have a high correlation; Anionic: Com_310_neg (batilol), Com_411_neg (25-hydroxy-cholesterol), Com_515_neg (1-hexadecanal), Com_135_neg (2-(n-tetradecyl)cyclobutanone), Com_211_neg (g-Tokoferol) is medium high correlation and Com_433_neg (2-Heptadecylfuran) with Com_258_neg (DOA) is medium high correlation, which may be related to virus replication (Fig. 6).
Correlation of differentially expressed metabolites
The Corresponding Names of Metabolite Numbers
Enrichment analysis of differential metabolite KEGG
The bubble map of the KEGG enrichment pathway was drawn according to the enrichment results (only the top 20 results were shown). The results show that different metabolites are mainly concentrated in metabolic pathways such as energy metabolism, and nucleic acid and protein synthesis. Including are hormone biosynthesis (hormones can be regulated by the metabolic activity of various tissues and cells to influence the physiological activities of the body), metabolism of amino sugars and sugar nucleotides (which can directly influence the nucleic acid and protein synthesis), metabolism of vitamin B6 (vitamin B6 group can be quickly converted into auxiliary enzymes pyridoxal phosphate and pyridoxamine phosphate, the relationship between these two kinds of enzymes and protein metabolism is very close), cysteine and methionine metabolism (methionine is one of the essential amino acids to constitute the human body, and participate in protein synthesis. Because it cannot be produced in the body itself, it must be obtained from the outside. Methionine metabolism into cysteine, maintaining their balance, is very important for protein synthesis), vitamin absorb (vitamins are a kind of regulating substances and play an important role in the metabolism), arginine and proline metabolism (arginine is an essential amino acid in the body, the main end products of metabolism are proline and ornithine, and maintaining the balance of arginine and proline is very important for protein synthesis), amino acid biosynthesis (amino acids are the basic unit of protein synthesis and very important for protein synthesis), and folic acid biosynthesis and metabolic pathways (in organisms, the synthesis of proteins, nucleotides, pantothenic acids, and the methylation of molecules all require the participation of a carbon unit. Folic acid is an extremely important cofactor that mediates the transfer of a carbon unit. Folic acid is mainly involved in the de novo synthesis of purines and pyrimidines) (Fig. 7 and Supplementary Data S2).
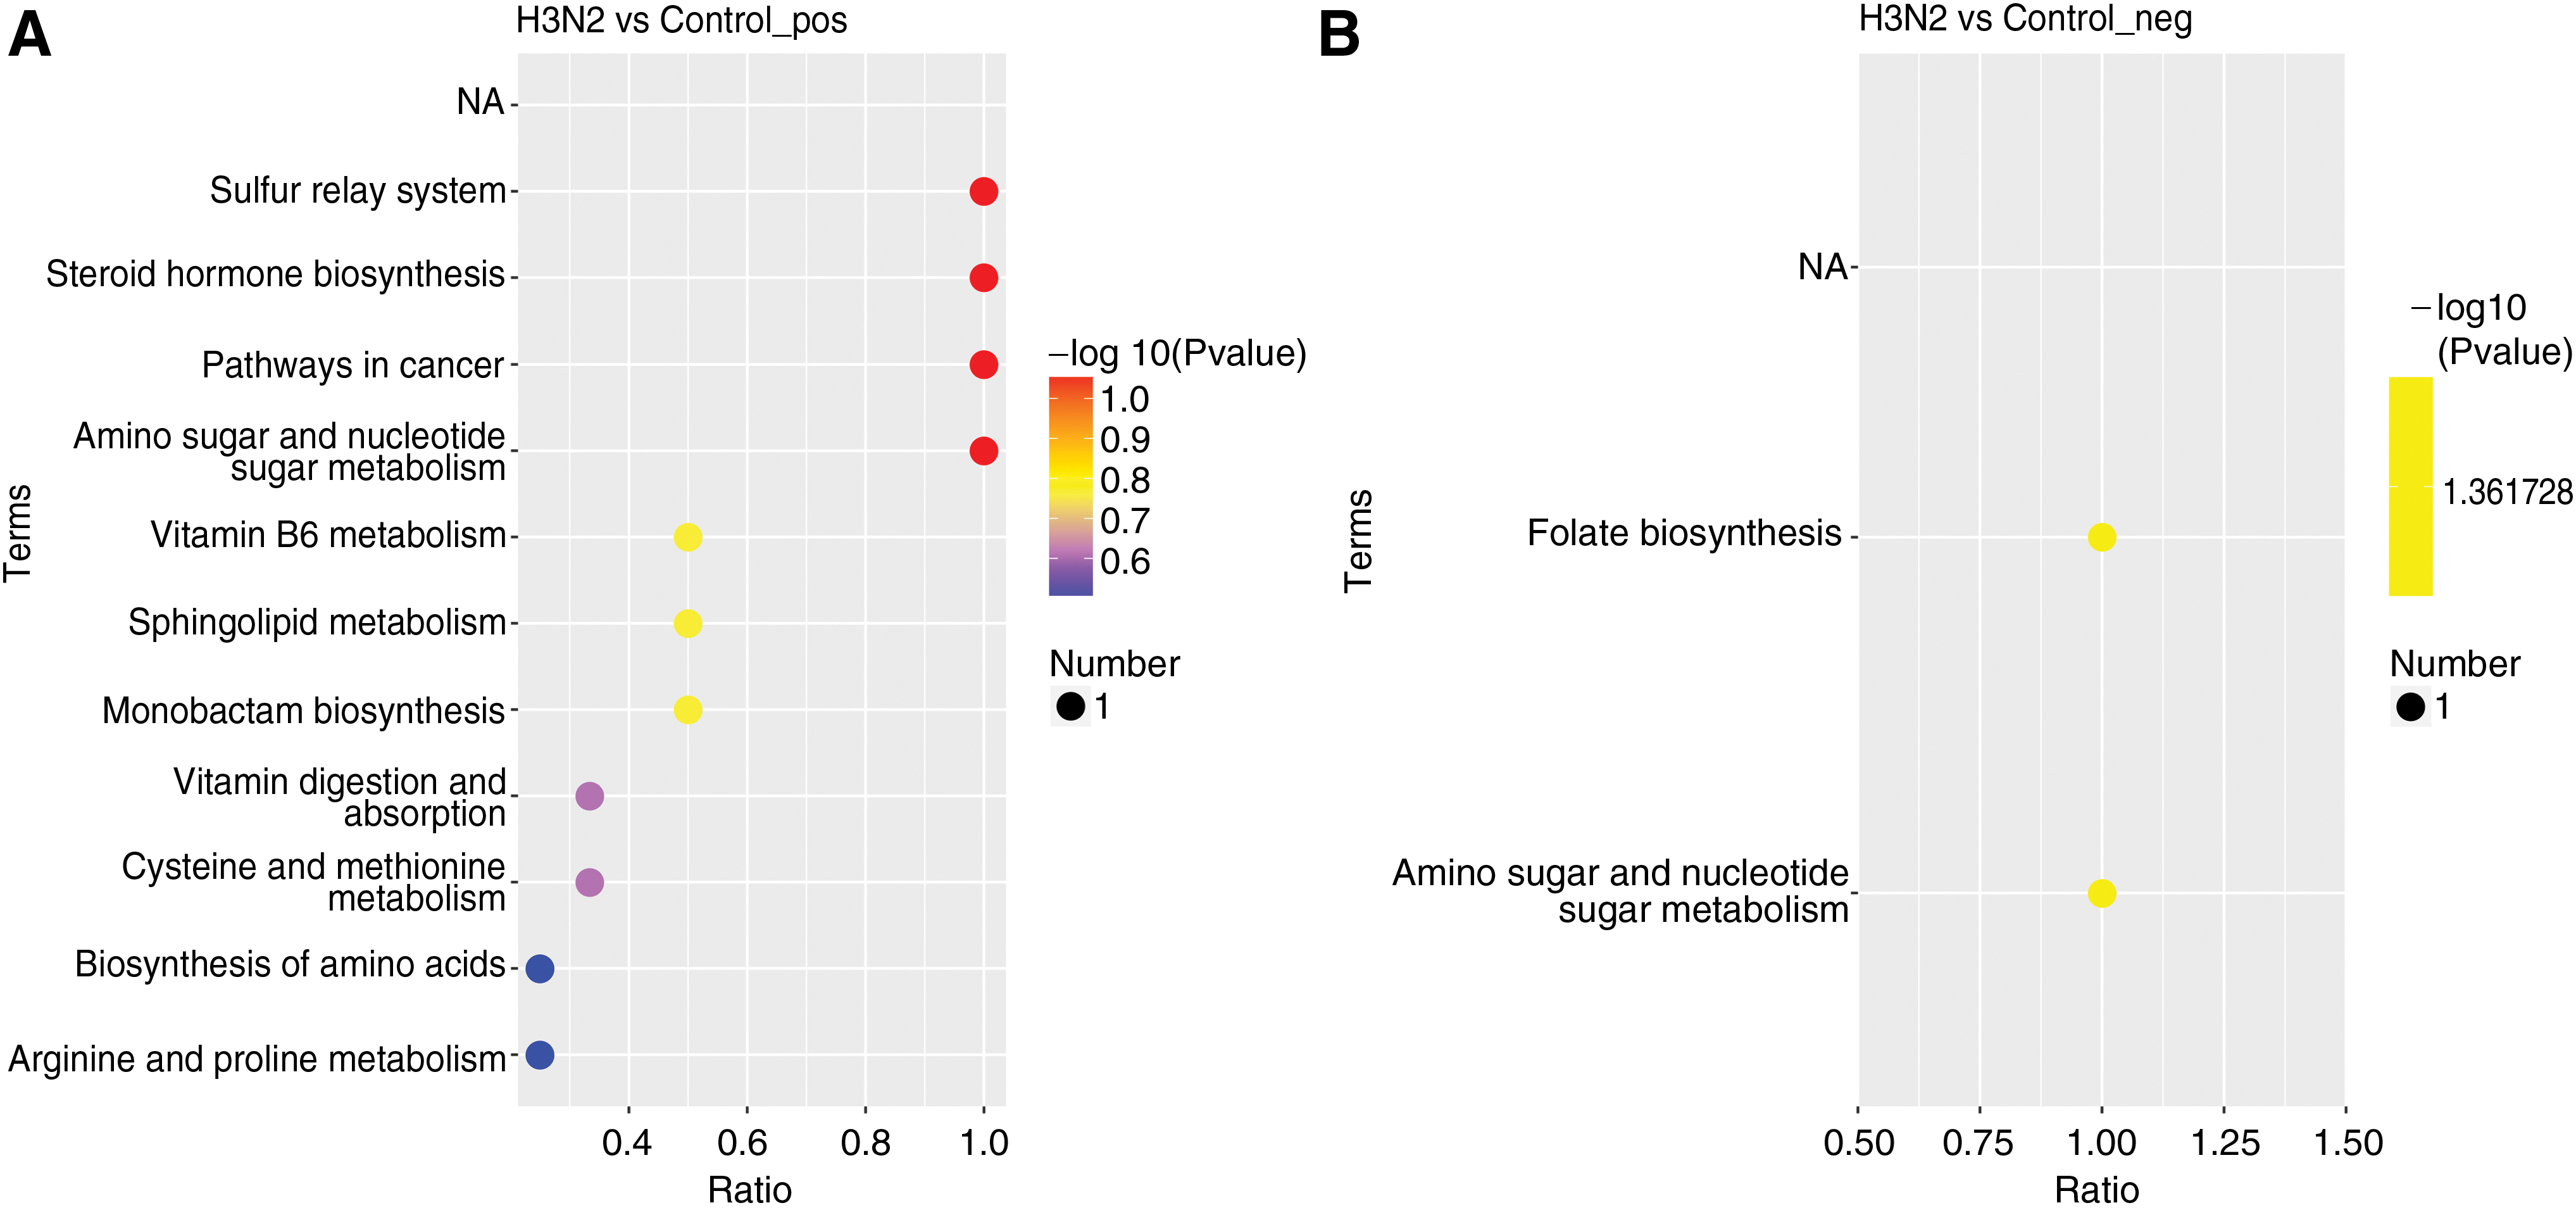
Bubble diagram of KEGG enrichment
Discussion
Material metabolism and energy metabolism are the most direct ways to affect life. Virus replication is dependent on the energy and biosynthesis precursors provided by host cell metabolism. Studying the biological processes involved in differential metabolites can more directly and accurately reflect the physiological state of an organism and reveal its biological activity mechanism.
Through untargeted metabolomics analysis, this experiment found a large number of differentially expressed metabolites, which were mainly enriched by folate (vitamin B9) biosynthesis—a coenzyme of the carbon unit transferase system in the biochemical reaction in vivo, acting as a carbon unit transporter, which is involved in the synthesis of purine and thymine, which leads to further synthesis of DNA and RNA. Folate is involved in amino acid metabolism and acts as a carbon unit carrier in the mutual conversion between glycine and serine, histidine and glutamic acid, and homocysteine and methionine (36). Steroid hormone biosynthesis—steroid hormone-induced gene activation plays a definite role in maintaining life and regulating sexual function and in organism development and immune regulation (25). Vitamin B6 metabolism—vitamin B6 serves as a cofactor for many proteins and enzymes. Vitamin B6 is essential for serine de novo biosynthesis (28,29). Sphingolipid metabolism—sphingolipids are part of the cellular structure and are important signaling molecules that are closely related to cell growth, aging, meiosis, maturation, and death (12). Amino sugar and nucleotide sugar metabolism—biosynthesis of amino acid pathways, cysteine and methionine metabolism, and arginine and proline metabolism—is essential for energy metabolism and nucleic acid and protein synthesis. Interestingly, in cancer, there are significantly upregulated molecules in this pathway.
In this experiment, through the growth curve of CIV, we found that the fastest growth period of CIV in MDCK cells was between 18 and 24 h, and the metabolite change was the largest at 24 h. Therefore, this experiment analyzed the metabolite change at 24 h when MDCK cells were infected with CIV.
In this study, MDCK cells were infected with H3N2 CIV, and changes in cell metabolism were detected. Dogs were not used because metabolomics requires consistency in sample handling, and dogs have individual differences that do not reflect the metabolic differences caused by H3N2 CIV in all dogs. However, consistency is not found in the analysis of multiple dogs. Moreover, more than 10 animal samples are required, which does not conform to animal welfare. With the continuous improvement and optimization of its methodology, metabolomics research will become a more efficient and accurate way to diagnose diseases.
Footnotes
Authors' Contributions
P.T. and P.Z. carried out the data analysis and drafted the article. W.X. prepared materials for the experiments. G.L. and S.L. conceived the study. All authors read and approved the final article.
Author Disclosure Statement
The authors declare that the research was conducted in the absence of any commercial or financial relationships that could be construed as a potential conflict of interest.
Funding Information
This work was supported by the Guangdong Provincial Natural Science Foundation under Grant (Number 2017A030310367).
Supplementary Material
Supplementary Data S1
Supplementary Data S2
References
Supplementary Material
Please find the following supplemental material available below.
For Open Access articles published under a Creative Commons License, all supplemental material carries the same license as the article it is associated with.
For non-Open Access articles published, all supplemental material carries a non-exclusive license, and permission requests for re-use of supplemental material or any part of supplemental material shall be sent directly to the copyright owner as specified in the copyright notice associated with the article.