
Abstract
Abstract
The Cannabis sativa plant contains numerous phytocannabinoids and terpenes with known or potential biological activity. For decades, plant breeders have been breeding the Cannabis plant to control for a desired ratio of the major cannabinoids. A high-throughput in vivo model to understand the relationship between the chemical composition of different strains and their therapeutic potential then becomes of value. Measuring changes in the behavioral patterns of zebrafish larvae is an established model with which to test the biological activity of neuroactive compounds. However, there is currently little information regarding the uptake kinetics and metabolism of compounds by larvae. In this study, we chose to compare the uptake kinetics and metabolism of Δ9-tetrahydrocannabinol (THC) and cannabidiol (CBD) alone or in combination with their effects on larval behavior. We have shown that both compounds have distinct behavioral patterns and concentration response profiles. Additionally, the uptake kinetics observed for each compound appears to correlate with the change in behavior observed in the behavioral assays. When combinations of THC and CBD were tested there were shifts in both the behavioral activity and the uptake kinetics of each compound compared with when they were tested alone. Finally, the THC/CBD-derived metabolites detected in the larvae are similar to those found in mammalian systems. This study thus provides a model for further testing of additional cannabinoids and potentially plant extracts.
Introduction
W
As the ratios of various phytocannabinoids and other compounds varies between strains and more specifically in therapeutic preparations/extracts, a high-throughput in vivo model that can test the effects of the various cannabinoids alone, in combination, and as part of a complex mixture then becomes valuable for the assessment, of which combinations may have the best therapeutic potential.
Zebrafish, particularly their larvae, represent a model with both high-throughput potential and validated disease models that can be used to test the efficacy of neuroactive compounds. 7 While the initial toxicity testing of THC using zebrafish larvae was conducted in 1975, 8 to date, there have been only a limited number of studies to use zebrafish as a model for testing cannabinoids. All of the major endocannabinoid-related genes are known to be expressed in zebrafish larvae. 9 Both cannabinoid receptor 1 (CB-1) and cannabinoid receptor 2 are present in zebrafish and can bind THC.9–11 Larvae begin to express CB-1 by 24 hours postfertilization (hpf) and show a widespread expression pattern in the central nervous system (preoptic area, telencephalon, hypothalamus, tegmentum, and anterior hindbrain) by 48 hpf.9,10 While CBD has a low affinity for CB receptors and has been shown to exert its effects through interactions with other receptors, such as the adenosine and serotonin (5-HT) receptors,12,13 it too has been shown to have bioactivity in zebrafish.14–16 Studies using adult zebrafish have tested the activity of THC17–19 and CBD15,16 for various indications. The studies that have used zebrafish larvae have been more limited and have looked at toxicity,8,20 the behavioral effect of THC, 21 and recently the activity of THC and CBD against a model of nociception. 14
In addition to the high-throughput potential of zebrafish larvae, another important advantage of using larvae is the ever-increasing array of disease models that are available for testing potential therapeutics. These include models of pain, neurohyperactivity, seizures, bipolar disorder, anxiety/stress, and addiction.14,22–27
In the current study, we have shown distinct effects of acute exposure to THC and CBD on the behavior of larvae using a previously developed multimodal behavioral test. 14 The model tests both the basal activity patterns of larvae in a lit environment along with their response to a shift to a dark environment, which is purported to represent an anxiogenic stimulus. 22 We have also shown that at subphenotypic levels, CBD can shift the behavioral response profile of THC to a pattern found at higher concentrations. To assess the underpinnings of these effects we also tested the uptake and metabolism of both cannabinoids by the larvae. The results have shown that coexposure with CBD can affect the uptake and metabolism of THC. This work provides insight into not only the biological activity and interaction of THC and CBD, but it also provides a relevant and promising model with which to study the interactions of additional cannabinoids, complex mixtures of cannabinoids, such as plant extracts, and other naturally derived compounds.
Materials and Methods
Chemicals
THC (Cat. #T-005) and CBD (Cat. #C-045) standards in methanol (both 1 mg/mL) were obtained from Sigma-Aldrich (St. Louis, MO) as well as reserpine (Cat. #R0875). Methanol used in extractions was distilled in glass grade (Cat# 6701-2; Caledon Laboratories Ltd., Georgetown, ON, Canada). In liquid chromatography-high resolution mass spectrometry (LC-HRMS), the mobile phases were prepared with deionized water obtained from Millipore, high-performance liquid chromatography-grade acetonitrile (Cat# A996SK4; Fisher Chemical) and liquid chromatography–mass spectrometry-grade formic acid (Cat # A11750; Fisher Chemical).
Larval zebrafish rearing
All zebrafish larvae used were obtained from breeding of wild-type AB/Tub hybrids. Age-matched embryos were sorted for fertilization and stored in Pentair Aquatic Ecosystem nursery baskets (maximum 200 embryos per basket) residing in a 3-L tank in a ZebTec Recirculation Water Treatment System (Tecniplast). The water temperature was maintained at 28.5 ± 0.5°C and the room housing the tank was kept on a 14-h day–10-h night light cycle. All adult zebrafish husbandry and breeding was in accordance with the Canadian Council of Animal Care guidelines.
Larval zebrafish behavioral assay
At 120 hpf, larval zebrafish were transferred to a 96-well polystyrene microtiter plate with one larvae transferred to each well in 270 μL of HE3 media (5 mM NaCl, 0.17 mM KCl, 0.33 mM CaCl2-2H2O, 0.33 mM MgSO4-7H2O, 10 mM HEPES, pH 7.2) using a micropipette. Larvae were allowed to acclimate to the plate for at least 2 h in a lighted 28.5°C incubator (photon flux: 3–5 μmol s−1 m2).
For each experimental replicate 30 μL of a 10 × solution of test compound(s) was pipetted into each well using an electronic repeat pipette starting with the lowest concentration of the test compounds and finishing with the highest concentration. For each experimental replicate 12 wells were tested with the same concentration of test compound(s). After addition of all test compounds the plate was immediately placed into a Zebrabox (Viewpoint, Inc., Montreal, Canada) and the behavioral assay started. Total elapsed time between start of test compound addition and starting the behavioral assay was kept to 3–4 min. The temperature was maintained at 29°C within the Zebrabox for the duration of the assay.
All behavioral assays consisted of a basal activity measurement for 2.5 h with an approximate irradiance of 10 μmol s−1 m2 followed by a series of three 5-min dark periods separated by a 5-min period of light (also 10 μmol μmol s−1 m2). Following the experiment, larval phenotypes were assayed visually to verify that no lethal endpoints were reached during the assay. Any dead or affected larvae were removed from the analysis. The activity level was assessed by measuring the total distance traveled of each larvae within 60 s bins using the ZebraLab Behavioral Tracking Software (Viewpoint, Inc.). At least three experimental replicates were done for every concentration of test compound assayed.
In the behavioral analysis, every embryo was considered as an independent measurement, so n ≥ 48 for every concentration of test compound/mixture tested. Statistical significance for each 60 s time bin was determined by two-way repeated measures analysis of variance using the GraphPad Prism 7.04 software (La Jolla, CA) followed by a Bonferroni post-hoc test (p < 0.05). For the analysis of the dark response, the increase in activity for the entire 5 min following the light to dark transition was assessed by subtracting the total distance traveled for the 5 min immediately preceding the transition from the distance traveled during the 5 min following the transition.
Molecular uptake assay
To control for test compound molecules to embryo ratios, uptake assays were performed with the same ratio of embryo:exposure medium (one embryo per 300 μL media). For each time point of a molecular uptake experiment, 20 age-matched 120 hpf larvae were collected into a 74 mm Netwell (Corning) immersed in HE3 media and 6 mL of HE3 media was added to a well in a six-well polystyrene culture plate. The Netwell was removed from the storage media, blotted quickly on a Kimwipe, and using a clean transfer pipette embryos from the Netwell were washed into the well of the six-well plate using the media contained within the well.
Approximately 5 min before commencing, an uptake assay of a 100 × stock solution of the test compound(s) was made in HE3 media containing 10% (v/v) methanol. In coadministration experiments, the methanol concentration was held at 10% (v/v). The exposures were initiated by adding 60 μL of this 100 × stock solution to each well giving a final 0.1% (v/v) methanol concentration. Exposures were stopped by quickly transferring the larvae to a clean Netwell using a transfer pipette and washing five times in carrier media (HE3 with 0.1% methanol). Each wash step consisted of immersing the Netwell in 4 mL of fresh ice-cold carrier media followed by immediate removal and blotting on a clean Kimwipe. After the final wash step, the Netwell was immersed in 4 mL of ice-cold water. The 20 larvae were transferred to a 2-mL amber LC vial in a minimal amount of water and immediately flash frozen on dry ice and stored at −80°C until later processing. One milliliter of exposure media was also removed at each studied time point after larval washing and immediately flash frozen in an amber glass 2-mL LC vial. For the time 0 exposure sample, the larvae were washed and flash frozen immediately after addition of the test compound.
A “no larvae” parallel control experiment was also performed as described above with no larvae added to the 6 mL of media and media samples removed at the same time points as those done in the larval uptake experiments.
Extraction of larval and media samples and liquid chromatography-high resolution mass spectrometry (LC-HRMS) assay
Frozen larvae and media samples were lyophilized directly in the LC vial. All samples were extracted by adding 1 mL of methanol containing 1 μg/mL reserpine as an internal control. All samples were placed in a sonicating water bath for 30–45 min to disrupt tissue and the resultant extraction was filtered in a 0.2 μM polytetrafluoroethylene filter vial (Thomson Instrument Company, CA) to remove undissolved lysate and precipitated salts.
Liquid chromatography-high resolution mass spectrometry (LC-HRMS) analysis
Liquid chromatography-high resolution mass spectrometry (LC-HRMS) was performed on an Accela 1250 LC coupled to an Exactive™ mass spectrometer (Thermo Fisher Scientific, Waltham, MA), equipped with HESI-II probe for electrospray ionization. CBD, THC, and their metabolites were separated on a Waters HSS-T3 column (2.1 × 100 mm, 1.8 μm) using a mobile phase of (A) 0.1% formic acid in water and (B) 0.1% formic acid in acetonitrile. Analytes were eluted with a linear gradient of 5% B to 100% B in 4 min, held for 3.3 min, before returning to 5% B. The LC flow rate was kept at 400 μL/min while the column temperature was set at 30°C. Optimized MS parameters, including a sheath gas flow rate of 50, auxiliary gas flow rate of 10, spray voltage of 3 kV, capillary temperature of 360°C and heater temperature of 350°C, were used. Positive polarity scans were acquired at 4 Hz (25,000 instrument resolution), with mass range scanned from m/z 90 to 800. Data acquisition was carried out using Xcalibur 2.2 (Thermo Fisher Scientific). THC and CBD mass standards (the same as those used in the biological assays) were diluted in methanol extracts from untreated age-matched larvae. These were analyzed along with the molecular uptake samples and used to create standard curves for the determination of cannabinoid concentrations in the larval and media methanol extracts.
Results
Behavioral response to cannabinoid exposure
Zebrafish larvae show innate, reproducible activity patterns in both light and dark environments that have previously been used to assess the effects of neuroactive compounds.23,28–30 In this study, we used a previously validated, multimodal behavioral assay to test the acute effect of the two main phytocannabinoids found in Cannabis, THC, and CBD. 14 This assay measures larval activity in a lit environment, followed by a measure of the larval response following a light to dark transition. When larvae are exposed to a light to dark transition, they show a stereotyped avoidance response (scototaxis) consisting of an increase in activity. 29 This model thus allows for the assessment of the effects of each compound on baseline activity and on a standard stimulus response.
Δ 9 -Tetrahydrocannabinol
The initial effect of acute exposure to low concentrations of THC was a decrease in activity, as measured by distance traveled, across the entire 3-h behavioral testing period, which began to become significant at 0.05 μM (Fig. 1). At 0.5 μM a small peak in activity during the first 10 min became evident (Fig. 1C). Following the initial 10 min, the activity plateaued at a level below that of controls for the remainder of the 3-h run. As the concentration was increased, the activity pattern became slightly more complex. At 1.5 μM there was an initial peak in activity that was followed by what appeared to be two plateaus in activity with the second plateau leveling out after the first 60 min (Fig. 1B). At 2 μM the initial elevation in activity reached a peak value higher than that of controls during the first 30 minutes; however, the activity returned to a plateau level below that of controls before the end of the 2.5-h light period (Fig. 1A).
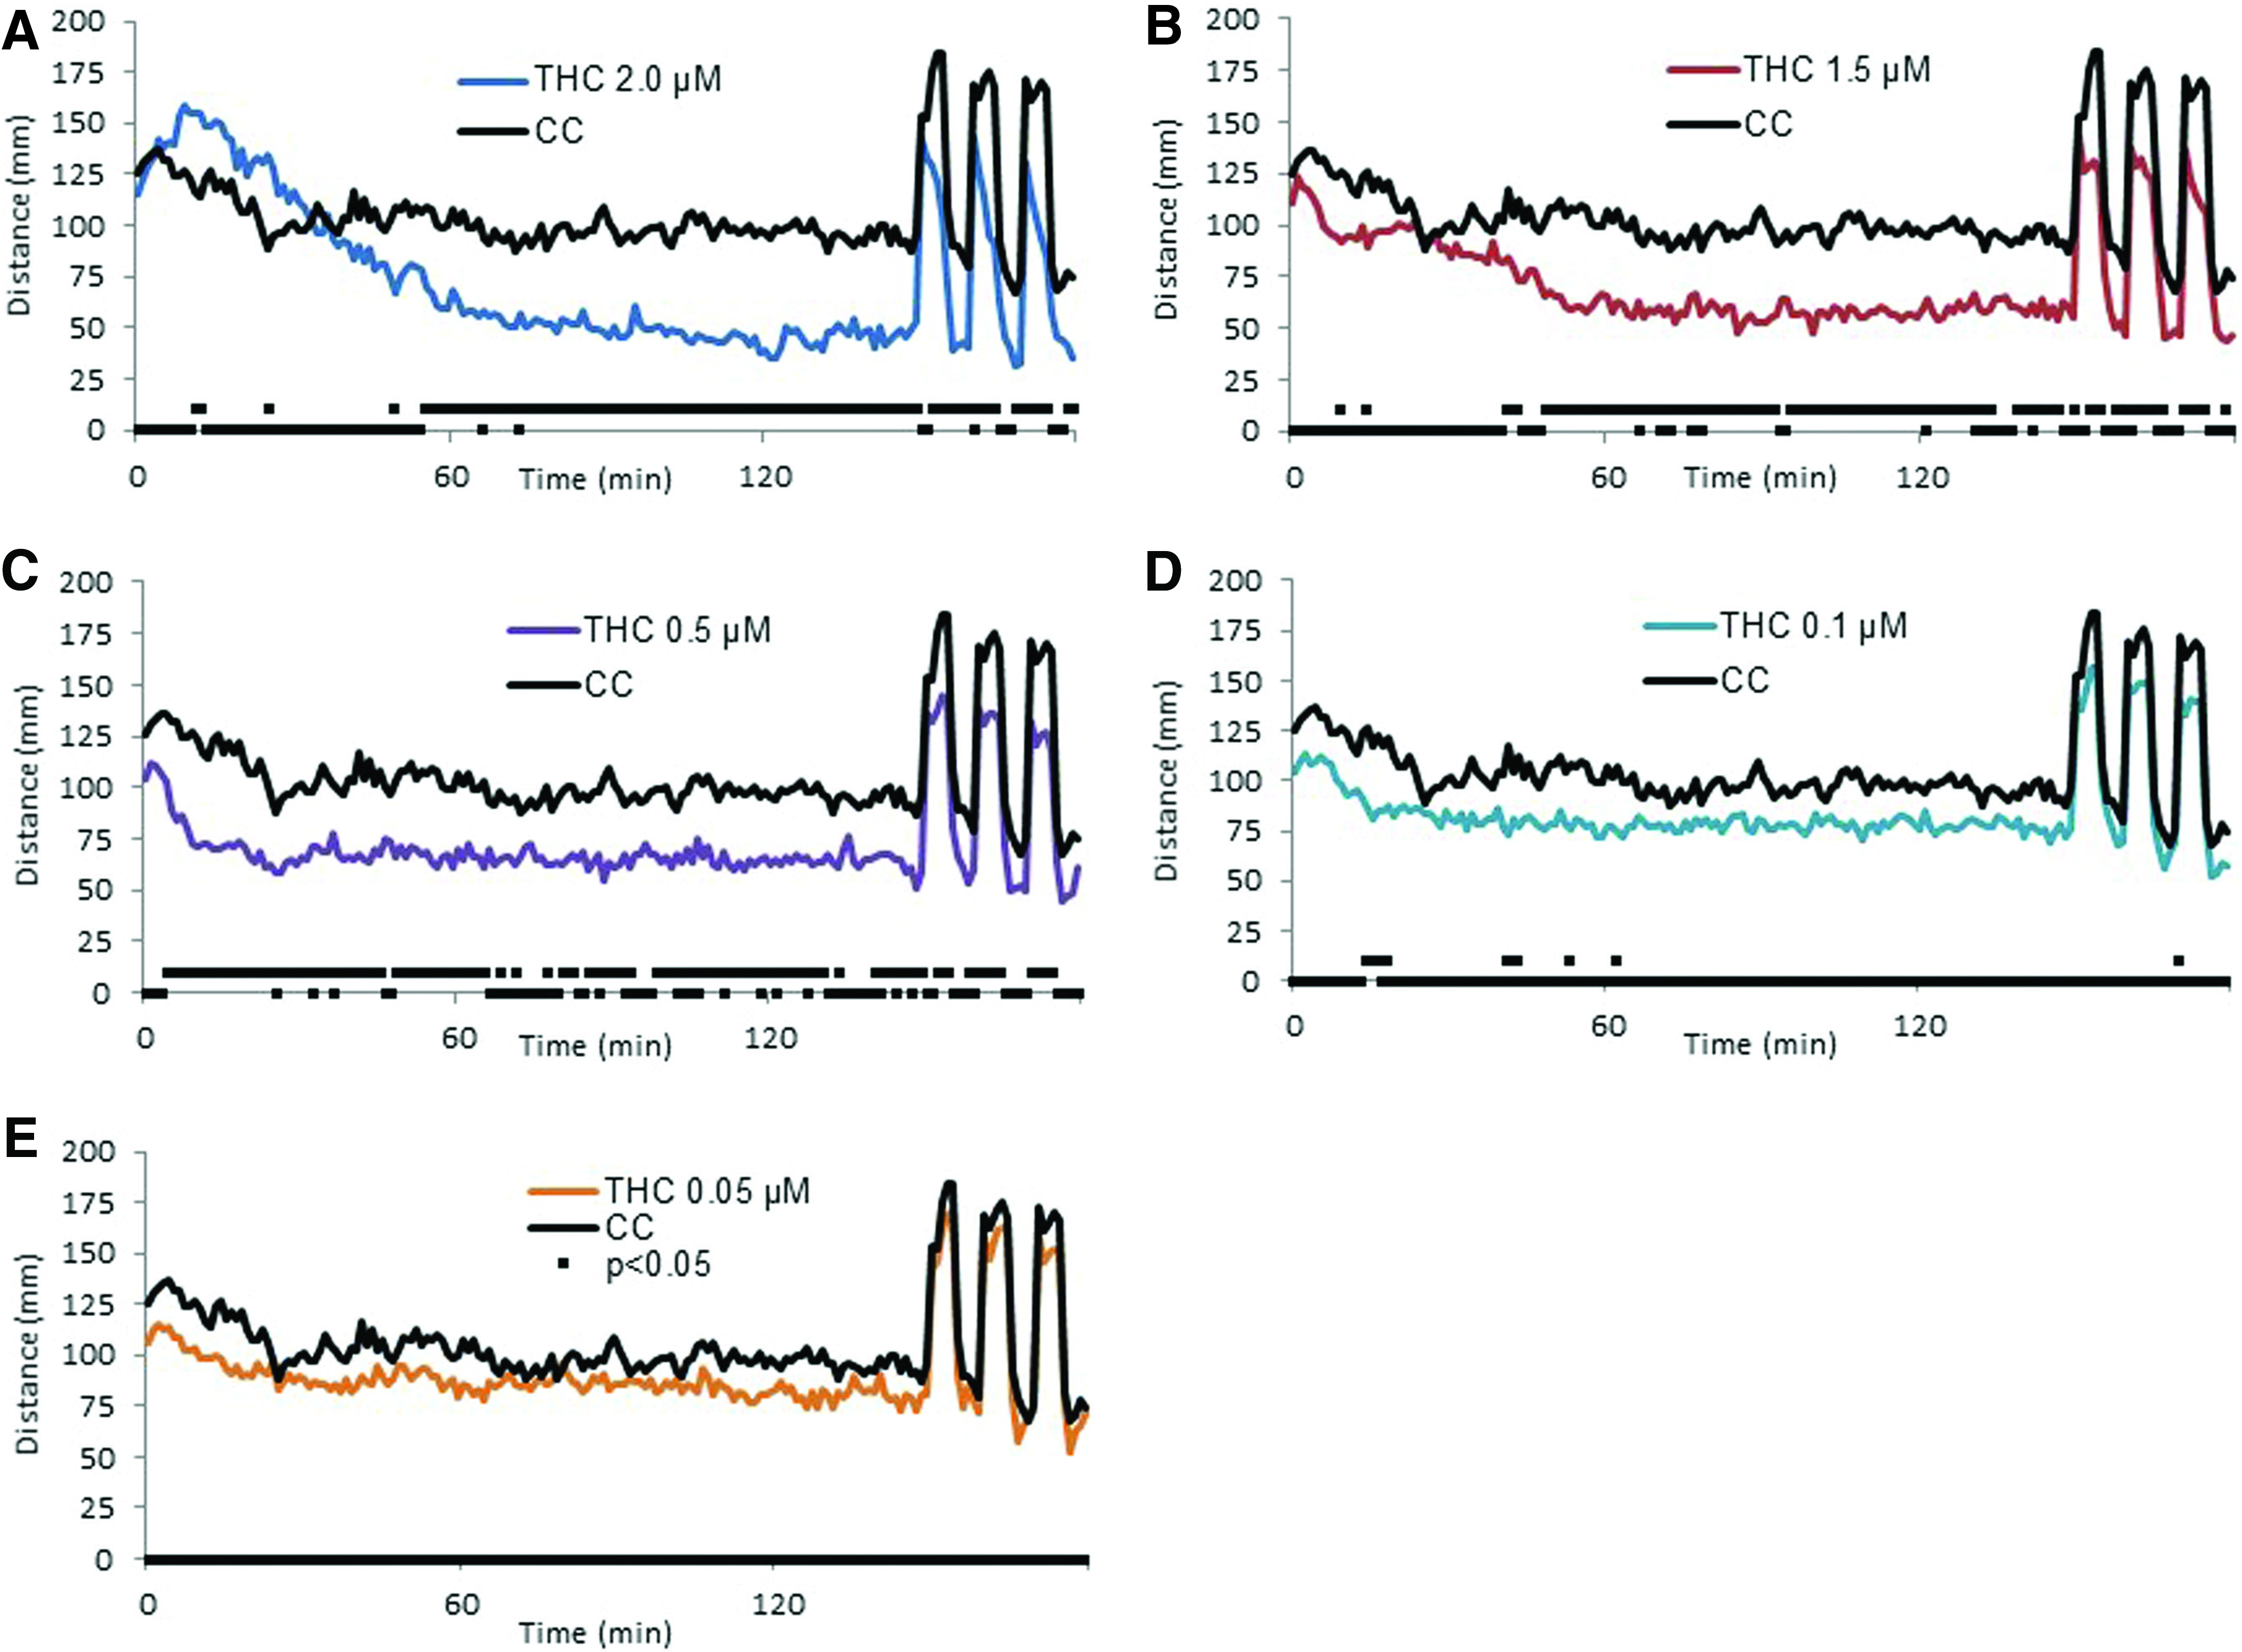
Behavioral response following acute exposure to THC. Larval activity pattern as measured by average distance traveled (60 s time bins) immediately after introduction of 2.0 μM (
Similar to the decrease in activity during the first 2.5 h under the lighted conditions, the absolute peak activity level following the light to dark transitions was lower in THC-treated larvae than that of the controls. However, when the size of the change was normalized to the activity level during the 5 min preceding the transition, there was not a significant difference from that of controls at any of the concentrations tested (Fig. 2).
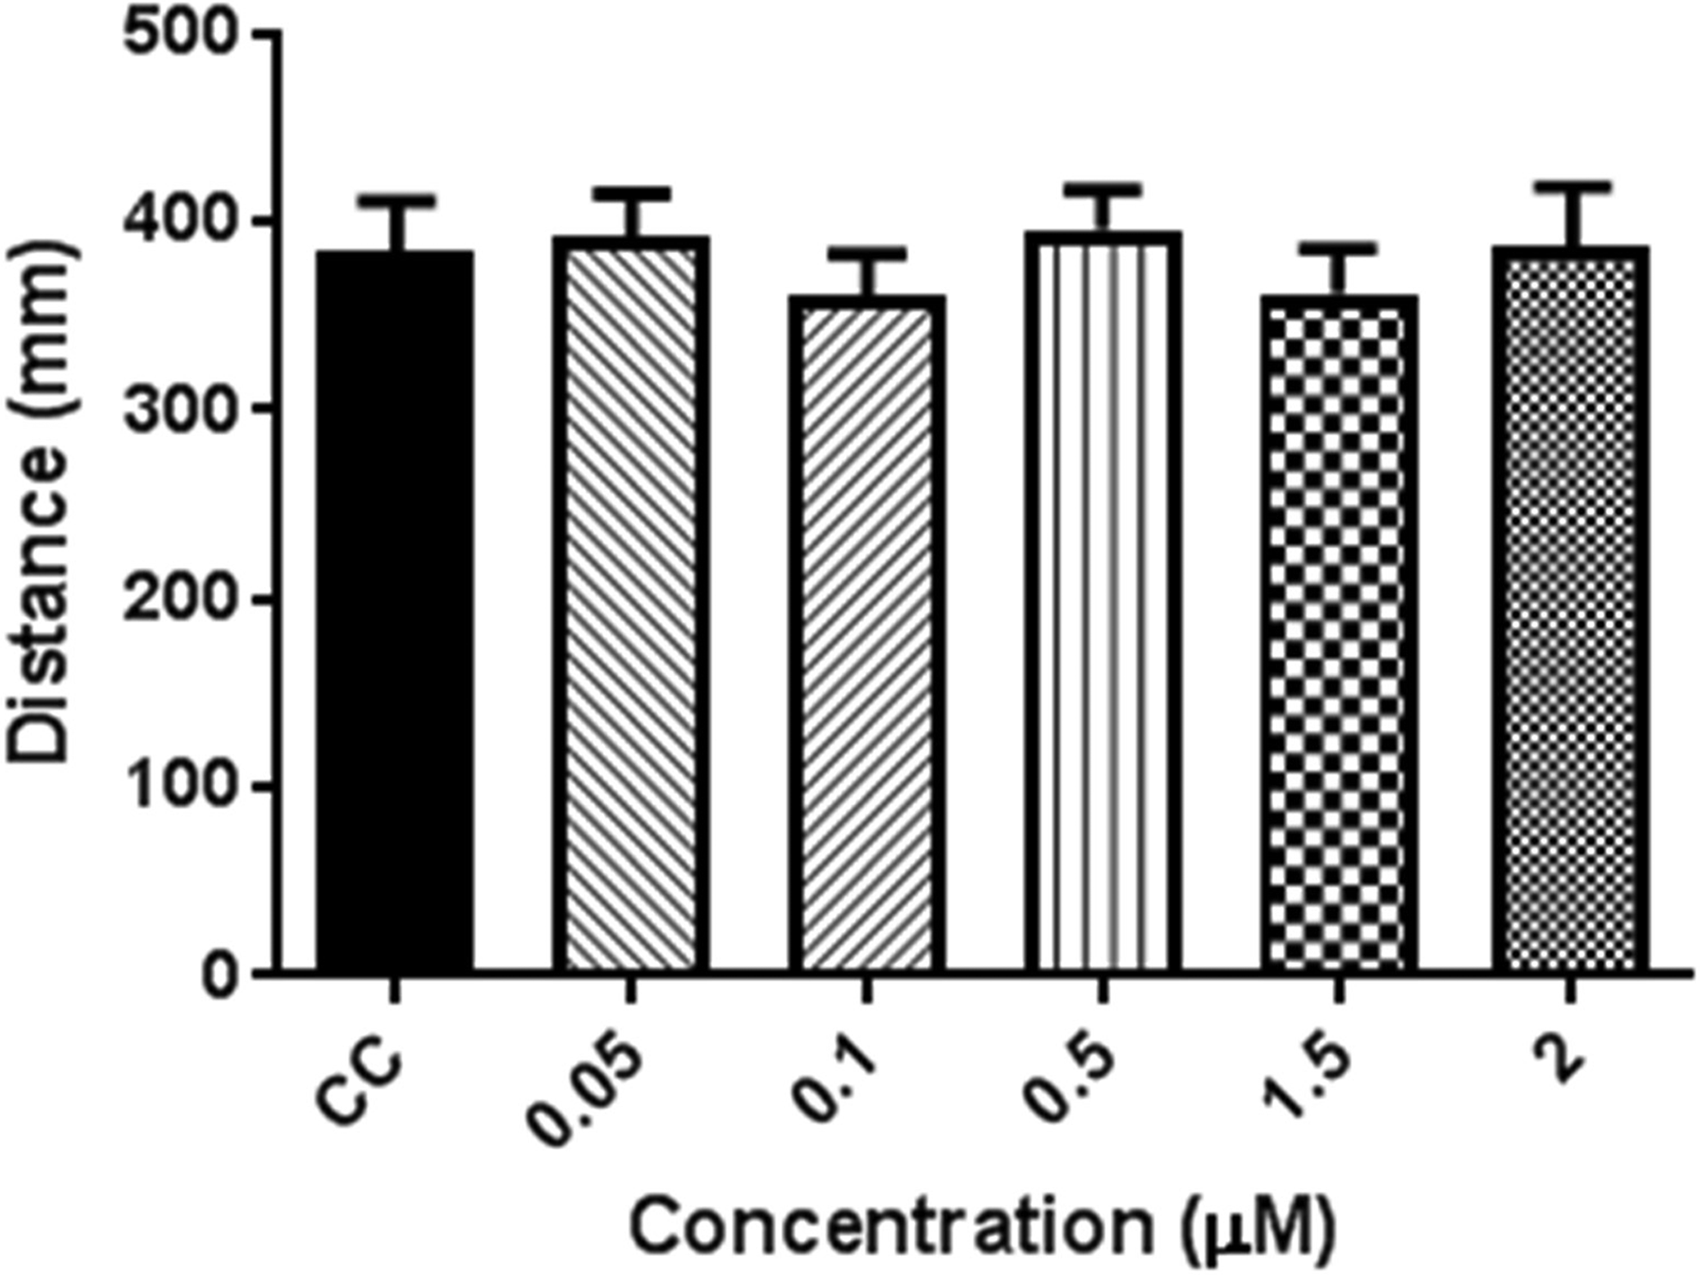
Light to dark transition for THC dilution series. Total activity for the first 5 min dark transition normalized to the previous 5 min in the light. Data are expressed as mean ± SEM. No significant difference from controls was observed. Dunnett's t-test (p < 0.05). n = 60 for all THC concentrations tested, except 0.05 μM THC and carrier control, where n = 48. SEM, standard error of the mean.
Cannabidiol
Unlike THC, the initial change in activity produced by CBD was an increase in activity above control levels during the first 30 min beginning at 1 μM CBD and becoming significant at 1.75 μM (Fig. 3D). This early hyperactivity reached higher levels and was prolonged at 2.5 μM. At 3.75 μM the hyperactivity peaked earlier and the activity level returned to control levels quicker than at 2.5 μM (Fig. 3). At all of the concentrations tested, the activity level returned to one not significantly different than controls within the first 60 min of testing. Interestingly, the light to dark transition response differed from controls beginning at 1.75 μM (Fig. 3C) and was reduced to a level <10% of controls by 3.75 μM (Fig. 4).
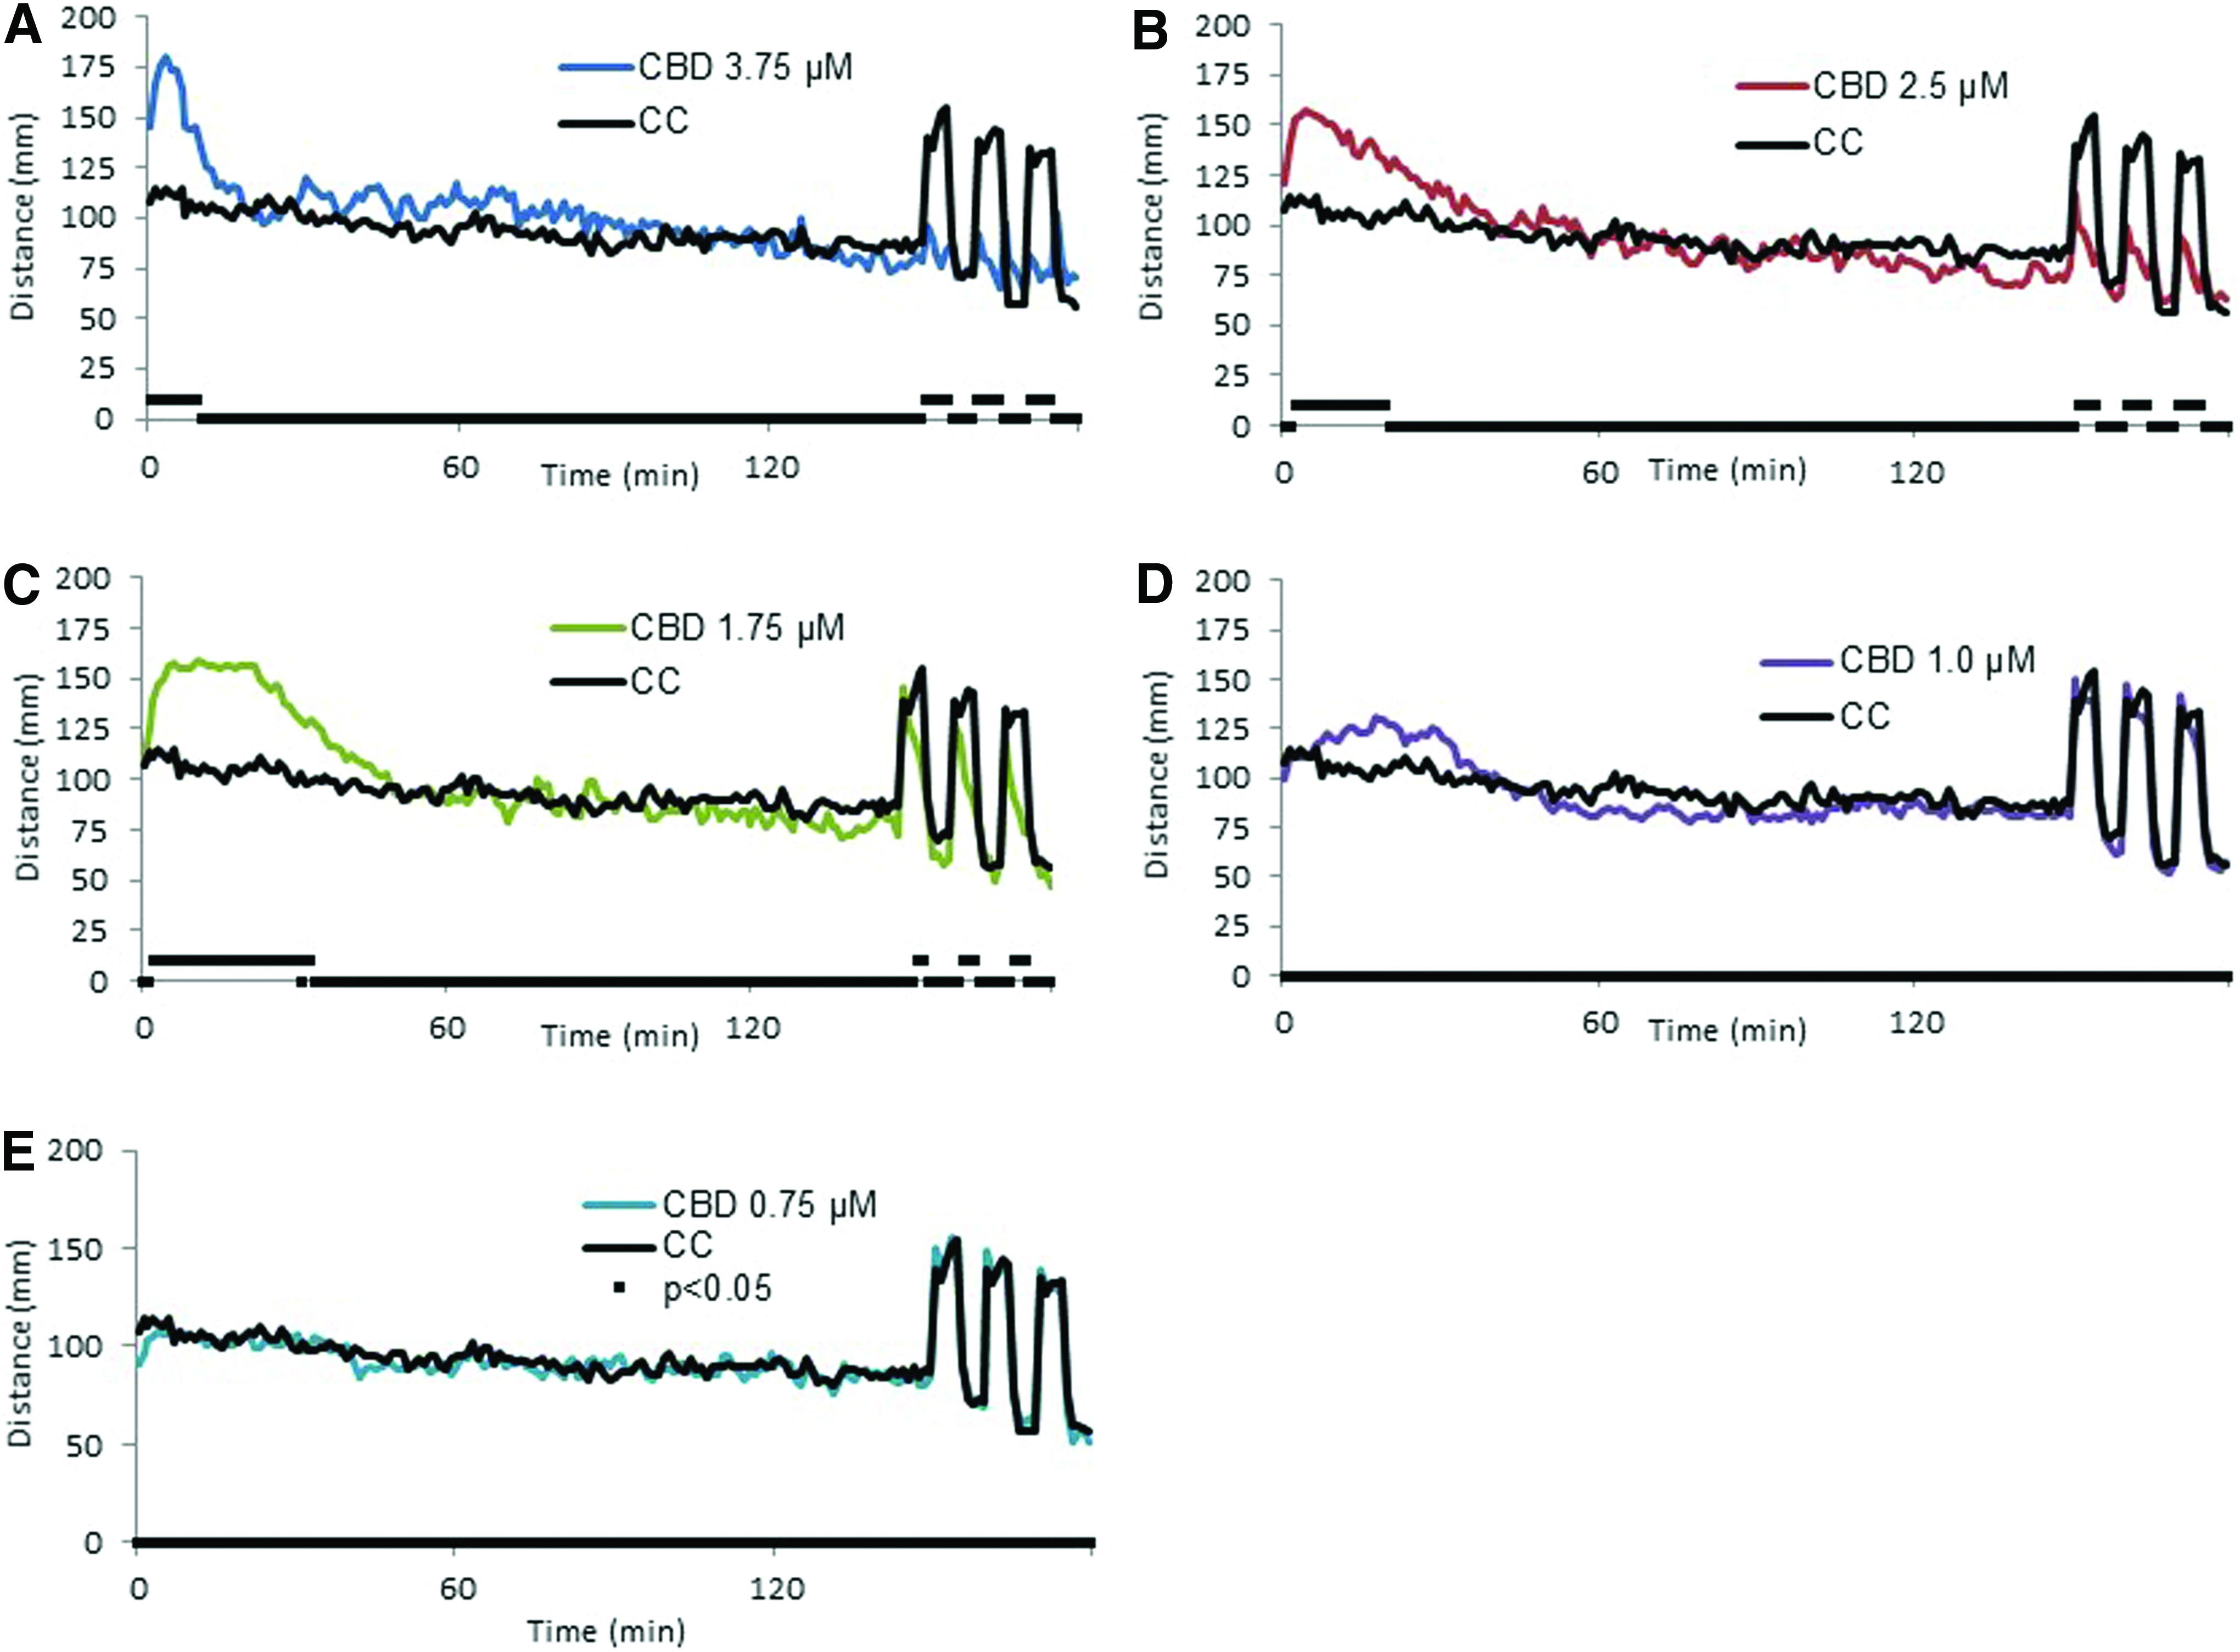
Behavioral response following acute exposure to CBD. Larval activity pattern as measured by average distance traveled (60 s time bins) immediately after introduction of 3.75 μM (
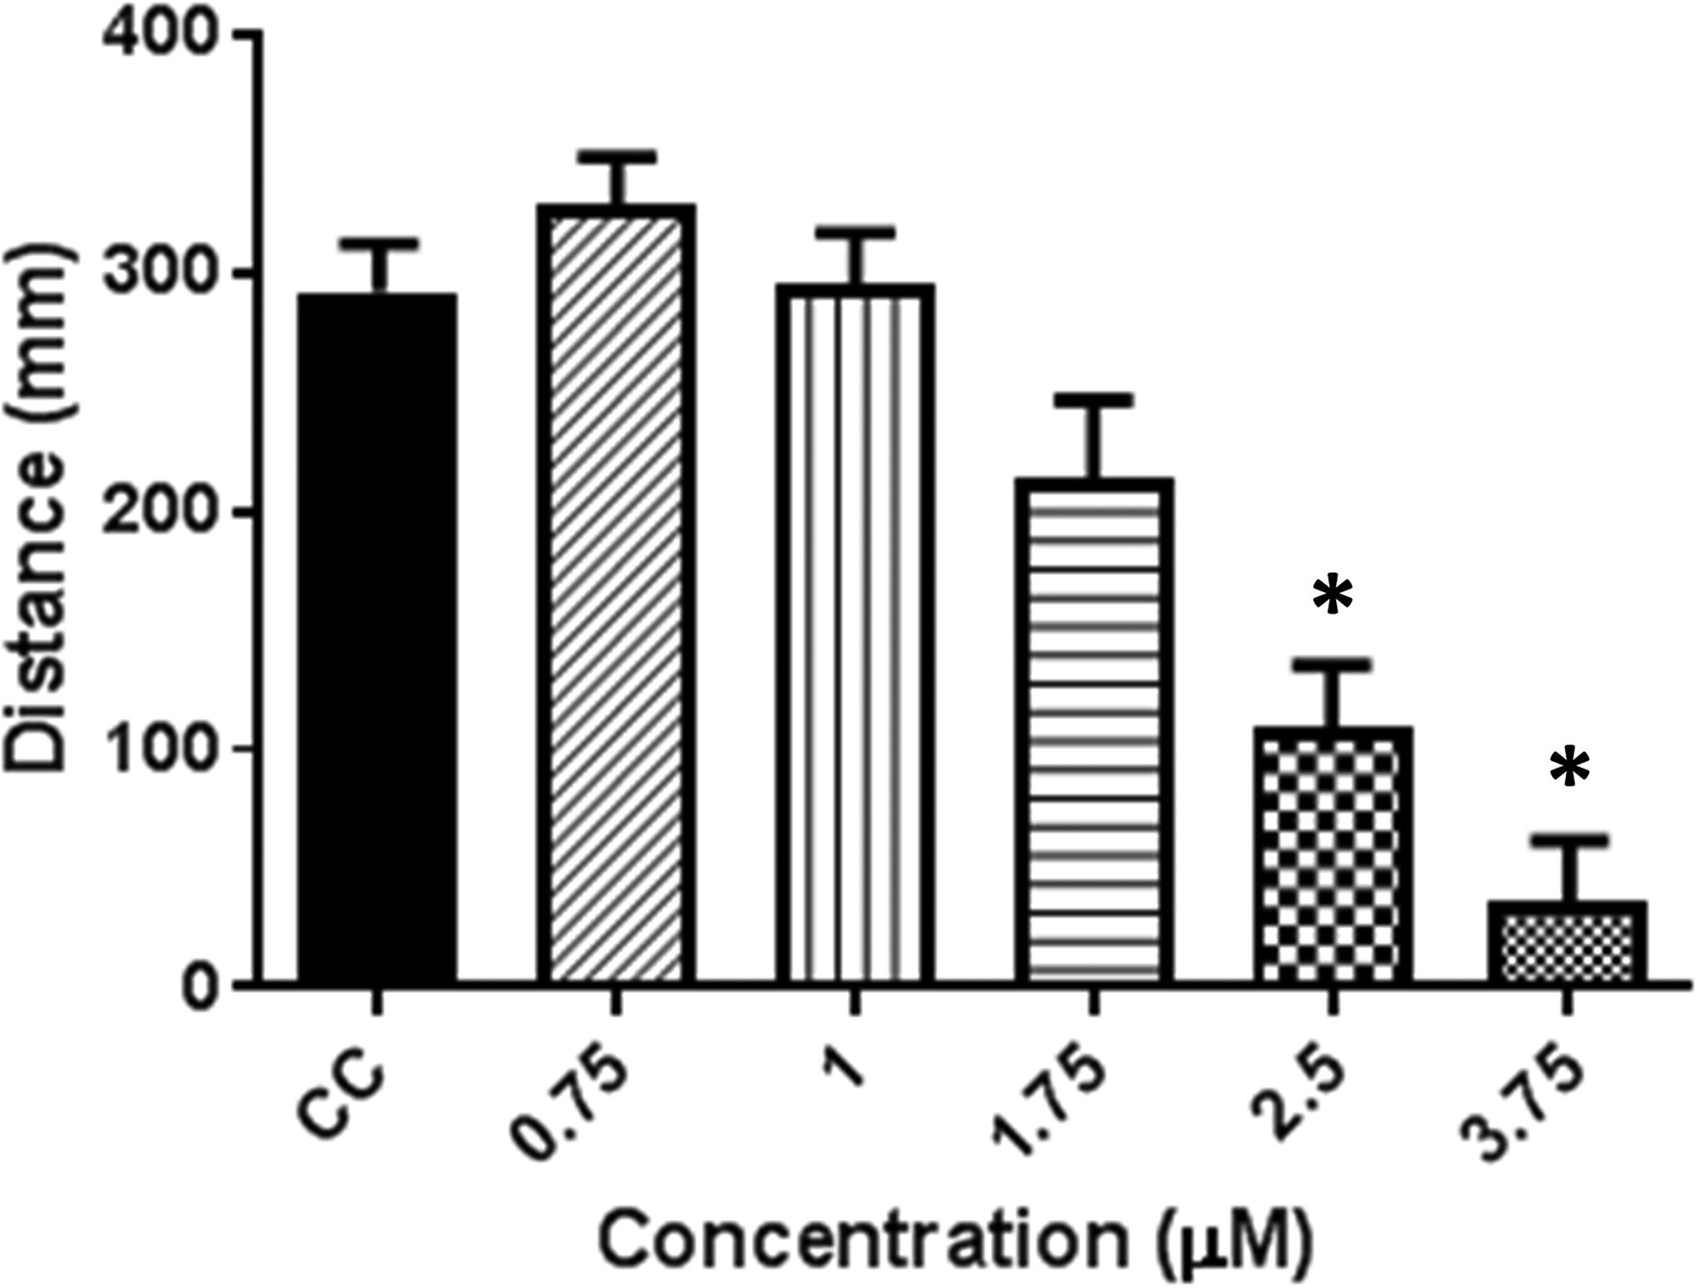
Light to dark transition for CBD dilution series. Total activity for the first 5 min dark transition normalized to the previous 5 min in the light. Data are expressed as mean ± SEM. *Indicates significant difference from controls. Dunnett's t-test (p < 0.05). n = 60 for all CBD concentrations, except 3.75 μM CBD, where n = 56.
THC + CBD cotreatment
Since numerous studies have shown that CBD can affect the activity of THC, we next assessed the changes in larval behavior when they were exposed to both CBD and THC simultaneously. We chose to test a range of THC concentrations against a single noneffective concentration of CBD. At 0.5 μM THC produces a significant reduction in activity compared with controls (Fig. 1D). When larvae were cotreated with this level of THC and 0.5 μM CBD, there was a small, but significant, increase in activity during the initial 5 min (Fig. 5A). When the level of THC was elevated (1.5 μM), the addition of CBD led to a larger increase in activity during the first 60 min (Fig. 5B). The hyperactivity pattern produced appeared similar to that found when larvae were exposed to 2 μM THC alone (Fig. 1A). These results show that at subphenotypic levels, CBD can significantly alter the change in activity following exposure to THC.
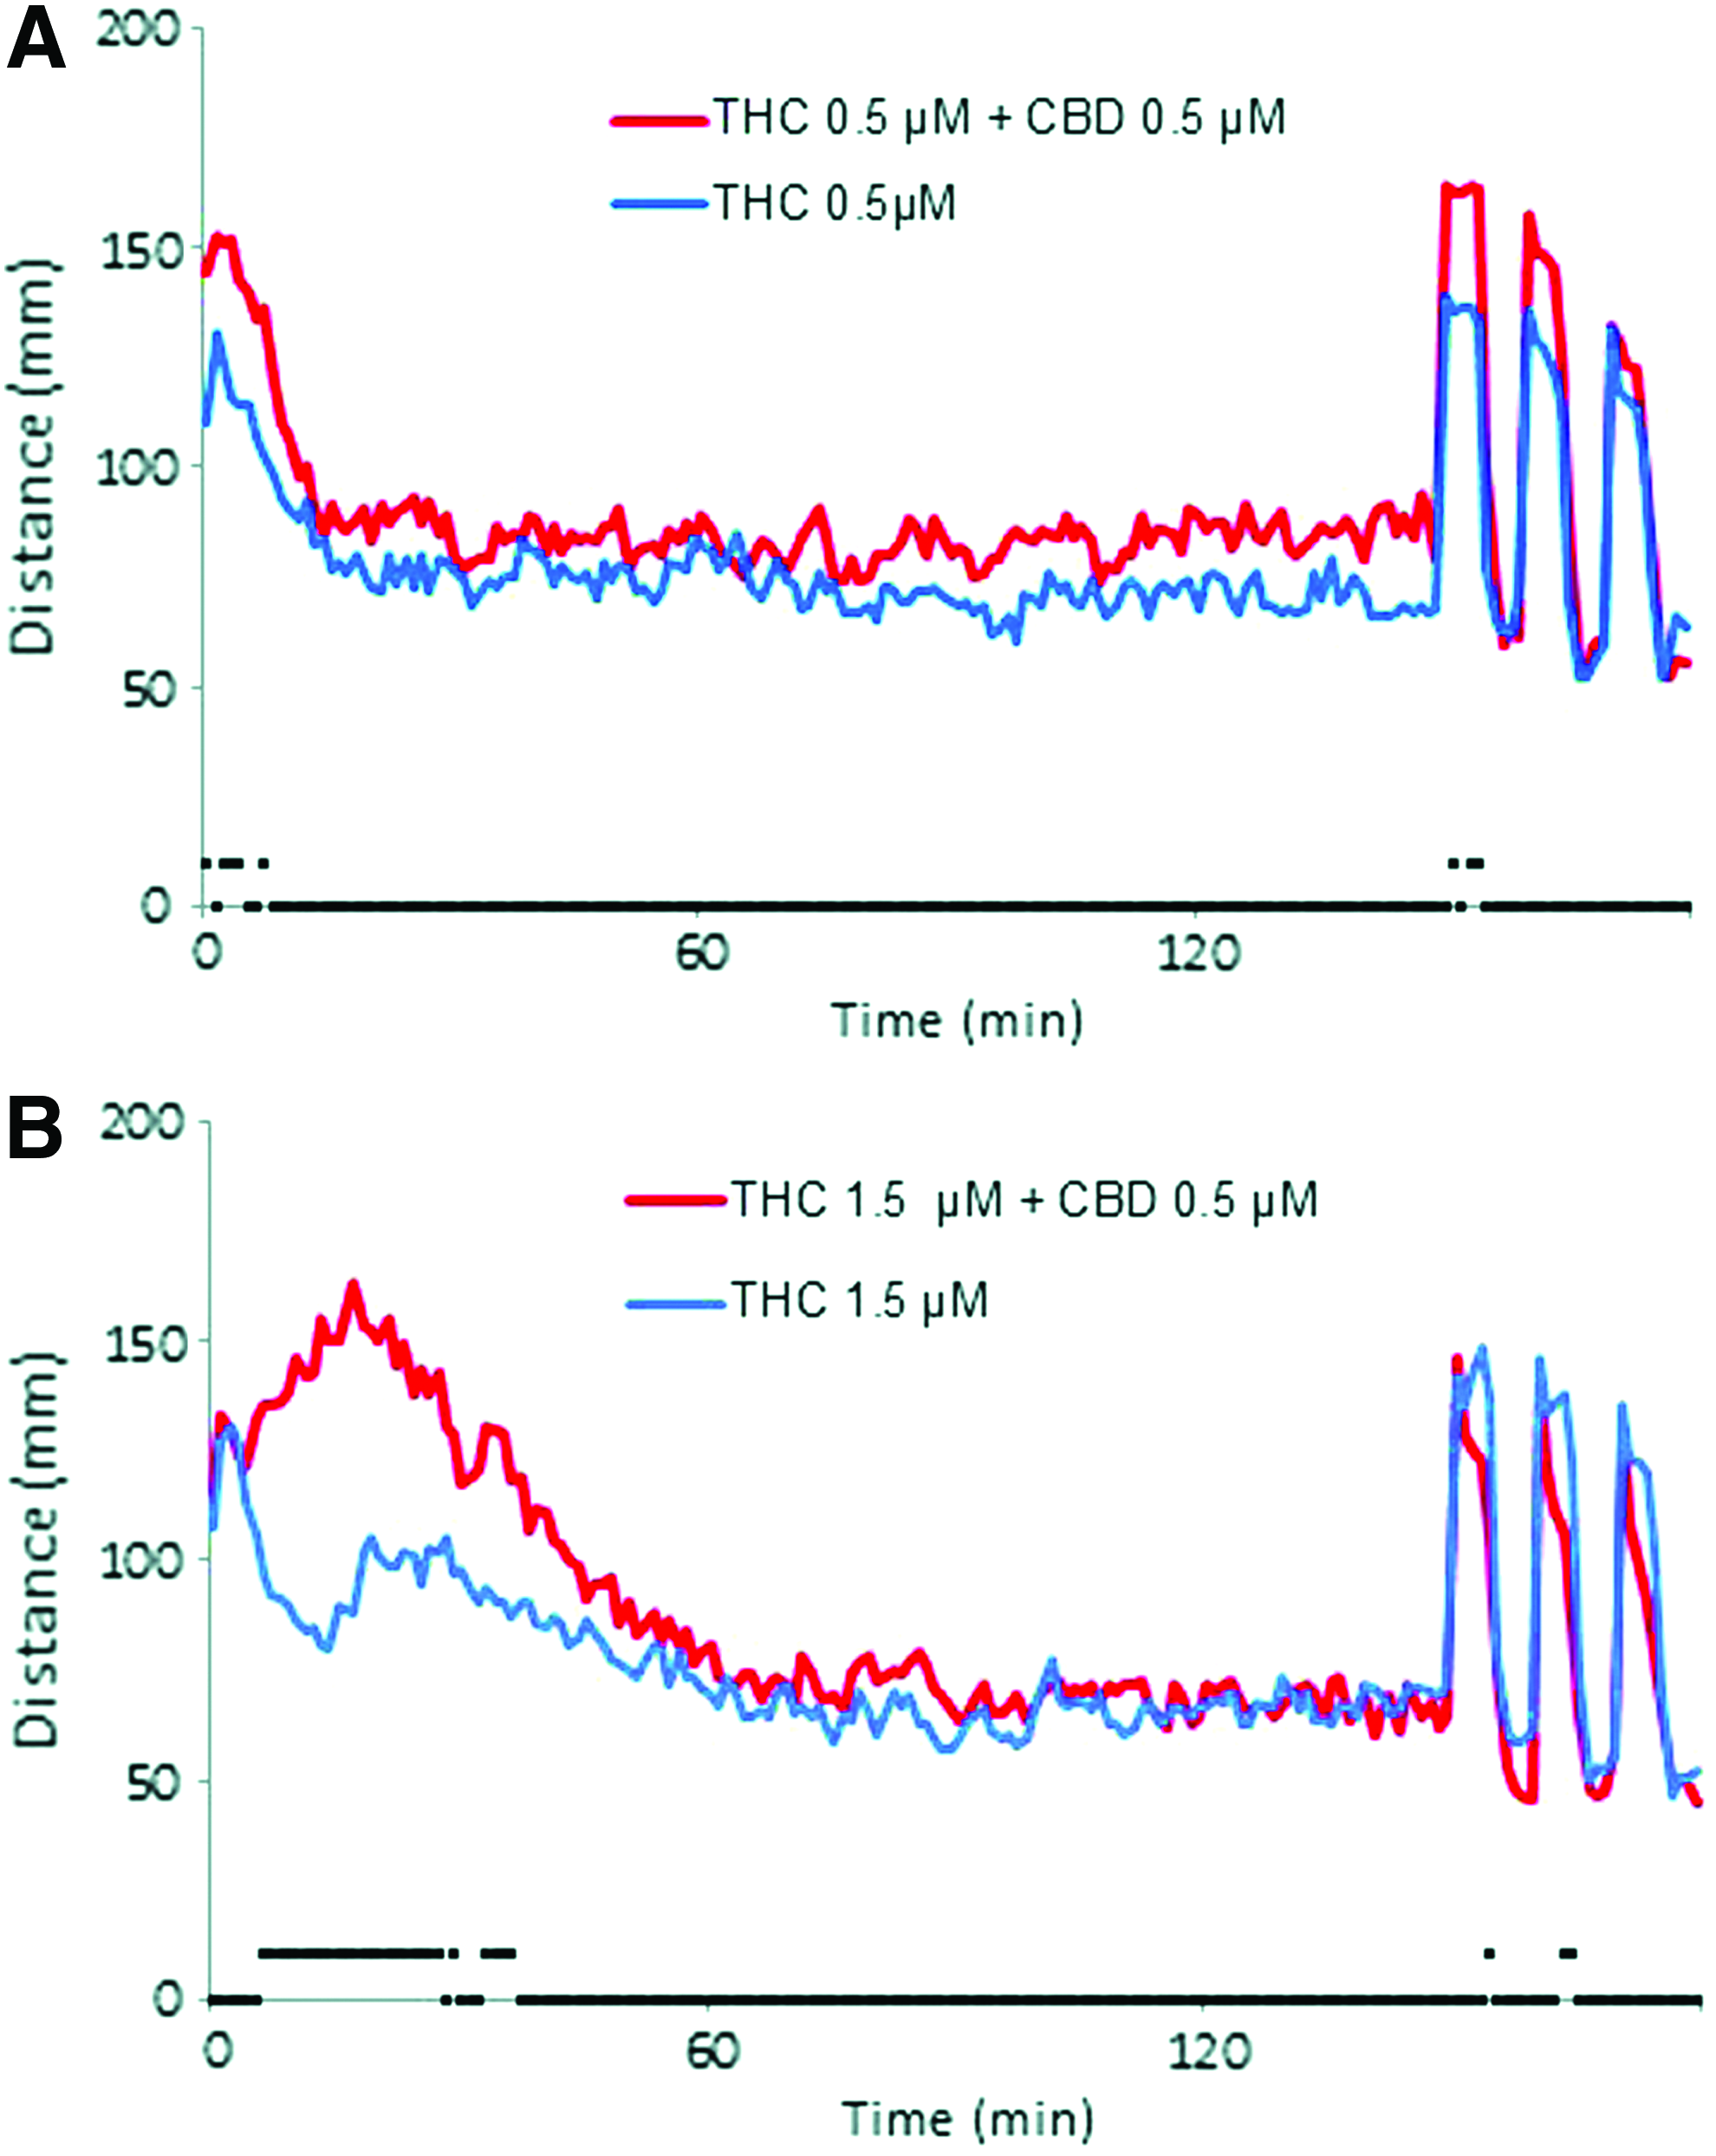
Behavioral response following acute exposure to cotreatment with THC and CBD. Larval activity pattern as measured by average distance traveled (60 s time bins) immediately after introduction of 0.5 μM THC (
Assessment of larval molecular uptake during phytocannabinoid exposure
The second phase of this study was to assess the uptake kinetics and potential metabolism of each cannabinoid by the larvae. Since exposure to both THC and CBD produced distinct acute behavioral profiles and measured time dependence, we chose to assess the uptake kinetics of each compound at exposure time points relevant to the acute behavior assay. The information obtained was meant to both confirm uptake of the two phytocannabinoids and to attempt to observe trends between the uptake and the behavioral profiles.
Using the same media volume to embryo ratios exposure experiments were conducted with time points covering the time ranges evaluated in the behavior experiments. Embryos were rapidly washed after exposure with the time 0 sample acting as a control for washing. Following lyophilization, the embryos were methanol extracted and this was extract analyzed by liquid chromatography-high resolution mass spectrometry (LC-HRMS) to determine the amount of cannabinoid in the larvae. Samples of exposure media were treated in the same manner.
The amount of cannabinoid detected per embryo was calculated based on the concentration of THC and CBD determined in the larval methanol extracts and using an average mass of 325 μg for a single 120 hpf larva (determined by weighing 20 age-matched larvae with media removed). In all experiments the initial time point control contained zero or nearly zero phytocannabinoid as calculated using a matrix-controlled calibration curve indicating the effectiveness of the washing.
At all bath concentrations tested the levels of THC detected in the larvae increased to peak levels during the first hour of exposure (Fig. 6A), whereas the CBD levels peaked between 60 min and 3 h of exposure (CBD) (Fig. 6B). Within the range of exposure concentrations tested, the initial rate of uptake for both compounds showed a concentration-dependent increase. Additionally, once the maximum larval concentration was reached, there was a subsequent decrease over the remainder of the 5-h experiment. This potentially indicates metabolism of the compounds and/or excretion. Analysis of the cannabinoid levels in the media over the same time period showed a time-dependent decrease that was quickened by, but not dependent on, the presence of larvae (data not shown).
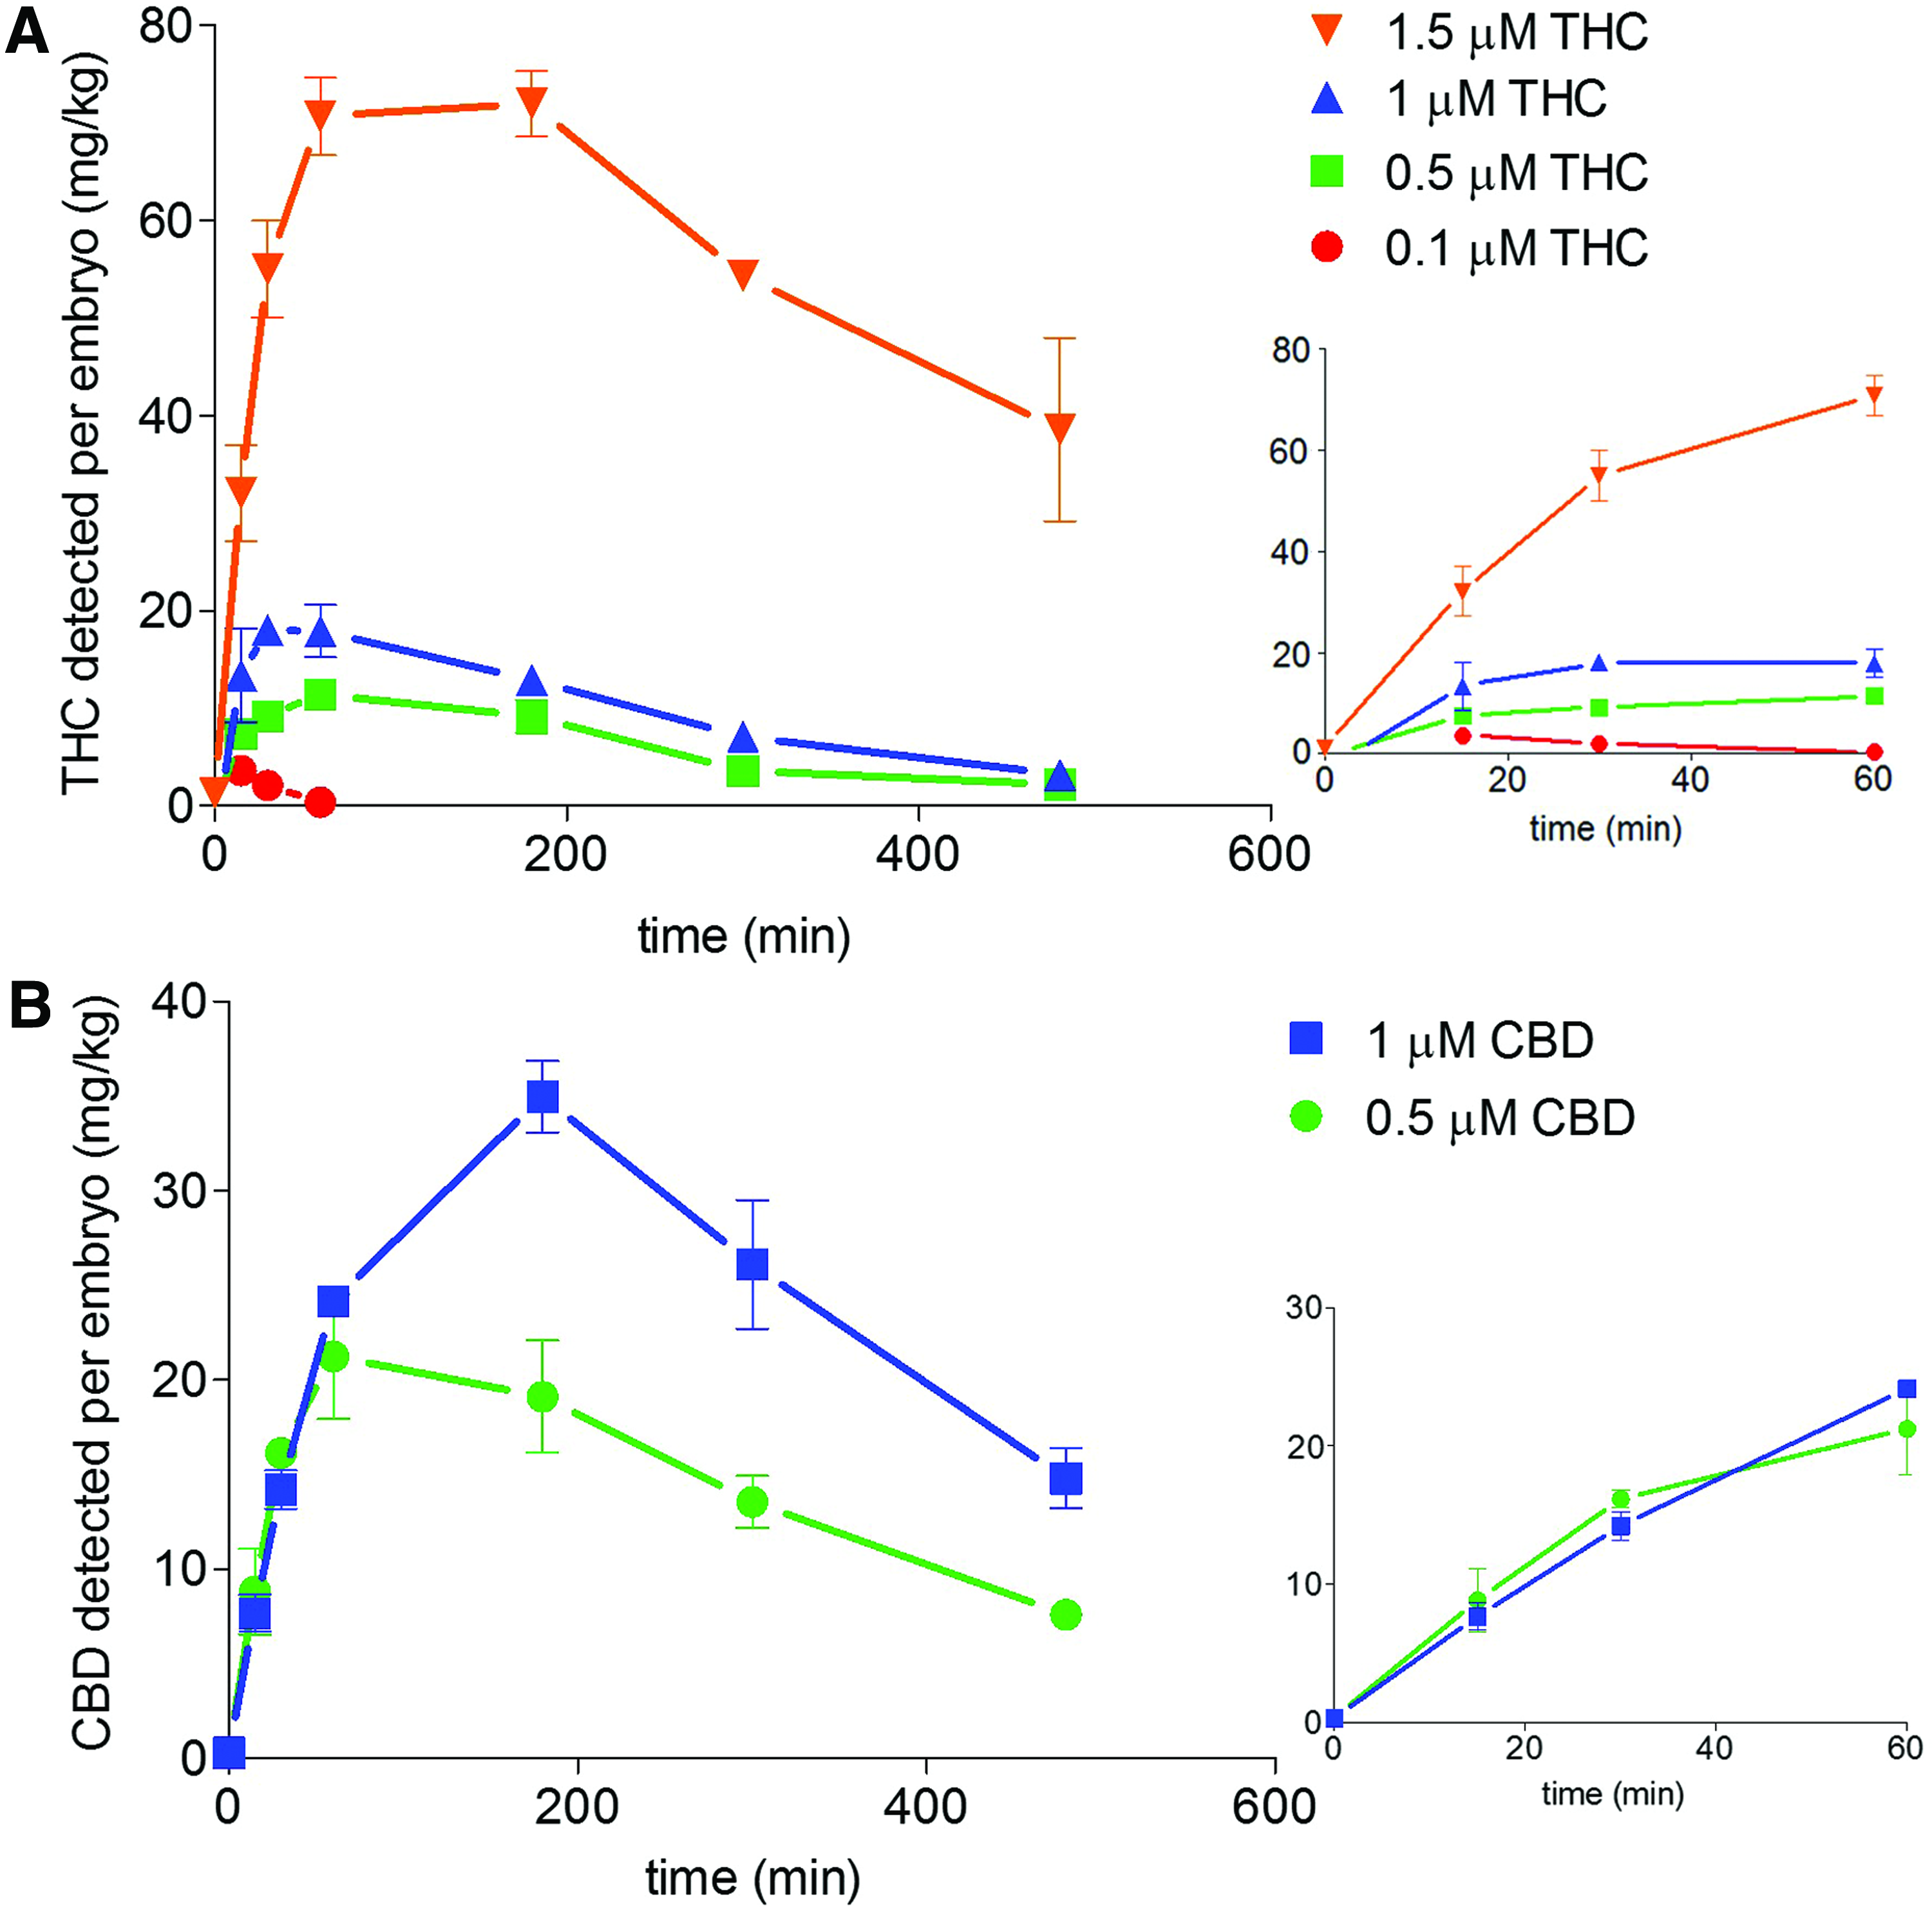
Uptake profiles of cannabinoids by zebrafish larvae during bath exposure. At all THC concentrations tested there was an initial rapid increase of THC detected within the larvae that appeared to plateau between 30 and 60 min
The maximal larval concentrations of THC and CBD (listed in Table 1) indicate that both bioaccumulate in the larvae. If these compounds entered the larvae through simple diffusion, the expected dose would be substantially lower. For instance by simple diffusion at 1.5 μM THC the larval concentration would be expected to be 0.472 mg/kg, whereas the concentration observed at 1.5 μM was 71.9 mg/kg.
THC, Δ 9 -tetrahydrocannabinol; CBD, cannabidiol.
Observing phytocannabinoid metabolism and excretion
Cannabinoid metabolism and excretion has been well studied in human and mammalian models (reviewed in Klein et al., 31 Maurer et al., 32 and Stout and Cimino 33 ). Since the metabolism of THC and CBD can alter their biological effect and excretion kinetics, it was important to determine if zebrafish larvae could produce the same metabolites found in mammalian models. The liquid chromatography-high resolution mass spectrometry (LC-HRMS) method used was able to identify phytocannabinoid metabolites within the exposure samples based on accurate determination of their mass and fragmentation pattern. Without accessing to reference standards for these metabolites, we were not able to determine the concentrations of metabolites present, but we are able to observe trends in their relative amounts with respect to exposure time.
A rise in larval THC (Fig. 7A) and CBD (Fig. 7B) levels was followed by a rise in two ions corresponding to the mass of their respective first-pass metabolites, hydroxylated-THC (HO-THC) and CBD-glucuronide. As exposure time increased, other less abundant metabolites common to mammalian pharmacokinetic models were observed such as hydroxy-CBD (HO-CBD), 11-nor-9-carboxy-THC (THC-COOH), and THC-glucuronide. Importantly, the levels of these metabolites found in the media also increased with time. The accumulation in the media appears to coincide with decreasing larval concentrations indicating diffusion of the metabolites from the larvae or possible active excretion.
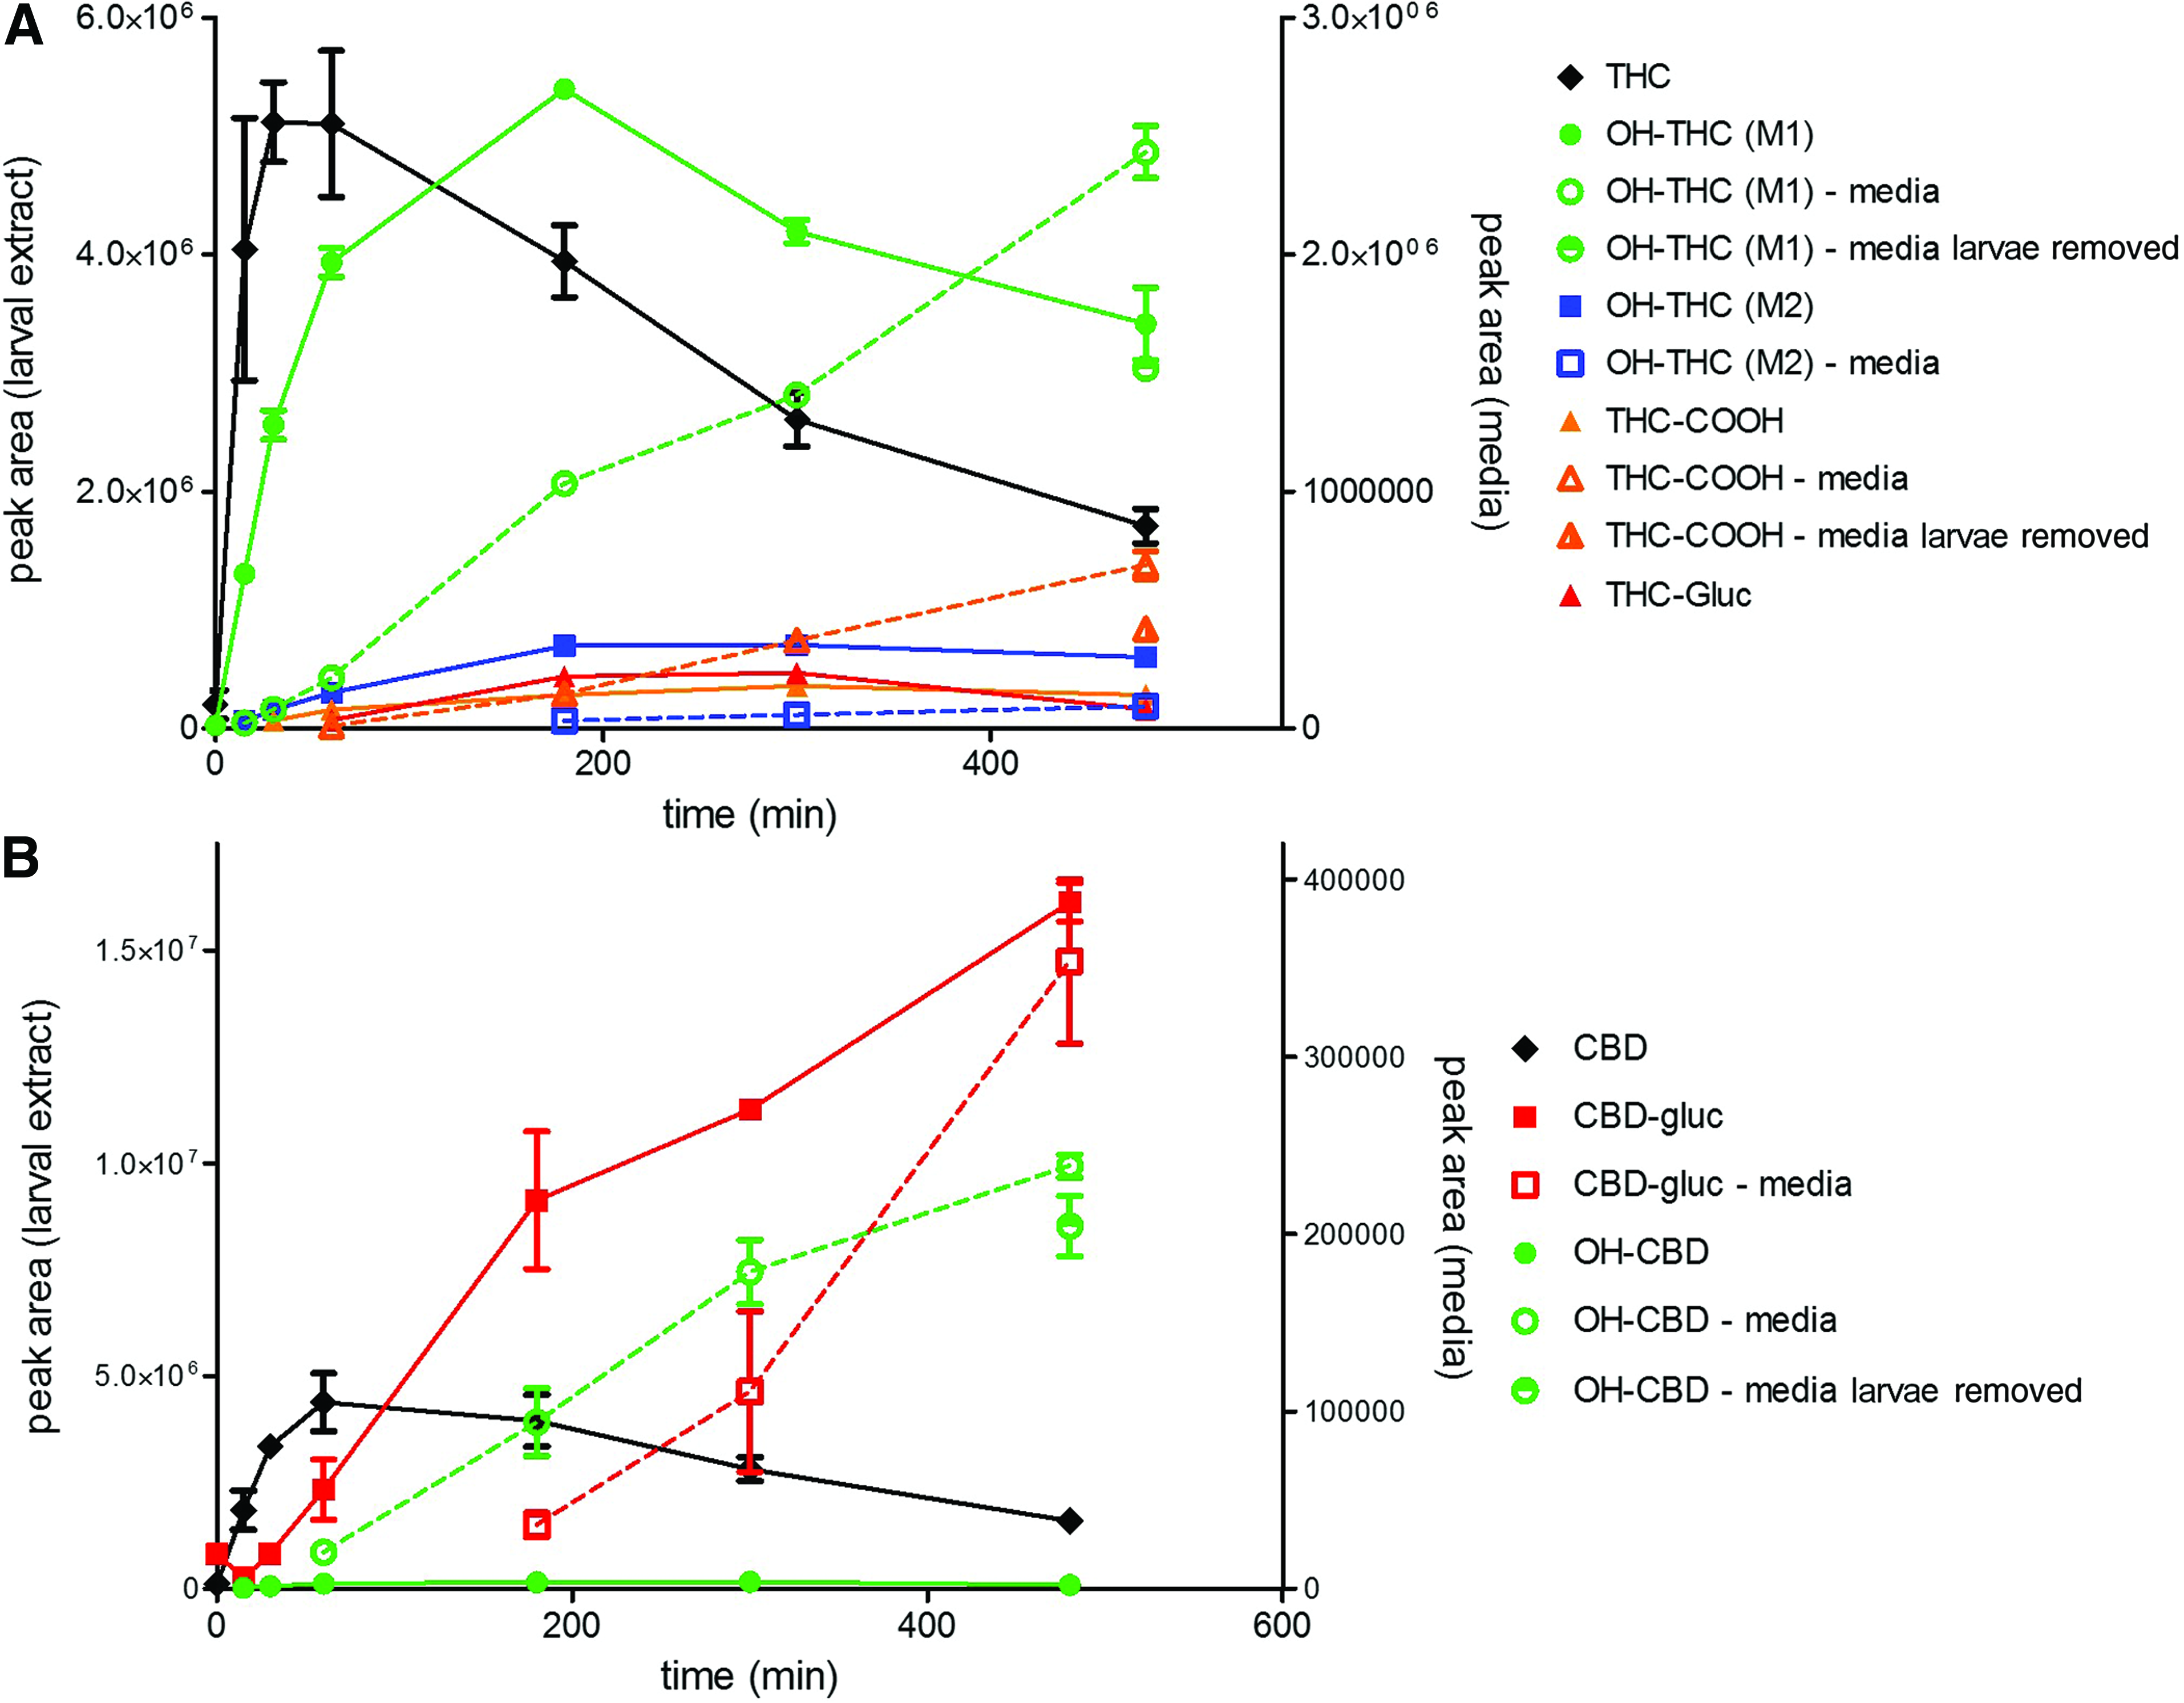
Detection of cannabinoid metabolites in exposed larval extracts (solid symbols and trend lines) and media samples (open symbols, dotted trend lines) during 1 μM THC exposure
Metabolites were not detected in the media samples taken from controls that did not contain larvae, indicating that their presence is due to active metabolism and not contamination of the original phytocannabinoid preparations (data not shown). This is also illustrated by the observation that the levels of the major metabolites (OH-THC and OH-CBD) detected in the media were not found to increase in the 8 h exposure test following removal of the larvae at the 5-h time point (Fig. 7).
Cannabinoid uptake and metabolism in cotreatment experiments
Molecular uptake experiments were also performed on cotreatment exposures of THC and CBD similar to those done using the behavioral assay. Using the developed liquid chromatography-high resolution mass spectrometry (LC-HRMS) assay we were able to simultaneously measure the uptake of THC and CBD (Fig. 8) and compare the uptake kinetics to the single-compound exposures. For each of the various concentrations of THC coadministered with 0.5 μM CBD, the amount of THC detected in the larvae was higher than the level detected during the equivalent THC-only exposure for all of the time points. Not only was there an increase in the maximum amount of THC in the larvae, but the levels also remained higher longer (Fig. 8A).
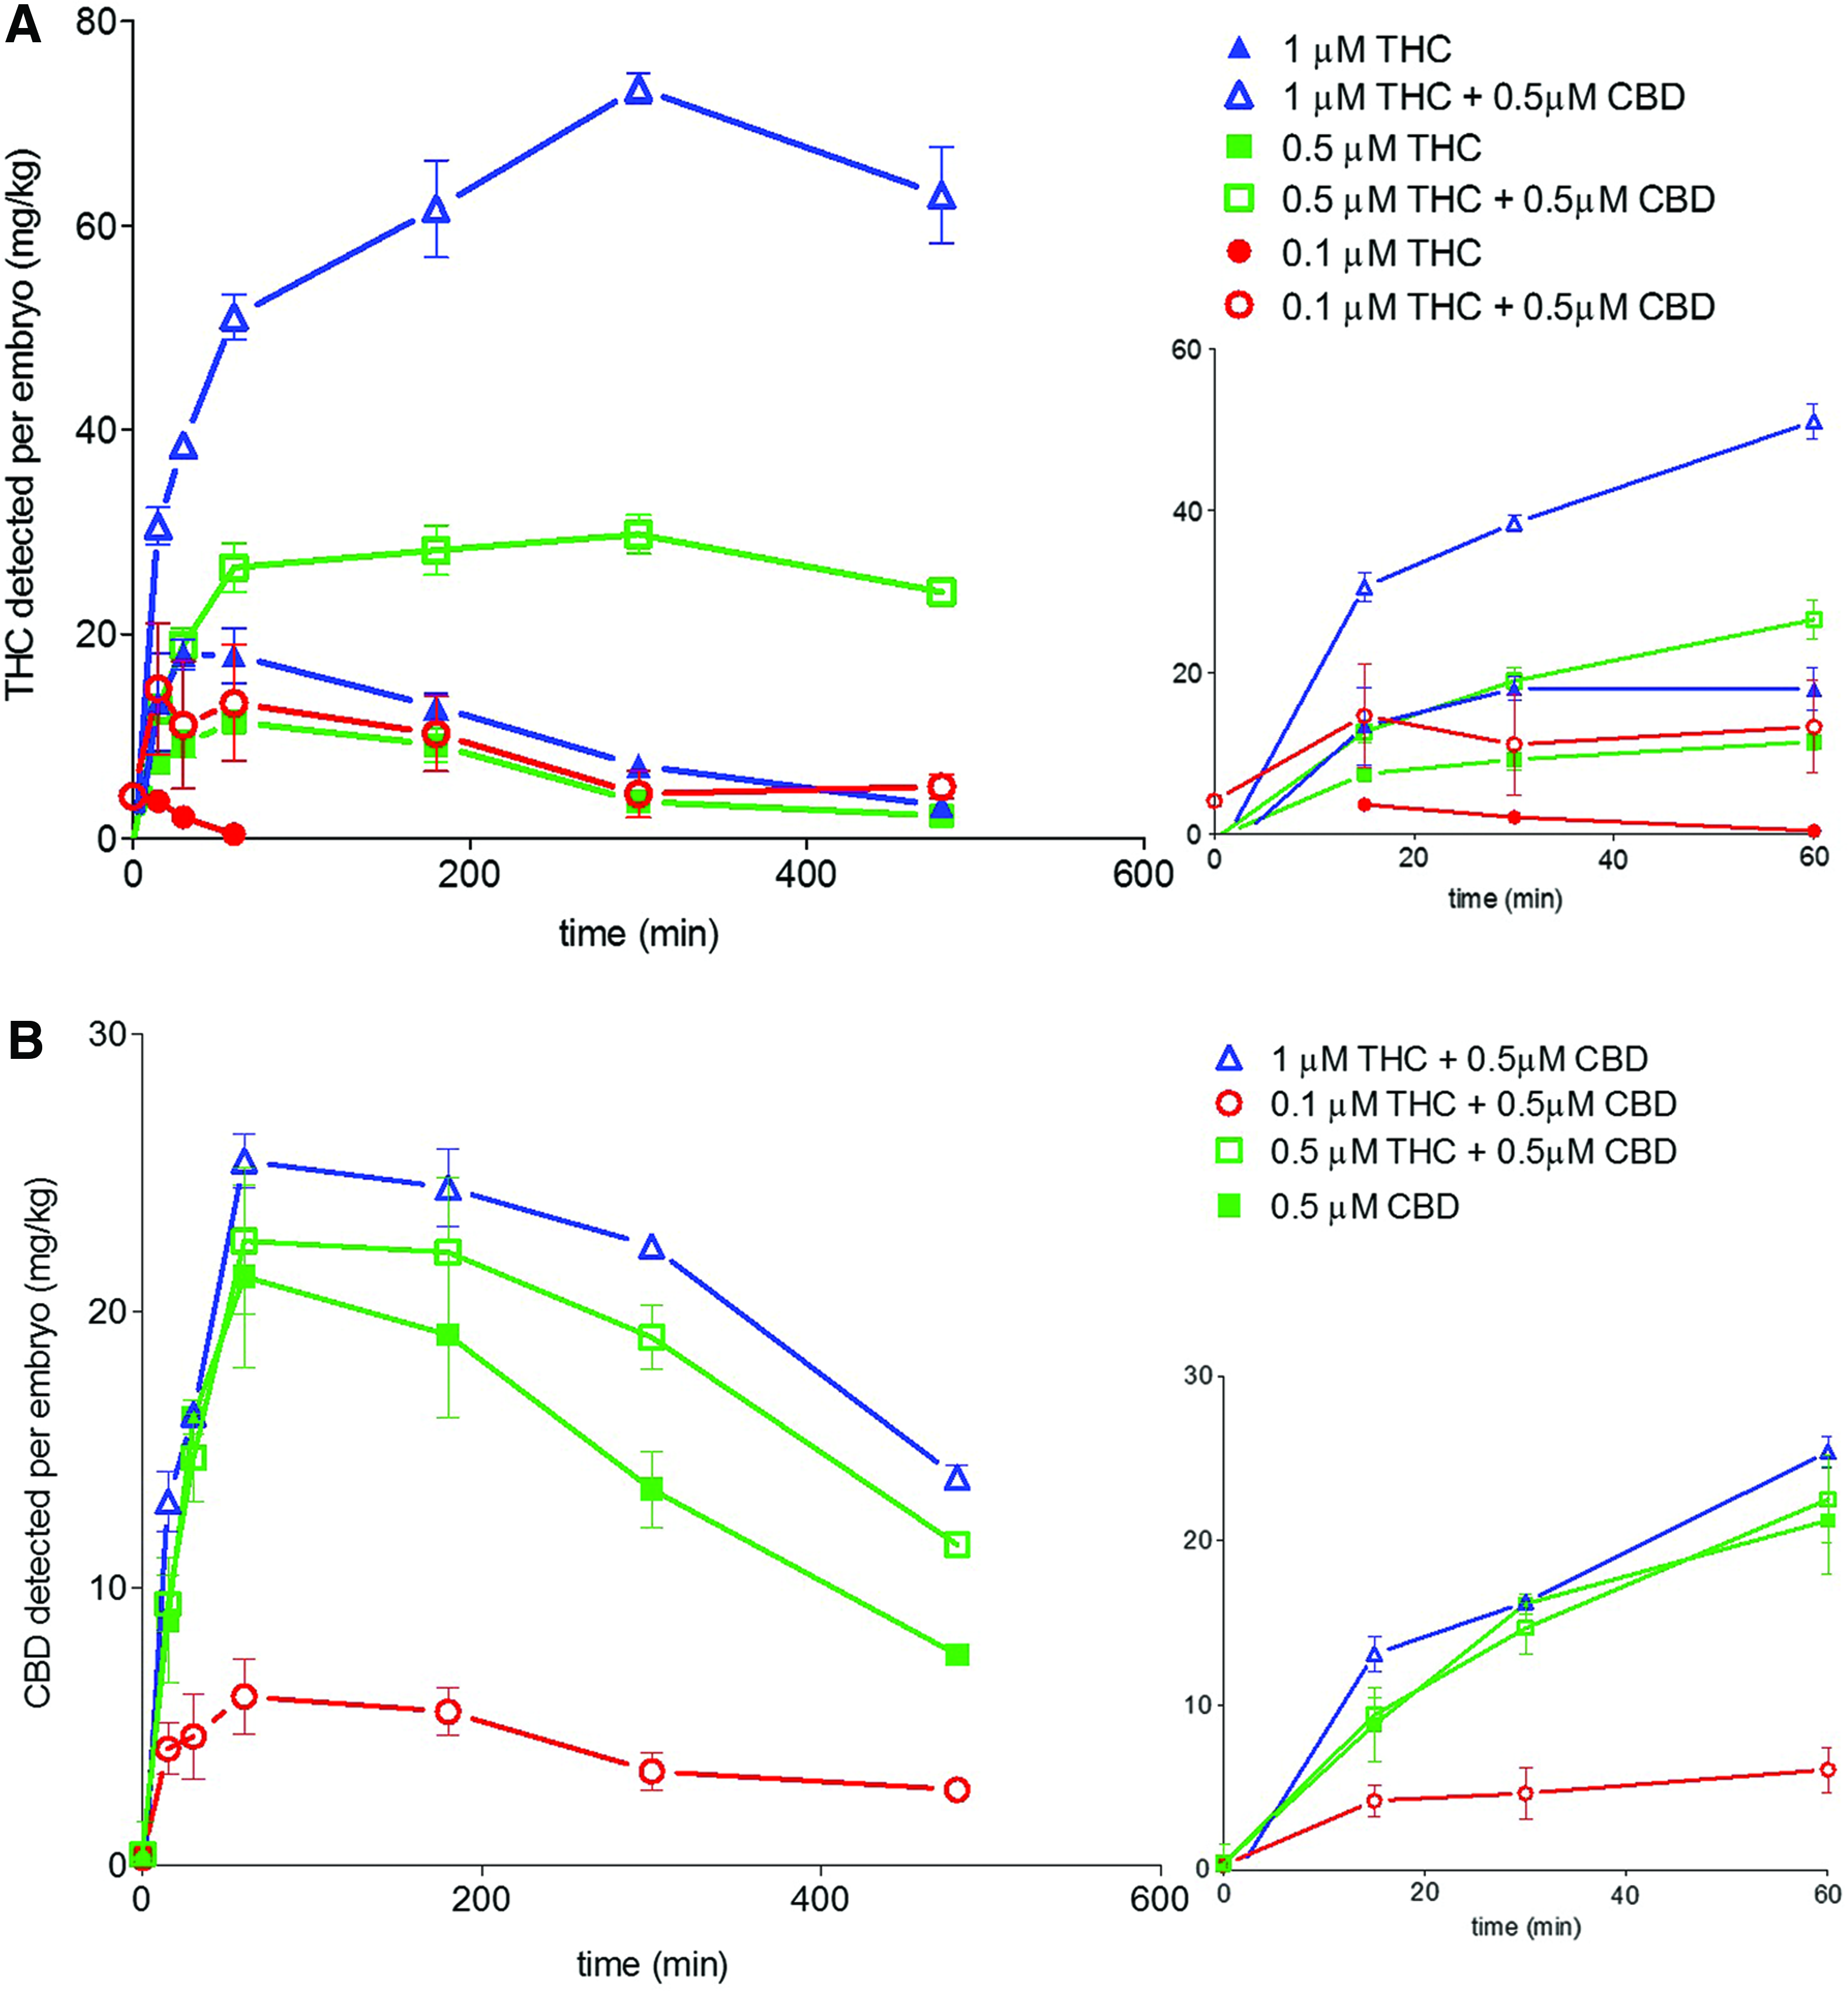
Coadministration of THC and CBD alters levels of THC detected in larvae. The first 60 min of exposures are shown as insets. Detected levels of THC
The larval levels of CBD in the coadministration experiments were also altered. Although there was little change in initial CBD uptake kinetics when coadministered with 0.5 and 1 μM THC, there was a slight increase in maximal CBD larval levels with the levels remaining higher than when CBD was exposed alone over the time course (Fig. 8B). Interestingly, this trend was not observed in the 0.1 μM THC and 0.5 μM CBD cotreatment. In that case, detected levels of CBD were lower than when larvae were exposed to 0.5 μM CBD alone.
Previous THC and CBD mammalian coadministration studies have found altered metabolite profiles compared with when these compounds are administered alone.31,34 To assay for altered metabolite profiles we also analyzed the cotreatment exposures for the presence of primary and secondary metabolites both in the larvae and in the media. Figure 9 shows the larval and media metabolite profiles of the most abundant OH-THC species detected (Fig. 9A) and CBD-glucuronide (Fig. 9B) in the coexposure uptake experiments.
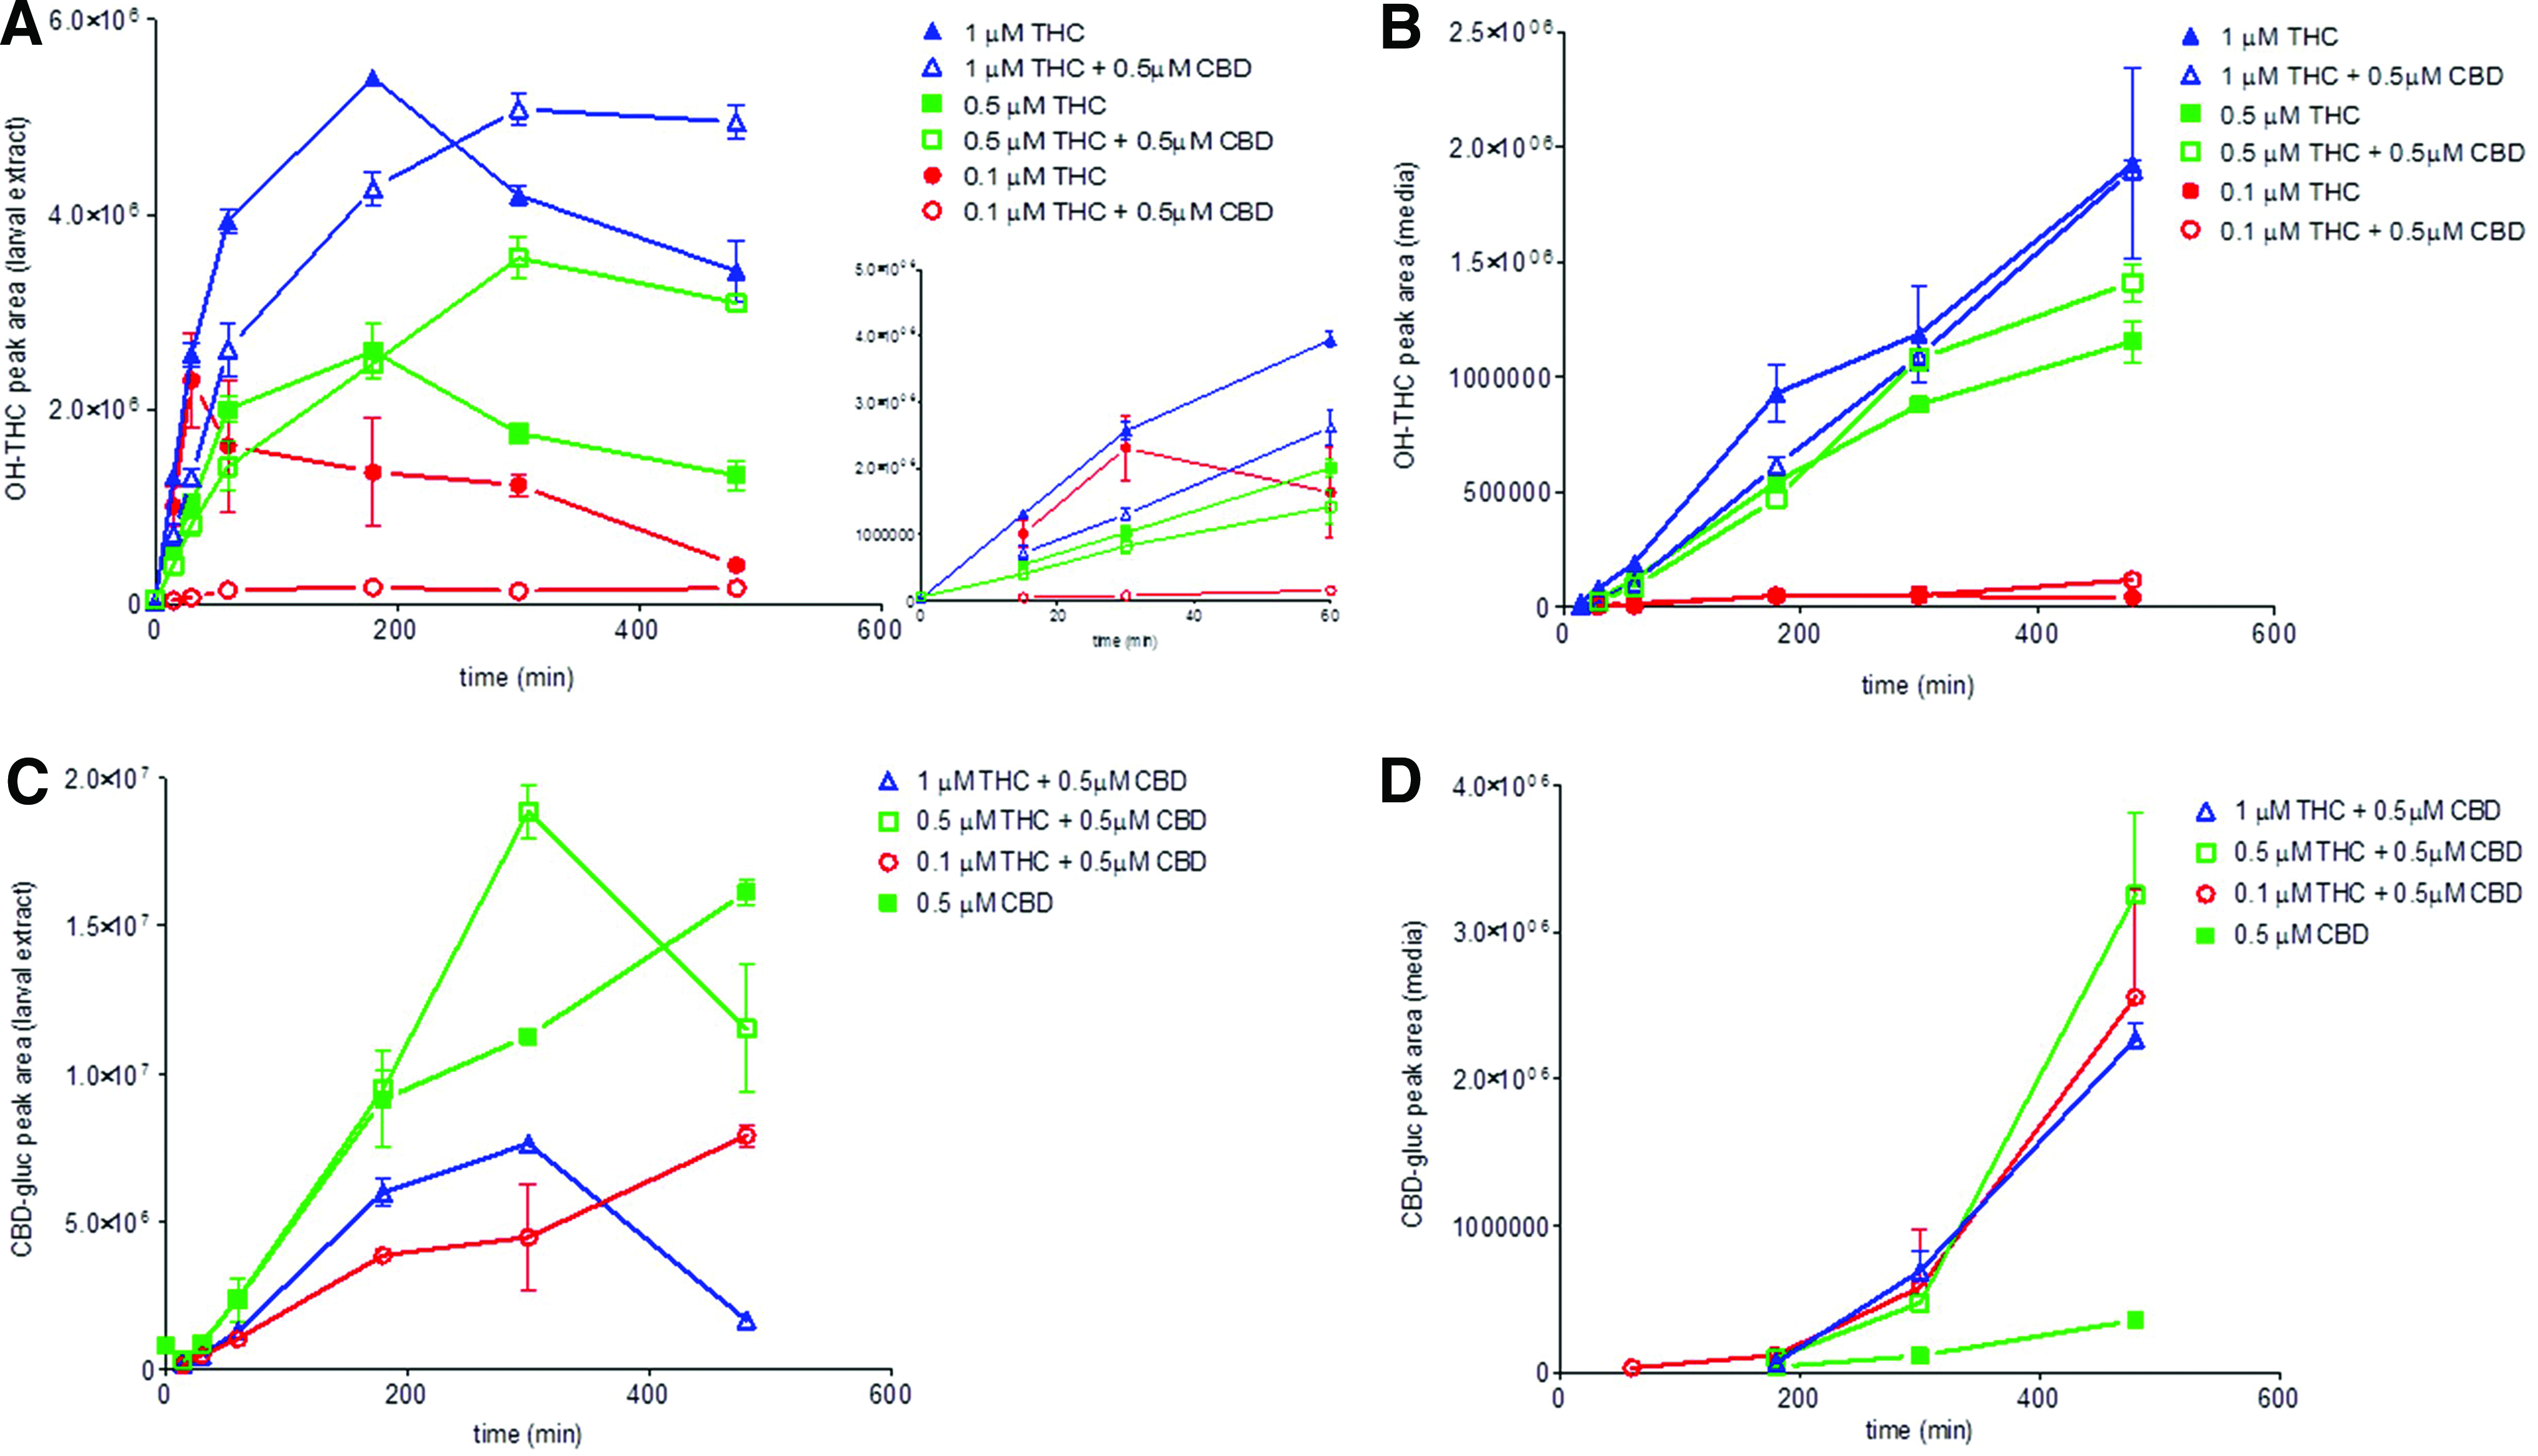
Levels of the major hydroxytetrahydrocannabinol (HO-THC) mass ion (M1)
The overall kinetic profile of OH-THC appearance in the larvae and then in the media appears similar with respect to the single-compound THC exposures (Fig. 9A). However, in all of the cotreatment uptake experiments there is an overall decrease in the larval amount of metabolites seen in the initial 60 min of exposure as compared with when THC is administered alone. It is interesting that these metabolite levels are lower in the cotreatment exposures despite there being more THC detected in the larvae as compared with THC-only treated larvae (Fig. 8A). At later time points (≥300 min) in the 0.5/1 μM THC and 0.5 μM CBD cotreatments, the levels of larval OH-THC do rise above the OH-THC levels seen in single-compound THC exposures. Levels of OH-THC detected in the media exhibit a similar trend, with an initial decrease in OH-THC seen during coadministration, which eventually leads to higher levels at later time points (Fig. 9B).
Like OH-THC, the levels of CBD-glucuronide fall below single-compound exposure levels in both the 1 and 0.1 μM THC cotreatments, but are similar (except for the 300-min time point) in the 0.5 μM THC cotreatment (Fig. 9C). However, unlike OH-THC, the media levels for CBD-glucuronide are all higher in the cotreatment experiments than the single-compound exposure experiments (Fig. 9D).
Discussion
It has been demonstrated that the changes in the behavioral activity patterns of zebrafish larvae can be used as a high-throughput model for testing the bioactivity of neurotherapeutics.7,23,28–30 In this study, we have made use of a previously developed, multimodal behavioral assay that has shown the ability to measure distinct differences between the effects of exposure to THC and CBD. 14 The assay assessed the effect of each compound on baseline activity and the effect on a dark stimulus response. However, unlike the previous studies that tested the effects of THC and CBD on larval activity after prolonged exposure,14,21 the current study evaluated activity immediately following exposure.
Exposure to either THC or CBD alone resulted in an initial peak in basal activity that then plateaued within 60 min (Figs. 1 and 3). The initial increase in activity is consistent with elevated activity found following acute THC administration in mice. 35 However, following this initial peak in activity, there were differences in activity between THC and CBD. The plateau level following THC exposure was below that of the controls and decreased with an increasing concentration of THC, whereas the activity following CBD exposure plateaued at a level not significantly different than controls.
The observation of reduced larval basal activity upon THC exposure is consistent with adult zebrafish that show a reduced swimming speed following exposure to THC. 17 Although this could be indicative of a sedative effect, it is important to note that the size of the dark stimulus response following THC exposure was not significantly different than controls. This may indicate that the initial reduction in light activity may not be due purely to sedation. While the sedative effect of THC would be consistent with mammalian studies, Stewart and Kalueff observed a reduced top swimming behavior for adult zebrafish during THC exposure, which is thought to indicate anxiogenic behavior. 17 The reduction on larval basal activity may then be an indication of anxiogenic behavior rather than sedation.
This hypothesis is strengthened by the observation from a previous larval zebrafish study that showed an elevation in a dark stimulus response following both 1 and 4 h of exposure to 2 μM THC. 21 However, unlike the current study, the light activity immediately preceding the dark stimulus was not different than controls. It should be noted that the larvae in the Aktar study 21 were loaded into 96-well plates at 24 hpf, whereas in the current study larvae were housed in a recirculating bath and only loaded into 96-well plates 2 h before exposure to either cannabinoid. We have previously found that rearing larvae on a recirculating system leads to a higher basal activity than when larvae are reared in well plates. This would seem to be consistent with the lower average light activity found in the Aktar study (<50 mm for a 4-min window), compared with the current study (100 mm/min). Regardless, both studies appear to show indications of an anxiogenic response to THC exposure at the concentrations tested.
In contrast, CBD was found to reduce the dark stimulus response in a dose-dependent manner. As the increase in larval activity following the light to dark transition is considered to be a stress response the reduction in this activity following CBD exposure may be linked to, and an indication of, its anxiolytic effect. 36 This activity pattern is also consistent with previous adult zebrafish work that tested the effect of CBD and showed no change in swimming speed or distance, but did show an anxiolytic effect in the novel tank test. 15 CBD has also been shown to act as an anxiolytic in acute mammalian behavioral models.37–42 Care should be taken when attempting to link the effects of cannabinoids to stress and anxiety as it has been shown that activation of the endocannabinoid system can lead to both anxiogenic and anxiolytic responses depending on a number of complex interactions between cannabinoids, receptors, and distinct neural pathways.43,44 However, the commonalities between all of these models, along with the fact that CB-1 receptors are expressed in the hypothalamus of zebrafish, suggests that the larval model may help augment mammalian models that are currently exploring the role of Cannabis and its extracts in the treatment of anxiety and other related disorders, such as posttraumatic stress disorder.10,45
The molecular uptake experiments verified the delivery of cannabinoids through bath exposure. It also allowed us to determine the actual amount of each cannabinoid in larvae during the exposure time course and relate that to the behavioral data. Interestingly, the maximal larval concentration was not reached until ∼1 h after exposure. This would seem to align well with the beginning of the plateau in activity following the initial peak for both THC and CBD.
Using the uptake data, we were also able to observe differences in the effective doses of the two cannabinoids with respect to the behavioral tests. Although a statistically significant drop in behavioral activity was seen when the THC bath concentration was 0.1 μM we could not confirm uptake. This is most likely because the larval THC level was below the limit of detection in our liquid chromatography-high resolution mass spectrometry (LC-HRMS) assay. In contrast, there was no behavioral effect observed with 0.5 μM CBD bath exposure even though we were able to detect a significant amount of CBD within the larvae (21.2 mg/kg).
The maximal larval concentrations of THC and CBD determined in our bath exposure study (Table 1) are slightly higher overall, but fall into the range of those tested by injection in mammalian models (Klein et al. 31 : 1–10 mg/kg THC; Todd et al. 35 : 10 mg/kg THC, 50 mg/kg CBD). Interestingly the concentration observed in the larvae does not always correlate in a linear fashion to the bath concentration. For instance, an increase from 1 μM THC to 1.5 μM THC in the bath does not result in a 1.5 × increase in the maximum detected larval concentration (Table 1). This information can be important when we evaluate the THC/CBD behavioral data only using bath concentrations. A slight variation in the media concentration of THC could result in a large variation in larval THC levels during the time course of exposure. A nonlinear increase was also observed between larval levels of CBD detected in larvae exposed to 0.5 and 1 μM CBD media concentrations (Table 1). Since there appear to be slight differences between the uptake of THC and CBD, assessing the uptake kinetics of additional cannabinoids or any other new class of compounds will be important when trying to interpret behavioral and/or toxicological data.
Liquid chromatography-high resolution mass spectrometry (LC-HRMS) analysis was also able to detect common phytocannabinoid metabolites in our zebrafish larval assay, based on their accurate masses. These metabolites were seen to accumulate in the larvae after the initial accumulation of the parent molecule and were then found in ever-increasing amounts in both the larvae and the media. Importantly, the relative overall metabolite profiles were similar to those seen in mammals. The major phase I oxidative metabolites of THC are 11-hydroxy-THC and the less abundant 8-hydroxy-THC (reviewed in Maurer et al., and Dinis-Oliveira et al.32,46). Our liquid chromatography-high resolution mass spectrometry (LC-HRMS) analysis was able to measure the presence of two hydroxy-containing THC metabolites with different retention times in the larvae. Unfortunately, due to a lack of reference standards at this time, we are unable to unambiguously determine which mass ion corresponds to which oxidative metabolite.
It has been shown that in naturally derived cannabinoid extracts the variations in the levels of both THC and CBD can produce different biological outcomes. This is supported by work that looked at the effect on different ratios of CBD:THC on the bioactivity of THC. 47 In this study, using our larval behavioral assay we were able to show a potentiated THC behavioral effect when larvae were coexposed to THC and subphenotypic levels of CBD. Parallel uptake and metabolite detection experiments were able to confirm elevated larval THC levels when CBD was present. This elevation in larval THC coincided with lower levels of the major THC metabolite (OH-THC) providing a potential mechanism for the elevation of THC and the potentiated THC behavioral effect in the coexposure experiments.
These observations are similar to previous adolescent rat studies that showed a potentiated THC behavioral effect that coincided with elevated serum THC levels and lower levels of THC-COOH and 11-OH-THC when CBD and THC were coadministered. 31 CBD inhibition of cytochrome P450 enzymes in the CYP2C and CYP3A subfamilies was postulated to be the reason for the lower THC metabolite levels observed in rodents.31,48,49 This may be the case in the larval zebrafish model as well.
Conclusion
We have now developed a larval zebrafish model with which to study the pharmacodynamic and pharmacokinetic effects of cannabinoids individually and importantly in combination. This work sets a foundation for future studies that can assess the activity of cannabinoids along with mixtures of cannabinoids and plant extracts. The previous use of zebrafish larval assays in testing chemically complex extracts 50 points toward the usefulness of the model in assaying the ratios of cannabinoids in oil and smoke condensates of known marijuana strains. In addition to the effects on baseline activity and metabolism, the ability to assess the uptake kinetics of cannabinoids may allow for comparisons to be made to mammalian models. Additionally, showing that cannabinoids have measurable activity in larvae builds off from our previous work, looking at the effect of THC and CBD on a larval model of pain, and will allow for the assessment of the bioactivity of cannabinoids on other larval disease models.14, 22–27 Finally, the ability to distinguish behavioral differences between THC and CBD may also provide an opportunity to further assess the different targets and mode of action of these two cannabinoids. Overall, the larval zebrafish model may prove useful for translational cannabinoid research.
Footnotes
Disclosure Statement
No competing financial interests exist.