
Abstract
Eigenmannia is a highly diverse genus within the Sternopygidae family, comprising 30 species. Due to its complex taxonomy, molecular analyses have been crucial for species delimitation within this group. Therefore, the present study presents a genetic analysis using sequences of the mitochondrial gene cytochrome c oxidase subunit 1 (COI) in specimens previously identified through alpha taxonomy as E. correntes (with unpublished data), E. virescens, and E. trilineata, originating from various locations within the Upper Paraná and Paraguay River basins in Brazil. The molecular data confirm the taxonomic complexity of the genus, as individuals morphologically identified as E. virescens and E. trilineata shared the same haplotype (H52). Furthermore, the results of the species delimitation tests suggest that specimens morphologically identified as E. virescens belong to the species E. trilineata. In addition, samples morphologically identified as E. correntes may correspond to more than one Operational Taxonomic Units (OTUs). Furthermore, the intraspecific Kimura-2-parameter (K2P) distances within the different studied populations are significant. This study has contributed valuable information about genetic diversity in Eigenmannia, emphasizing the importance of using integrative analyses to resolve taxonomic conflicts within the group. It also supports biogeographical studies and assists in biodiversity conservation efforts.
Introduction
Gymnotiformes comprises a natural group of electric fish, strictly freshwater, and endemic to the Neotropical Region. These fish originate from South America and later spread throughout Central America, 1 where their most remarkable diversity is found in the Amazon-Orinoco-Guianas basins (about 77% of the species). 2 The order is composed of five families: Apteronotidae, Gymnotidae, Hypopomidae, Rhamphichthyidae, and Sternopygidae.3,4 Within Sternopygidae, Eigenmannia Jordan & Evermann, 1896, stands out as the most species-rich genus, comprising 30 valid species. 5
Eigenmannia is a specious group, and taxonomic studies have recently advanced with the description of new species (e.g., E. bumba, E. cacuria, and E. robsoni by Dutra, Ramos, and Menezes 2022; E. dutrai by Peixoto, Pastana, and Ballen 2021; E. camposi, E. magoi, and E. zenuensis by Herrera-Collazos, Galindo-Cuervo, Maldonado-Ocampo, and Rincón-Sandoval 2020).6–8 Despite this considerable diversity and due to its highly conserved morphology and wide geographic distribution, 9 this genus has its taxonomy based on species groups, taking into account molecular evidence and morphological characteristics.6,10,11 This type of classification is characteristic in Neotropical fish species considered taxonomically complex. 12
The Eigenmannia species into two groups were reclassified 12 : Eigenmannia humboldtii Steindachner, 1878, and Eigenmannia trilineata López and Castello, 1966. However, the species E. virescens Valenciennes, 1836, had not been included in either of these groups. The authors stated that a taxonomic revision would be necessary to clarify its phylogenetic relationships. However, with the discovery and in-depth analysis of new species, and based on compiled data from Peixoto et al.,7,13 Peixoto and Wosiacki, 14 Peixoto and Waltz, 15 Dutra et al.,16–18 Peixoto and Ohara, 12 and Herrera-Collazos et al., 6 Dutra et al. 8 proposed a new rearrangement for the existing species groups within this genus. In the group of E. trilineata, they included 26 recognized species, including E. virescens.
In the E. humboldtii group, they formed the species Eigenmannia humboldtii, Eigenmannia limbata Schreiner and Miranda Ribeiro, 1903, and Eigenmannia nigra Mago-Leccia, 1994. However, the species Eigenmannia macrops Boulenger, 1897, was not included in either of these species groups.
Furthermore, the classification of organisms, especially Neotropical fish, should be based on the model of integrative taxonomy. Analyzing solely through morphological characteristics can lead to controversial groupings or designations due to cryptic and complex species with genotypic variations and different life stages. 19 These are some of the reasons why many genera and species of Gymnotiformes still lack revisions. 20 In light of this and based on the taxonomic complexity of Eigenmannia species, with some not formally described, we analyzed the mitochondrial gene cytochrome c oxidase subunit 1 (COI) from specimens collected in the Upper Paraná and Paraguay River regions, previously identified through alpha taxonomy as Eigenmannia correntes Campos-da-Paz and Queiroz, 2017, E. virescens, and E. trilineata, to understand the genetic variability within this group and conduct molecular species delimitation tests.
Materials and Methods
Biological samples
Eleven specimens of Eigenmannia were collected and previously identified by morphological characters as follows: E. virescens (n = 4), E. trilineata (n = 3), and E. correntes (n = 4). E. virescens and E. trilineata were collected from Dourado Stream (23°51′04″S 54°25′13.9″W), a tributary of the Iguatemi River, in the municipality of Mundo Novo, Mato Grosso do Sul State, in the Upper Paraná River basin. E. correntes at the species type-locality was sampled: Baixo Stream (17°42′46″S 54°21′25″W), a tributary of the Correntes River, in the municipality of Sonora, Mato Grosso do Sul State, in the Upper Paraguay River basin.
Genomic DNA extraction
DNA from tissue samples of the liver and muscle of the specimens was extracted using the Wizard® Genomics DNA Purification Kit (Promega®), following the manufacturer's instructions. To estimate the DNA concentration in each sample, agarose gel electrophoresis was performed using a 1% gel, and a comparison was made with known concentration λ phage DNA.
DNA amplification
In this step, the mitochondrial region of the COI gene was partially amplified using the primer pair FishF1 21 and FR1d. 22 The PCR was set up in 0.2 mL microtubes, using the extracted DNA (10 ng), Tris-KCl [20 mM Tris-HCl (pH 8.4), 50 mM KCl]; MgCl2 (1.5 mM); primers (2.5 μM each); dNTPs (0.1 mM each); Taq DNA Polymerase Platinum – Invitrogen (1U), and Milli-Q Water to complete the 25 μL solution volume. The amplification reaction for COI started with a denaturation cycle of 2 min at 94°C, followed by 35 cycles of 30 s of denaturation (94°C), 1 min and 30 s of annealing (52°C), 1 min and 30 s extension (72°C), and a final extension of 10 min (72°C).
The PCR products were analyzed on a 1% agarose gel, and the size of the obtained fragments was estimated using the 100 bp DNA ladder standard marker. The PCR products were purified following the protocol of Rosenthal et al., 23 and for the sequencing reaction, the Big Dye® Terminator kit was used. The sequencing was conducted by a private company, utilizing the Applied Biosystems® AB-3500 automatic sequencer.
Analysis of molecular data
The obtained sequences were edited and aligned by Clustal W, 24 using the BioEdit 7 and MEGA 7 programs, respectively.25,26 Sequence similarity indices were obtained by comparing the sequences with those from GenBank using the BLASTn tool. The analyses added all available COI region sequences belonging to Eigenmannia from the GenBank and Bold Systems databases (Supplementary Table S1). Sequences that compromised the final alignment size were excluded from the analysis, resulting in 81 sequences. The software DNA Sequence Polymorphism (DnaSP v6) calculated nucleotide and haplotype diversity indices, 27 and the software PopArt generated haplotype networks. 28 Intra- and interspecific genetic distance values and distances between haplotypes were calculated using the Kimura-2-parameter (K2P) model with the MEGA 7 program.
Barcode Gap Analysis in the Bold System to check maximum intraspecific genetic distance and minimum interspecific distance was performed according to Ratnasingham and Hebert. 29 The ModelFinder program 30 was used to select the best evolutionary model, and the gene tree with unique haplotypes was constructed in MEGA 7 using the maximum likelihood statistical method with 1000 bootstrap resamplings. The sequence BSFFA651-07, corresponding to Sternopygus macrurus Bloch and Schneider, 1801, was used as an outgroup.
Five species delimitation methods were used: Assemble Species by Automatic Partitioning (ASAP), 31 the Poisson Tree Process (PTP) and its Bayesian implementation (bPTP), 32 the General Mixed Yule Coalescent (GMYC) approach, 33 and Barcode Index Number (BIN). 34 For the GMYC delimitation test of Operational Taxonomic Units (OTUs), a phylogenetic tree was estimated using Bayesian inference with a relaxed lognormal clock and a birth-death speciation model on an arbitrary timescale, using BEAUTi and BEAST v.1.8.4. 35
A random tree was used as an initial tree for the MCMC searches, with each run consisting of 20 million generations and tree sampling done every 2000 generations. Tracer v1.7.1 36 was used to examine the distribution of log-likelihood scores, determine the stationary phase for each search, and determine whether additional runs were necessary to achieve convergence. All topologies sampled below the asymptote were discarded as part of a burn-in procedure (10%) in TreeAnnotator v1.8.4. The ASAP analysis was executed through its web interface (https://bioinfo.mnhn.fr/abi/public/asap/), and the PTP and bPTP analyses were conducted on the web server (https://species.h-its.org/ptp/). The GMYC delimitation analysis was performed on the GMYC server (species.h-its.org/gmyc/) using a single threshold method, with other parameters set as default. The BIN analysis was executed through its web interface (www.boldsystems.org/index.php/IDS_OpenIdEngine).
Results
Partial sequences of the COI gene were obtained from 11 Eigenmannia specimens: E. virescens (n = 4), E. trilineata (n = 3), and E. correntes (n = 4), and aligned with sequences available in the databases, resulting in a 598 bp fragment. The identity percentage of the sequences obtained in this study ranged from 94.13% to 100% compared to Eigenmannia sequences available in GenBank. Of the 4 individuals morphologically identified as E. virescens, individual number 194 exhibited an identity percentage of 99.67% to the species E. virescens (GU701791.1). In contrast, the other individuals, numbers 163, 167, and 170, displayed values ranging from 99.83% to 100% for E. trilineata from the database. Similar divergence was also observed among individuals of E. trilineata.
Samples 40 and 54 exhibited an identity percentage of 99.67% for the species E. virescens (GU701791.1). There are no records of COI gene sequences related to E. correntes in the database, making the first sequence for topotypes of the species. However, the identity percentages of sequences from E. correntes with sequences available in GenBank ranged from 94.13% to 96.51% for the species E. trilineata (MK464038.1) and E. vicentespelaea (KR491592.1), respectively.
Among the 92 analyzed sequences, 59 haplotypes were obtained, with 217 polymorphic sites. The haplotype diversity (h) and nucleotide diversity (π) indices were 0.987 and 0.09599, respectively. The most frequent haplotypes were H22 (E. nigra) and H27 (E. virescens), each with five specimens, followed by H8 (E. humboldtii; n = 4) and H23 (E. aff. virescens; n = 4). Considering the 11 specimens analyzed in this study, 9 haplotypes were obtained, mostly unique to each individual, except for haplotype H52, which was shared between E. trilineata and E. virescens (Fig. 1 and Supplementary Table S1). Furthermore, the haplotype network shows significant genetic differentiation between haplotype H56 and the other E. correntes haplotypes (K2P distance ranging from 6.8% to 8.7%). Moreover, haplotype H52 exhibited K2P distance values ranging from 12.2% to 12.6% compared to other analyzed specimens of E. virescens and E. trilineata (Supplementary Table S2).
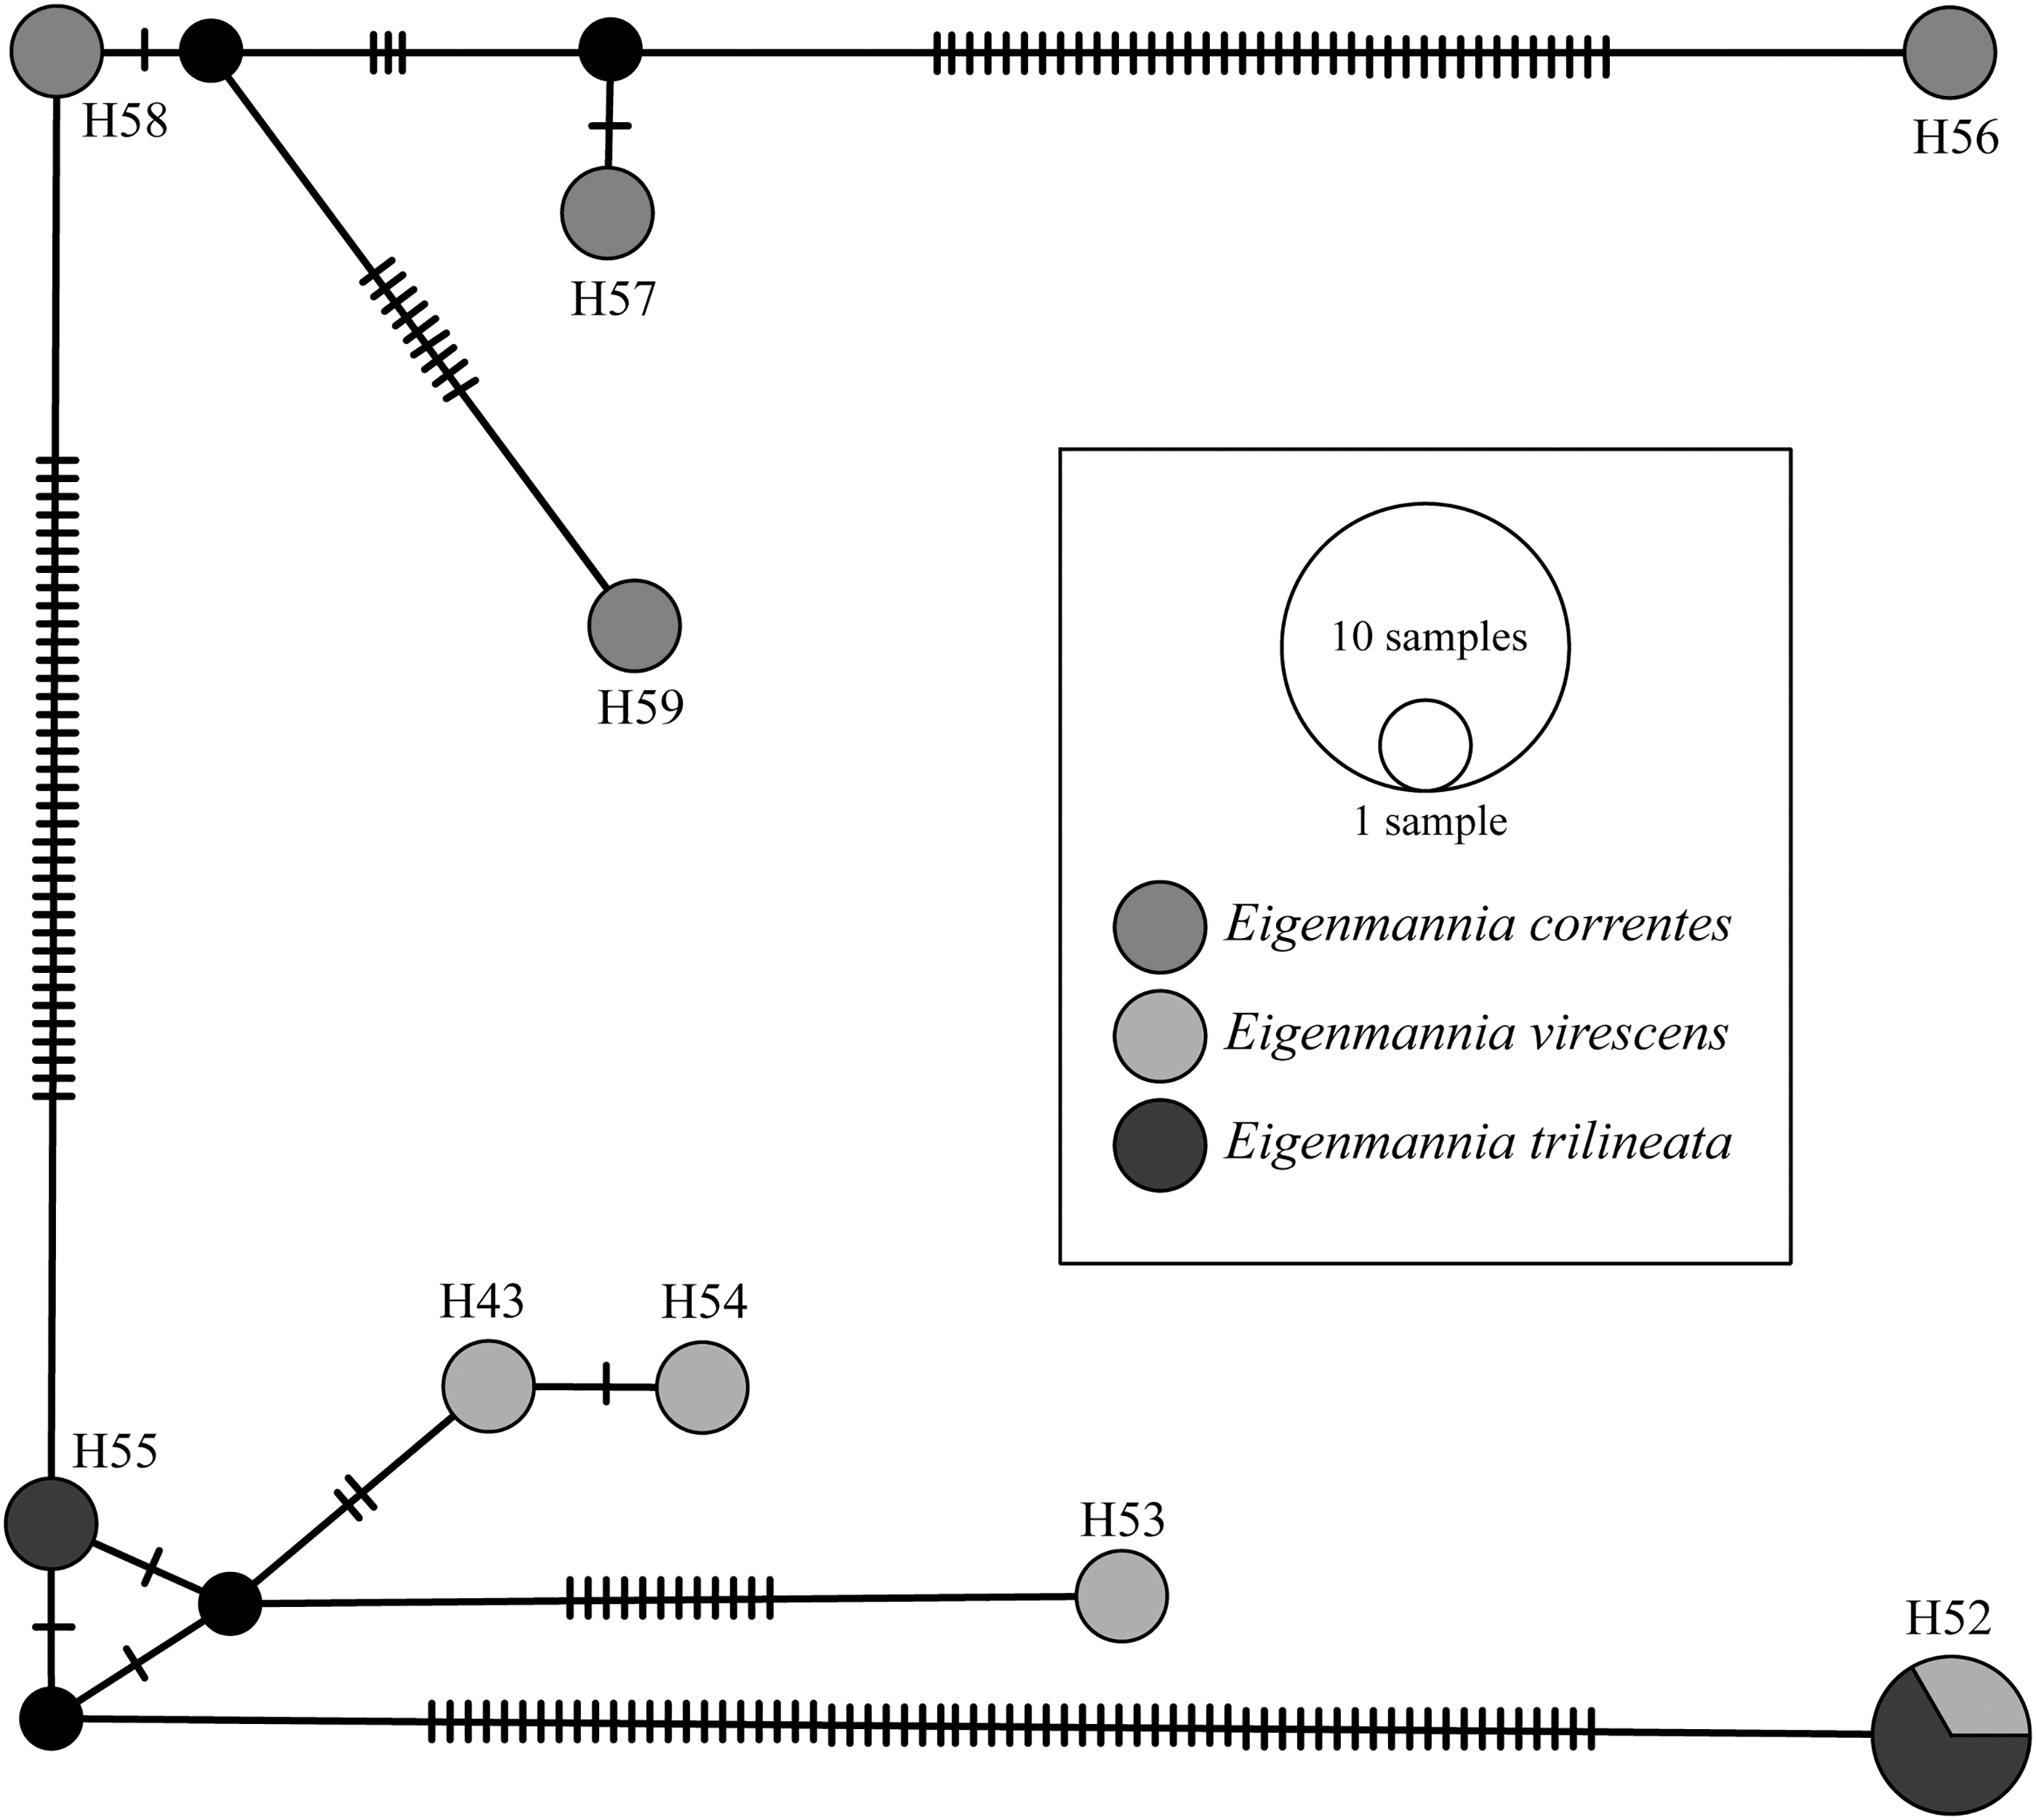
Haplotype network of Eigenmannia sequences with the COI marker.
Considering all sequences analyzed in this study, K2P distance values between individual haplotypes ranged from 0.2% to 22%, and the values obtained between species groups ranged from 5.9% to 17.4% (Table 1). Intraspecific distance values were significant, with noteworthy examples among the species analyzed in this study: E. virescens, E. trilineata, and E. correntes displayed 9.3%, 5.6%, and 4.5%, respectively.
Interspecific and Intraspecific K2P Distance, with the COI Gene, Obtained from Groups of Species Morphologically Identified as Representatives of the Genus Eigenmannia and the Outgroup Sternopygus macrurus
n/c, not computed.
Regarding Barcode Gap Analysis, both in the species E. virescens and E. trilineata, the maximum intraspecific variation, 12.55% and 12.14%, respectively, was highly superior to the Nearest Neighbor (NN) distance (Supplementary Table S3), which was zero for both species, leading to the absence of a gap in the barcode (Supplementary Fig. S1).
The best evolutionary model selected for constructing the gene tree from unique haplotypes was Tamura-Nei (TrN). According to the tree, individuals morphologically identified or present in the GenBank database as belonging to the same species were positioned in different clusters (Fig. 2), such as the case of E. virescens and E. trilineata specimens. The largest group mainly consisted of individuals belonging to E. trilineata, obtained from GenBank, as well as haplotypes H43 (E. virescens 167), H53 (E. virescens 170), H54 (E. virescens 163), and H55 (E. trilineata 12) obtained in this study.
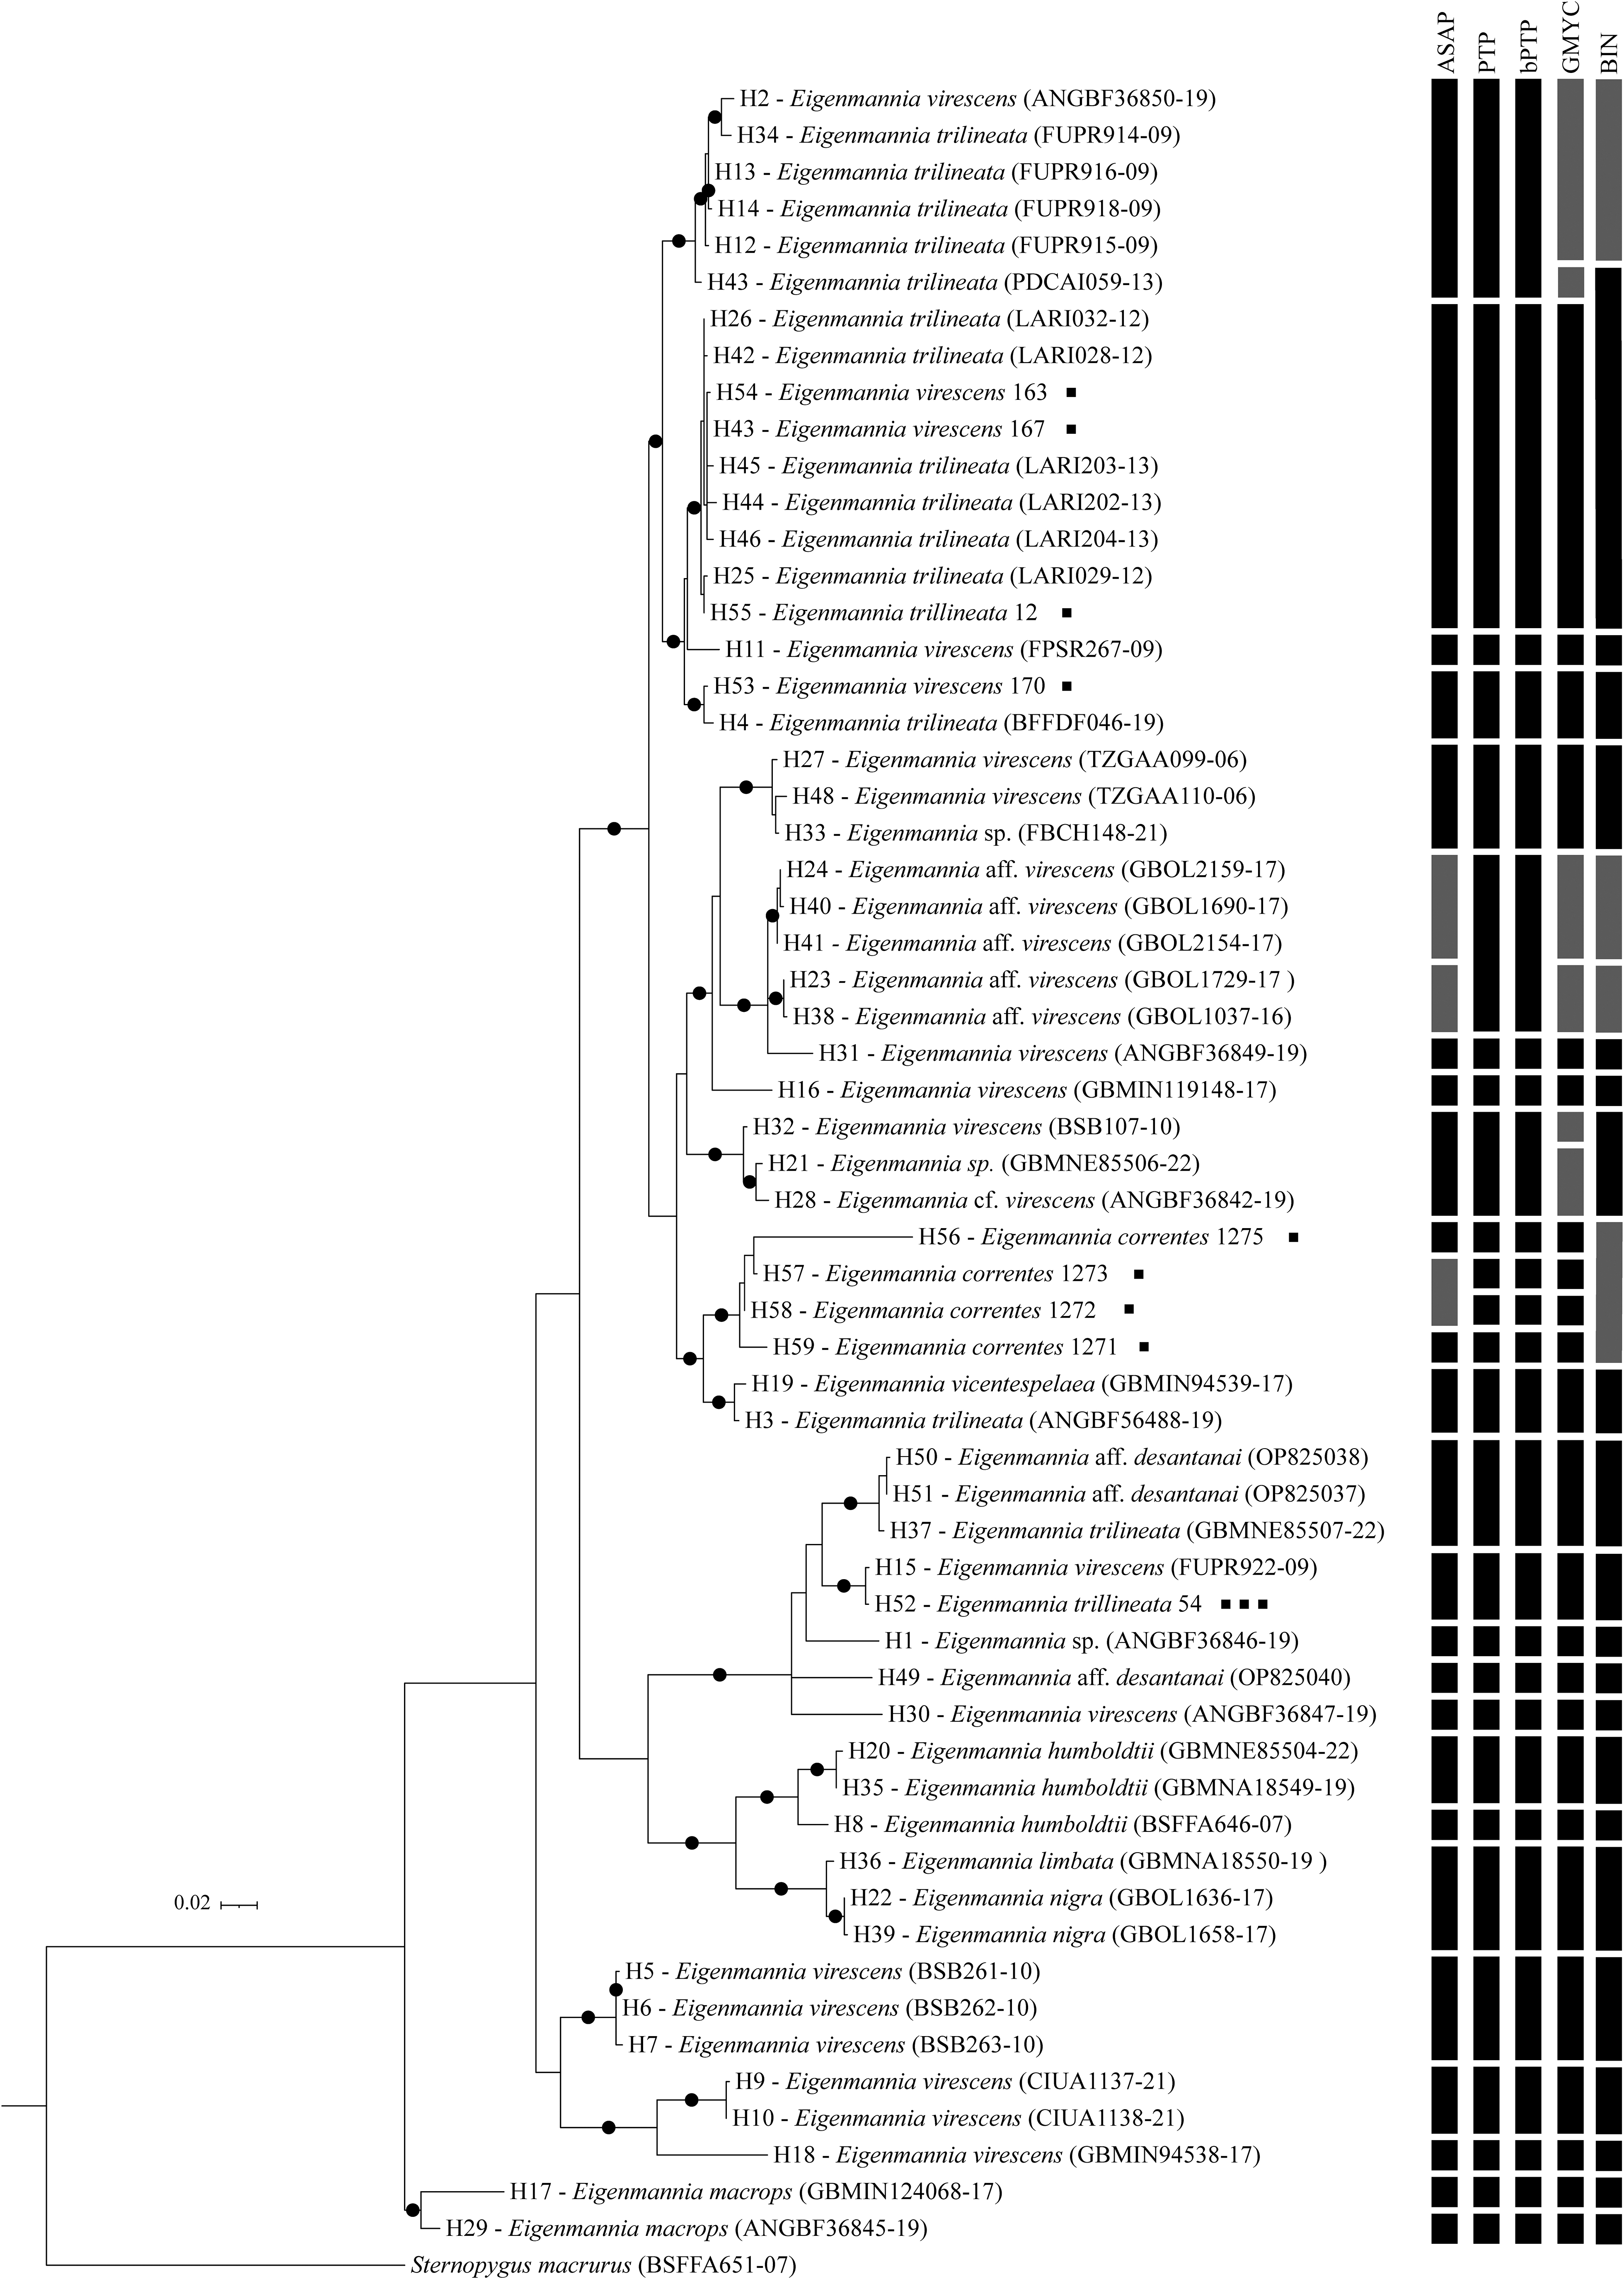
Genetic tree constructed with COI Eigenmannia sequences by the maximum likelihood statistical method with 1.000 bootstrap resampling. Sternopygus macrurus was used as an outgroup. The bars represent the results of the species delimiter analysis. The squares show the number of specimens from this study in their respective haplotypes. Circles represent bootstraps values >80.
The second major clade consisted mainly of E. virescens and Eigenmannia aff. virescens specimens, with their sister group formed by haplotypes H56, H57, H58, and H59 (E. correntes), E. vicentespelaea, and one E. trilineata specimen. Specimens of Eigenmannia aff. desantanai, E. humboldtii, E. nigra, E. limbata, E. virescens, E. trilineata, and the samples from this study with haplotype H52 (E. virescens 194, E. trilineata 40 and 54) formed a third group. Representatives of E. virescens and E. macrops constituted other distinct clusters.
The OTU delimitation tests (Fig. 2) using the ASAP, PTP, and bPTP methods delimited 27 possible OTUs for Eigenmannia, with PTP and bPTP yielding the same results. The GMYC method delimited 30 OTUs for the genus. Meanwhile, the BIN method determined 25 OTUs. All methods indicated that the specimens in our study, identified as E. virescens 163 (haplotype H54) and 167 (haplotype H43) belong to E. trilineata, along with individual 12 (haplotype H55) (with distances of up to 0.7% between the haplotypes). For the specimen E. virescens 170 (haplotype H53), all methods confirm its belonging to the same OTU as individuals with haplotype H4 (E. trilineata - BFFDF046-19 and ANGBF56519-19) (with a distance of 0.7%).
Regarding the specimens morphologically identified as E. correntes, the delimitation methods suggest variations about the number of OTUs. PTP, bPTP, and GMYC indicate that each individual constitutes a distinct OTU. ASAP indicates three distinct OTUs, and BIN only one OTU for the four specimens. Finally, the results from all four delimitation methods confirm that haplotype H52, represented by three individuals in this study (E. virescens 194, E. trilineata 40 and 54), belongs to the same OTU as haplotype H15, morphologically classified as E. virescens (FUPR922-09, FUPR924-09, and FUPR919-09).
Discussion
In the last decade, species descriptions in Eigenmannia have significantly increased. 5 Nevertheless, the genus is still considered taxonomically complex at the alpha level.6,7,12–14,18,37 This complexity becomes apparent when examining the results of the gene tree and the conducted delimitation tests, where specimens identified as belonging to the same species are positioned in different clusters and form distinct OTUs (Fig. 2). In addition, noteworthy are the substantial values of intraspecific genetic distance found with the COI marker for individuals of the same species (5.6% for E. trilineata, 9.3% for E. virescens, and 4.5% for E. correntes).
According to Hebert et al., 38 genetic distance values exceeding 2% would be appropriate for segregating individuals into distinct species. However, the significant values of intraspecific distance found in this study are consistent with the high values observed in other works involving Eigenmannia and using the COI marker. This may suggest a potential case of cryptic speciation, considering the genus comprises a species complex. De Carvalho et al. 39 found profound intraspecific divergences in several analyzed species, particularly E. virescens, with a value of 9%, which is close to what we obtained in our study.
Similarly, de Araújo et al. 40 examined a population of E. desantanai and found intraspecific distance values of 7.1%. The substantial genetic distance values found in Eigenmannia in analyses using the COI marker are also observed in other fish genera and species, as seen in Tigriopus californicus, 41 Rhincalanus nasutus, 42 and Moenkhausia, 39 with distance values of 23%, 24.35%, and 22.9%, respectively. These intraspecific genetic divergences may arise due to phylogeographic patterns 41 or the species in question being part of a species complex. 42
The fact that Eigenmannia species exhibit relatively indistinct morphological patterns complicates their classification, leading to discussions about the existing species groups within this genus.12,18 Considering the arrangement of species groups proposed by Dutra et al., 8 with E. humboldtii comprising three species and E. trilineata encompassing the most incredible diversity of species, including E. virescens, E. trilineata, E. correntes, and E. vicentespelaea, we can explain the proximity of E. correntes specimens to E. trilineata and E. vicentespelaea found in this study, forming a sister group to E. virescens. Furthermore, considering the results of the delimitation tests, we can highlight the presence of at least 16 OTUs within the E. trilineata complex, significantly expanding the number of species within the complex.
Despite the similarities found in the morphological characteristics of Neotropical fish, especially in the genus Eigenmannia, cytogenetic studies conducted by Fernandes et al.,43,44 demonstrated distinct karyotypic features between E. trilineata and E. virescens collected from the Dourado stream, a tributary of the Iguatemi River in Mato Grosso do Sul, the same locality as the present study. In E. trilineata specimens, the authors observed a karyotype with 2n = 31 chromosomes in males and 32 in females, with the X1X1X2X2/X1X2Y sex chromosome system. In contrast, in E. virescens, the karyotype exhibited 2n = 38 chromosomes, with the ZZ/ZW sex chromosome system.
In Eigenmannia, diploid numbers range from 2n = 28, 31/32, 34, and 36 to 38 chromosomes.40,43–55 This karyotypic variability demonstrates the differences within this complex group of species, which leads us to suggest that several species with similar morphologies may indeed have been observed but classified within existing and widely distributed common groups.
According to Campos-Da-Paz and Queiroz, 56 E. correntes belongs to the species group of E. trilineata due to its shared conspicuous black upper lateral stripe on the flank. Due to the subterminal mouth position, E. correntes resembles E. vicentespelaea, E. waiwai, and E. besouro. This resemblance could explain why E. correntes formed a sister group relationship with E. vicentespelaea in the genetic tree. However, these two species differ in several morphological characteristics. For instance, E. correntes has a different number of premaxillary teeth (17–20 in three irregular rows) than E. vicentespelaea (25–26 in four rows). The longitudinal scale series above the lateral line also differ (11–12 in E. correntes vs. 7–8 in E. vicentespelaea).
Other differences include the total number of anal fin rays (143–164 in E. correntes vs. 169–191 in E. vicentespelaea) and the number of dentary teeth (16–18 in two irregular rows in E. correntes vs. 38–45 in three or four rows in E. vicentespelaea). Although the four specimens of E. correntes in this study formed a unique group in the genetic tree, the delimitation tests did not agree on the number of OTUs within this group.
The results provided by this study have added valuable insights into the genetic diversity within Eigenmannia. These findings underscore the significance of using integrative analyses that combine morphological, cytogenetic, and molecular data to resolve taxonomic conflicts, identify species, and enhance our understanding of the biological diversity within the genus.
Conclusion
The complexity and genetic diversity within Eigenmannia are highlighted in this study, where the species delimitation tests indicate the presence of many OTUs within the E. trilineata complex. Notably, the species E. trilineata, E. virescens, and E. correntes analyzed in this study are emphasized. Furthermore, the molecular marker COI analyses reveal issues with the morphological identification of specimens, particularly in databases. We emphasize the importance of integrative analyses to resolve group taxonomic conflicts and support biogeographical studies, aiding biodiversity conservation efforts.
Footnotes
Acknowledgments
The authors thank Dr. Weferson Junio da Graça from the Universidade Estadual de Maringá (UEM) for the taxonomic identification of the specimens of E. virescens and E. trilineata, and the Coordenação de Aperfeiçoamento de Pessoal de Nível Superior (CAPES) for funding. We also thank the Universidade Estadual de Maringá for the logistical and experimental support.
Authors' Contribution
Analysis and interpretation of molecular data were performed by R.C.M. and L.I.R. and coordinated by A.V.O.; M.M.R.V. and F.R.C. contributed to the collection and identification of specimens of E. correntes. This study was coordinated and designed, with financial support by A.L.B.P.C., C.A.F., and L.A.B.C. All authors contributed to the article's conceptualization, analysis, writing, and revision.
Availability of Data and Material
Data generated or analyzed during this study consist of 11 fish specimens. Voucher specimens of E. virescens (NUP 19916), E. trilineata (NUP 16151), and E. correntes (CITL 470) were deposited in fish collections: Núcleo de Pesquisas em Limnologia, Ictiologia e Aquicultura (NUPELIA), Universidade Estadual de Maringá, Paraná, Brazil, and Coleção Ictiológica de Três Lagoas (CITL), Universidade Federal de Mato Grosso do Sul, Três Lagoas Campus, Três Lagoas, Mato Grosso do Sul, Brazil. Access to the genetic heritage was authorized by the Sistema Nacional de Gestão do Patrimônio Genético e do Conhecimento Tradicional Associado (SISGEN) (access code A8FA1D4). In addition, all nucleotide sequences generated in this study were deposited in GenBank (www.ncbi.nlm.nih.gov/genbank/) (GenBank accession numbers: OQ925856-OQ925866) and Bold System (www.boldsystems.org/) (acession numbers: EIG001-23-EIG011-23); all GenBank and Bold Systems accession numbers used in our analysis are also listed individually in ![]() .
.
Ethics Approval
This study was conducted strictly with the authorization of the Sistema de Informação e Autorização da Biodiversidade (SISBIO), which granted licenses number 64619 and 74306, and the approval by the Comitê de Ética no Uso de Animais of the Universidade Estadual de Mato Grosso do Sul (License Number: Protocol 023/2018 and 006/2018 – CEUA/UEMS).
Consent for Publication
All authors read and approved the final version of the article for publication.
Disclosure Statement
No competing financial interests exist.
Funding Information
This study was funded by the Coordenação de Aperfeiçoamento de Pessoal de Nível Superior (CAPES) – Finance Code 001.
References
Supplementary Material
Please find the following supplemental material available below.
For Open Access articles published under a Creative Commons License, all supplemental material carries the same license as the article it is associated with.
For non-Open Access articles published, all supplemental material carries a non-exclusive license, and permission requests for re-use of supplemental material or any part of supplemental material shall be sent directly to the copyright owner as specified in the copyright notice associated with the article.