
Abstract
Using integrative tools can be effective for species identification, especially in complex groups like Astyanax. Astyanax bimaculatus group is composed of six valid species, including A. lacustris. “A. altiparanae”, “A. asuncionensis”, and “A. jacuhiensis” are considered as junior synonyms of A. lacustris. Seeking to test the operational taxonomic unit (OTU) status of the junior synonyms of A. lacustris (“A. altiparanae”, “A. asuncionensis”, and “A. jacuhiensis”), we used analyses through mitochondrial DNA (COI and Cytb), cytogenetic markers (classical and molecular), and morphometry (“truss network”). Analysis of mitochondrial DNA sequences separated A. lacustris from the other synonymized species. The cytogenetic and morphometric analyses did not corroborate the synonymization and suggest that besides A. lacustris, the OTUs A. altiparanae, A. asuncionensis, and A. jacuhiensis are valid species. The analysis of different characters proposed by the integrative taxonomy used on the same individuals could provide greater reliability and minimize the underestimation of biodiversity.
Introduction
Approximately 6,200 species of freshwater fish are found in the neotropics, mainly in the Brazilian watersheds, which have regions of endemism and several biodiversity hotspots. 1 Within this Neotropical biodiversity, Characiformes and Characidae are among the most representative groups in number of species.1,2
In Characidae, Astyanax comprises a diverse and taxonomically uncertain clade, with species spread in large river systems such as the Rio de La Plata, São Francisco, and Magdalena rivers, and in small basins, including coastal regions of Central and South Americas, headwaters and tributaries to the Amazonas and Orinoco systems. 3 Astyanax was classified in Tetragonopterinae, afterward it was considered as incertae sedis in Characidae 4 and is currently included in Stethaprioninae.3,5
According to Terán et al., 3 many species included in Astyanax are difficult to diagnose and often identified only at the generic level or in species complexes, such as Astyanax bimaculatus (Linnaeus 1758) group, Psalidodon fasciatus (Cuvier 1819) gr., or P. scabripinnis (Jenyns 1842) gr. Owing to the great diversity of species and difficulties in their identification, many authors recognized Astyanax as a non-monophyletic unit.5–9
In a recent taxonomic review, Astyanax was reorganized into eight genera and can be diagnosed from the remaining Stethaprioninae by the following combination of characters: laterosensorial pore anterior to dilatator fossa oriented lateroventrally, rhinosphenoid (when present) lacking a dorsal expansion between olfactory nerves, presence of circuli on posterior field of scales, presence of an anterior branch of the tubule for passage of blood vessels on lamellar portion of maxilla, naked caudal fin, and a complete lateral line. 3
Among the Astyanax species, the A. bimaculatus group is composed of six valid species: A. abramis (Jenyns 1842), A. bimaculatus, A. lacustris (Lütken 1875), A. maculisquamis Garutti & Britski 1997, A. validus Géry, Planquette & Le Bail 1991, and A. orbignyanus (Valenciennes 1850), besides A. altiparanae, A. asuncionensis, and A. jachuiensis considered as junior synonyms of A. lacustris according to Lucena and Soares. 10 Despite that conclusion, the authors recommend further research on the mechanisms that isolated these lineages within the subgroup, 10 since the speciation phenomenon can occur without apparent morphological speciation or that morphological similarities may also arise after genetic differentiation. Gavazzoni et al., 11 using basic and molecular cytogenetic analyses, found significant differences that did not corroborate the proposed synonymization and suggest that these are four different species.
Recently, in situations where traditional taxonomy is not enough to delimit or identify species, the integrative taxonomy approach has shown robust results.12,13 The proposed taxa based on integrated data are better defined with hypotheses better supported for the development of other studies, as poorly defined species lead to incorrect answers in any study area, which highlight its importance. 14 Furthermore, the degree of confidence in species based on different types of data is much higher than for species based on only one type of data as is done in traditional taxonomy. 15 Therefore, integrative taxonomy does not replace traditional taxonomy, actually complements it by speeding up the process and improving rigor. 12 In this approach, different methods of identification and delimitation of species are used simultaneously and in a complementary way, such as phylogeography, morphology, genetics, ecology, development, and behavior, among others. 16
Among the identification methods used in integrative taxonomy, cytogenetics plays a highlighted role in some fish groups, offering great potential for understanding the structure and composition of the genetic material, in addition to several other contributions to taxonomy and evolution.15,17,18 Furthermore, mitochondrial DNA analysis, using genes such as cytochrome oxidase I (COI) and cytochrome b (Cytb), brings significant contributions to the identification of species and verification of genetic diversity in several groups of Neotropical fish.8,19,20
Given the taxonomic problem involving the operational taxonomic units (OTUs, groups of closely related individuals) “A. jacuhiensis”, “A. asuncionensis”, “A. altiparanae”, and A. lacustris, we intended, through the joint use of cytogenetics, mitochondrial genome sequences, and morphometric analysis, to verify the status of these OTUs. Additionally, the valid species A. abramis (Jenyns, 1842) also has its data (chromosomal, mitochondrial genome sequences, and morphometry) compared, since this species (1) belongs to the A. bimaculatus group and (2) it occurs in sympatry with “A. asuncionensis” and partial COX1 sequences used for Barcoding do not distinguish it from the others synonymized above. 21
Materials and Methods
Sampling
Voucher specimens were housed in the Coleção Ictiológica do Núcleo de Pesquisas em Limnologia, Ictiologia e Aquicultura, Universidade Estadual de Maringá, Maringá, Brazil (NUP) and identified as A. lacustris and junior synonyms “A. altiparanae”, “A. asuncionensis”, and “A. jacuhiensis” (for more information, see Gavazzoni et al.), 11 A. abramis, and P. fasciatus (Table 1). Access to the genetic heritage of the species was authorized by the Sistema Nacional de Gestão do Patrimônio Genético—SISGEN, according to registration no A6CED17. This study was carried out in strict accordance with the recommendations of the Guide for the Care and Use of Laboratory Animals, approved by the Committee on the Ethics of Animal Experiments of the Universidade Estadual do Oeste do Paraná (license number: Protocol 13/09—CEEAAP/Unioeste). All individuals were anesthetized and sacrificed by an overdose of clove oil, following Griffiths. 22
Sampling Used in This Study
Cytogenetic analyses
For cytogenetic analyses, we used 10 specimens of A. lacustris; the other species of the A. bimaculatus complex cited here were published by Gavazzoni et al. 11 Chromosome preparations were obtained from cells of the anterior region of the kidney. 23 Nucleolar organizing regions (NORs) were revealed by silver impregnation. 24 Heterochromatin regions were determined following the C-banding technique, 25 with staining modifications. 26 Physical mapping of 5S ribosomal DNA (rDNA) and 18S rDNA was carried out by fluorescence in situ hybridization (FISH) 27 and modification, 28 using DNA probes obtained from Megaleporinus obtusidens (cited as Leporinus elongatus) 29 and Prochilodus argenteus, 30 respectively. Probes were labeled by the nick translation method with digoxigenin-11-dUTP (5S rDNA) and biotin-16-dUTP (18S rDNA) (Roche, Mannheim, Germany). Detection of signals was performed with anti-digoxigenin—rhodamine (Roche) for the 5S rDNA, and the signals of 18S rDNA were detected using avidin—fluorescein isothiocyanate, with the second round of signal amplification by using biotinylated anti-avidin (Sigma-Aldrich, St Louis, MO, USA), with the chromosomes counterstained with 4ʹ,6-diamidino-2-phenylindole (Sigma; 50 μg/mL). Metaphases were photographed using a BX 61 epifluorescence microscope, coupled with an Olympus DP 71 digital camera (Olympus America) with the Olympus DP Controller software v.3.2.1.276. Chromosomes were classified and organized in metacentric (m), submetacentric (sm), subtelocentric (st), and acrocentric (a). 31 The fundamental number (FN; the number of visible chromosomal arms per set of chromosomes) was calculated considering m, sm, and st chromosomes as having two arms, and a chromosomes as having only one chromosome arm.
Molecular analyses
For molecular analyses of mitochondrial data, we used two specimens of A. abramis, two specimens of “A. asuncionensis”, two specimens of “A. altiparanae”, two specimens of “A. jacuhiensis”, three specimens of A. lacustris, and one specimen of P. fasciatus as the outgroup. Sequences from the GenBank were not used, since the purpose of the work is analysis of different characters by the integrative taxonomy using in the same individuals with the three methodologies (cytogenetics, molecular, and morphometric).
Extraction of total DNA from hepatic tissue preserved in 100% ethanol was performed with the GenElute Mammalian Genomic DNA Miniprep Kit (Sigma-Aldrich) following the manufacturer’s recommendations. The genomic DNA was quantified on a nanospectrophotometer NanoK (Kasvi) and then diluted to a concentration of 10 ng/μL.
For amplification of the mitochondrial COI gene, we used the primers FISH F1 and FISH R1. 32 The COI gene was amplified through a PCR containing 5 μL of the reaction buffer (5×), 1.3 μL of MgCl2 (25 mM), 0.5 μL of dNTP Mix (10 mM), 1 μL of each primer, 9 μL of DNA (10 ng/μL), 0.2 μL of Taq polymerase, and 7 μL of H2O Mili-Q. The PCR conditions were 95°C (5 min), 36 cycles of 94°C (30 s), 54°C (30 s), and 72°C (1 min), and a final extension step for 10 min at 72°C. For amplification of the mitochondrial Cytb gene, we used the primers AnosCytbF and AnosCytbR. 33 The Cytb gene was amplified through a PCR containing 5 μL of the reaction buffer (10×), 1.5 μL of MgCl2 (50 mM), 8 μL of dNTP Mix (1.25 mM), 2 μL of each primer, 2 μL of DNA (50 ng/μL), 0.4 μL of Taq polymerase, and 27.1 μL of H2O Mili-Q. The PCR conditions were 94°C (4 min), 35 cycles of 94°C (1 min), 53°C (90 s), and 72°C (1 min), and a final extension step for 5 min at 72°C. The final PCR products were purified using the Wizard Kit SV Gel and PCR Clean-up System (Promega, Madison, WI, USA), according to the manufacturer’s guidelines. Samples were sequenced by Sanger Method at the Centro de Pesquisa do Genoma Humano, Universidade de São Paulo, Brazil, using the ABI 3730 DNA Analyzer (Life Technologies—Applied Biosystems Technology. Sequencing). The reactions were performed using the BigDye Terminator v3.1 Cycle Sequencing Kit.
Sequences were edited with BioEdit 34 and aligned with Clustal Omega software. 35 The genetic divergence between the sequences, and the distances within and between species were calculated using the MEGA X software. 36 Saturation signal was checked by DAMBE v.7.0.28, 37 and the best-fitting model was chosen using the Akaike information criterion in jModelTest2. 38 The evolutionary history (COI, Cytb, and COI+Cytb/concatenated) was inferred using the neighbor-joining (NJ) method based on the Kimura two-parameter model, the maximum likelihood (ML) method based on the Hasegawa–Kishino–Yano model with Gamma distribution [five categories (+G, parameter = 0.2988)], and the maximum parsimony (MP) method based on nucleotide substitutions, with 1,000 bootstrap replicates, conducted in MEGA X. 36 Species delimitation was performed using Assembly Species by Automatic Partitioning (ASAP) method (available at: https://bioinfo.mnhn.fr/abi/public/asap/), 39 using as input a fasta file; the Kimura two-parameter distance model (K80) was analyzed in the final result. This method of species delimitation is based on pairwise genetic distances by proposing species partitions ranked by a scoring system with no biological prior insight of intraspecific diversity.
Morphometric analyses
We analyzed 40 specimens belonging to 5 species, A. abramis: NUP 14581, 6, 69.8–99.6 mm SL; “A. altiparanae”: NUP 17156, 10, 65.5–93.5 mm SL; “A. asuncionensis”: NUP 14584, 10, 80.5–102.1 mm SL; “A. jacuhiensis”: NUP 14927, 4, 85.5–102.5 mm SL; A. lacustris: NUP 22599, 10, 62.4–75.7 mm SL; and P. fasciatus: NUP 22600, 10, 70.2–110.1 mm SL. Morphological analyses usual for taxonomic studies of Astyanax were performed for comparative purposes. The measurements were taken from the left side of the specimens using digital calipers.40,41 In addition, measurements were taken of trusses, 42 with the determination of 10 external anatomical landmarks, representing the shape of the fish, thus forming the network of trusses with 21 measurements taken between the landmarks (Fig. 1).
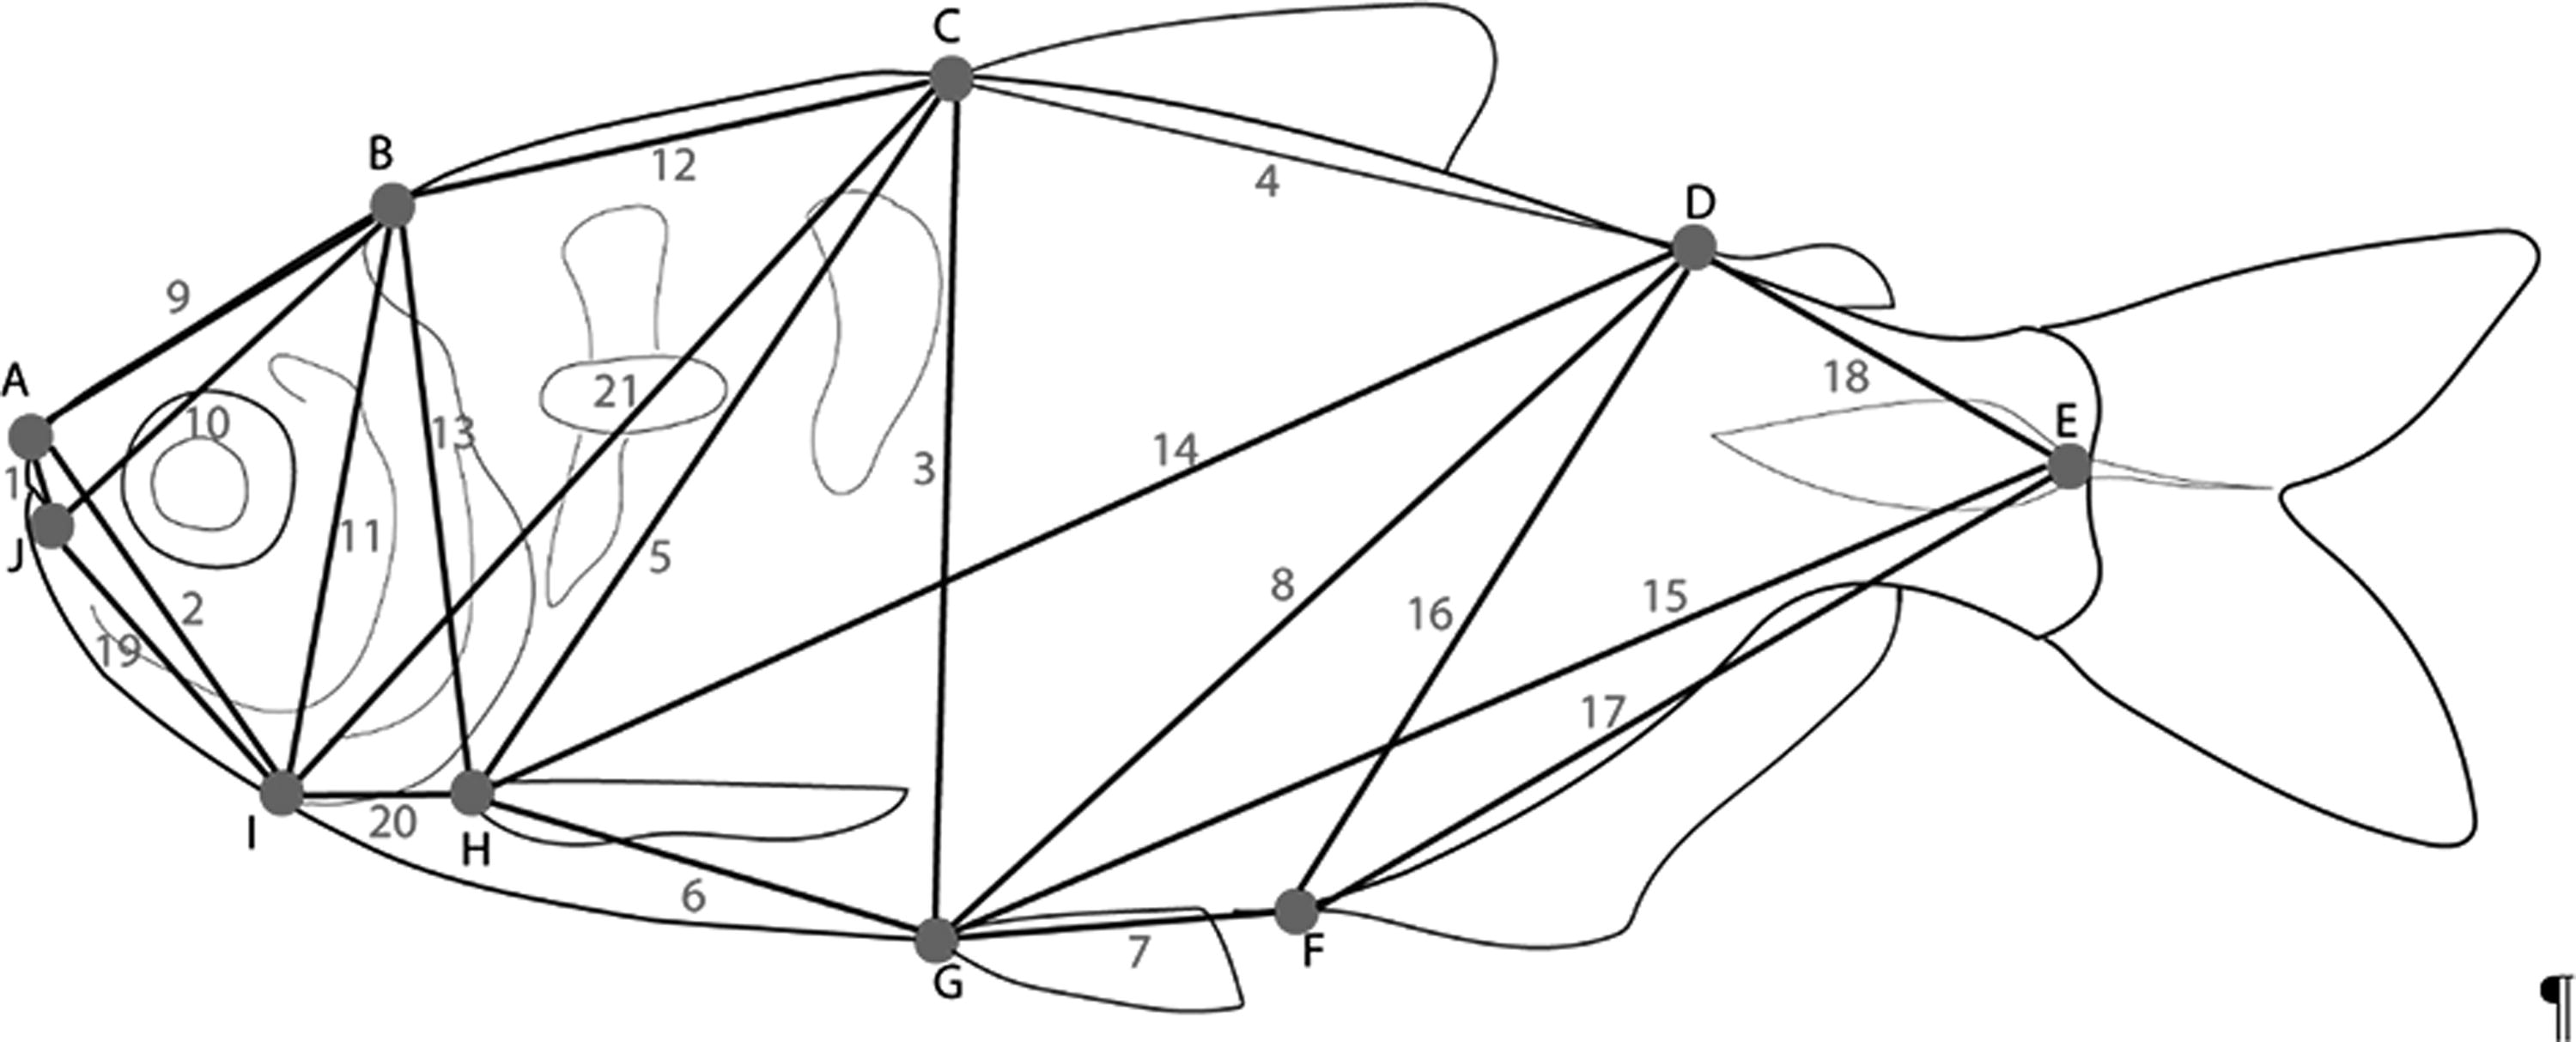
Morphological landmarks (letters used in a network of trusses and measurements (numbers)). A-J: distance between snout and maxillar commissure (1); A-I: distance between snout and isthmus (2); C-G: distance between dorsal and pelvic fins (3); C-D: distance between dorsal and adipose fins (4); C-H: distance between pectoral and dorsal fins (5); G-H: distance between pectoral and pelvic fins (6); F-G: distance between pelvic and anal fins (7); D-G: distance between pelvic and adipose fins (8); A-B: distance between snout and supraoccipital (9); B-J: distance between maxillar commissure and supraoccipital (10); B-I: distance between isthmus and supraoccipital (11); B-C: distance between supraoccipital and dorsal-fin (12); B-H: distance between pectoral-fin and supraoccipital (13); D-H: distance between pectoral and adipose fins (14); E-G: distance between pelvic-fin and caudal peduncle (15); D-F: distance between anal and adipose fins (16); E-F: distance between anal-fin and caudal peduncle (17); E-D: distance between adipose-fin and caudal peduncle (18); I-J: distance between isthmus and maxillar commissure (19); H-I: distance between isthmus and pectoral-fin (20); C-I: distance between isthmus and dorsal-fin (21).
Data were subjected to a linear discriminant analysis (LDA), using the PAST 4.03 Software, which aims to determine which variables have greater weight for separating these species. A data transformation was performed using the Microsoft Excel (2019) software, where the truss measurements selected by the LDA were transformed into percentages in relation to each of the measurements contained in the table, in order to detect a combination of diagnostic variables, and are shown in the text only when they do not have overlapping values.
Results
Cytogenetics analyses
Chromosomal analysis in A. lacustris evidenced diploid number equal to 50 chromosomes (10m + 26sm + 8st + 6a, FN = 94) for male and female (Fig. 2a). A single pair of NORs was located in a terminal position on the short arm of chromosome a pair 23, as confirmed by 18S rDNA-FISH (Fig. 2a, b in box). The C-banding showed centromeric heterochromatin blocks in pairs 2, 3, and 4, interstitial-proximal heterochromatin on the q arm of pairs 7, 8, 9, 10, 11, 12, 14, 15, 16, 19, 22, and 23, in addition to coincident with NORs (Fig. 2b). FISH revealed a single 5S rDNA site in centromeric position in the m pair 4 (in box Fig. 2b). The results are summarized in Table 2.
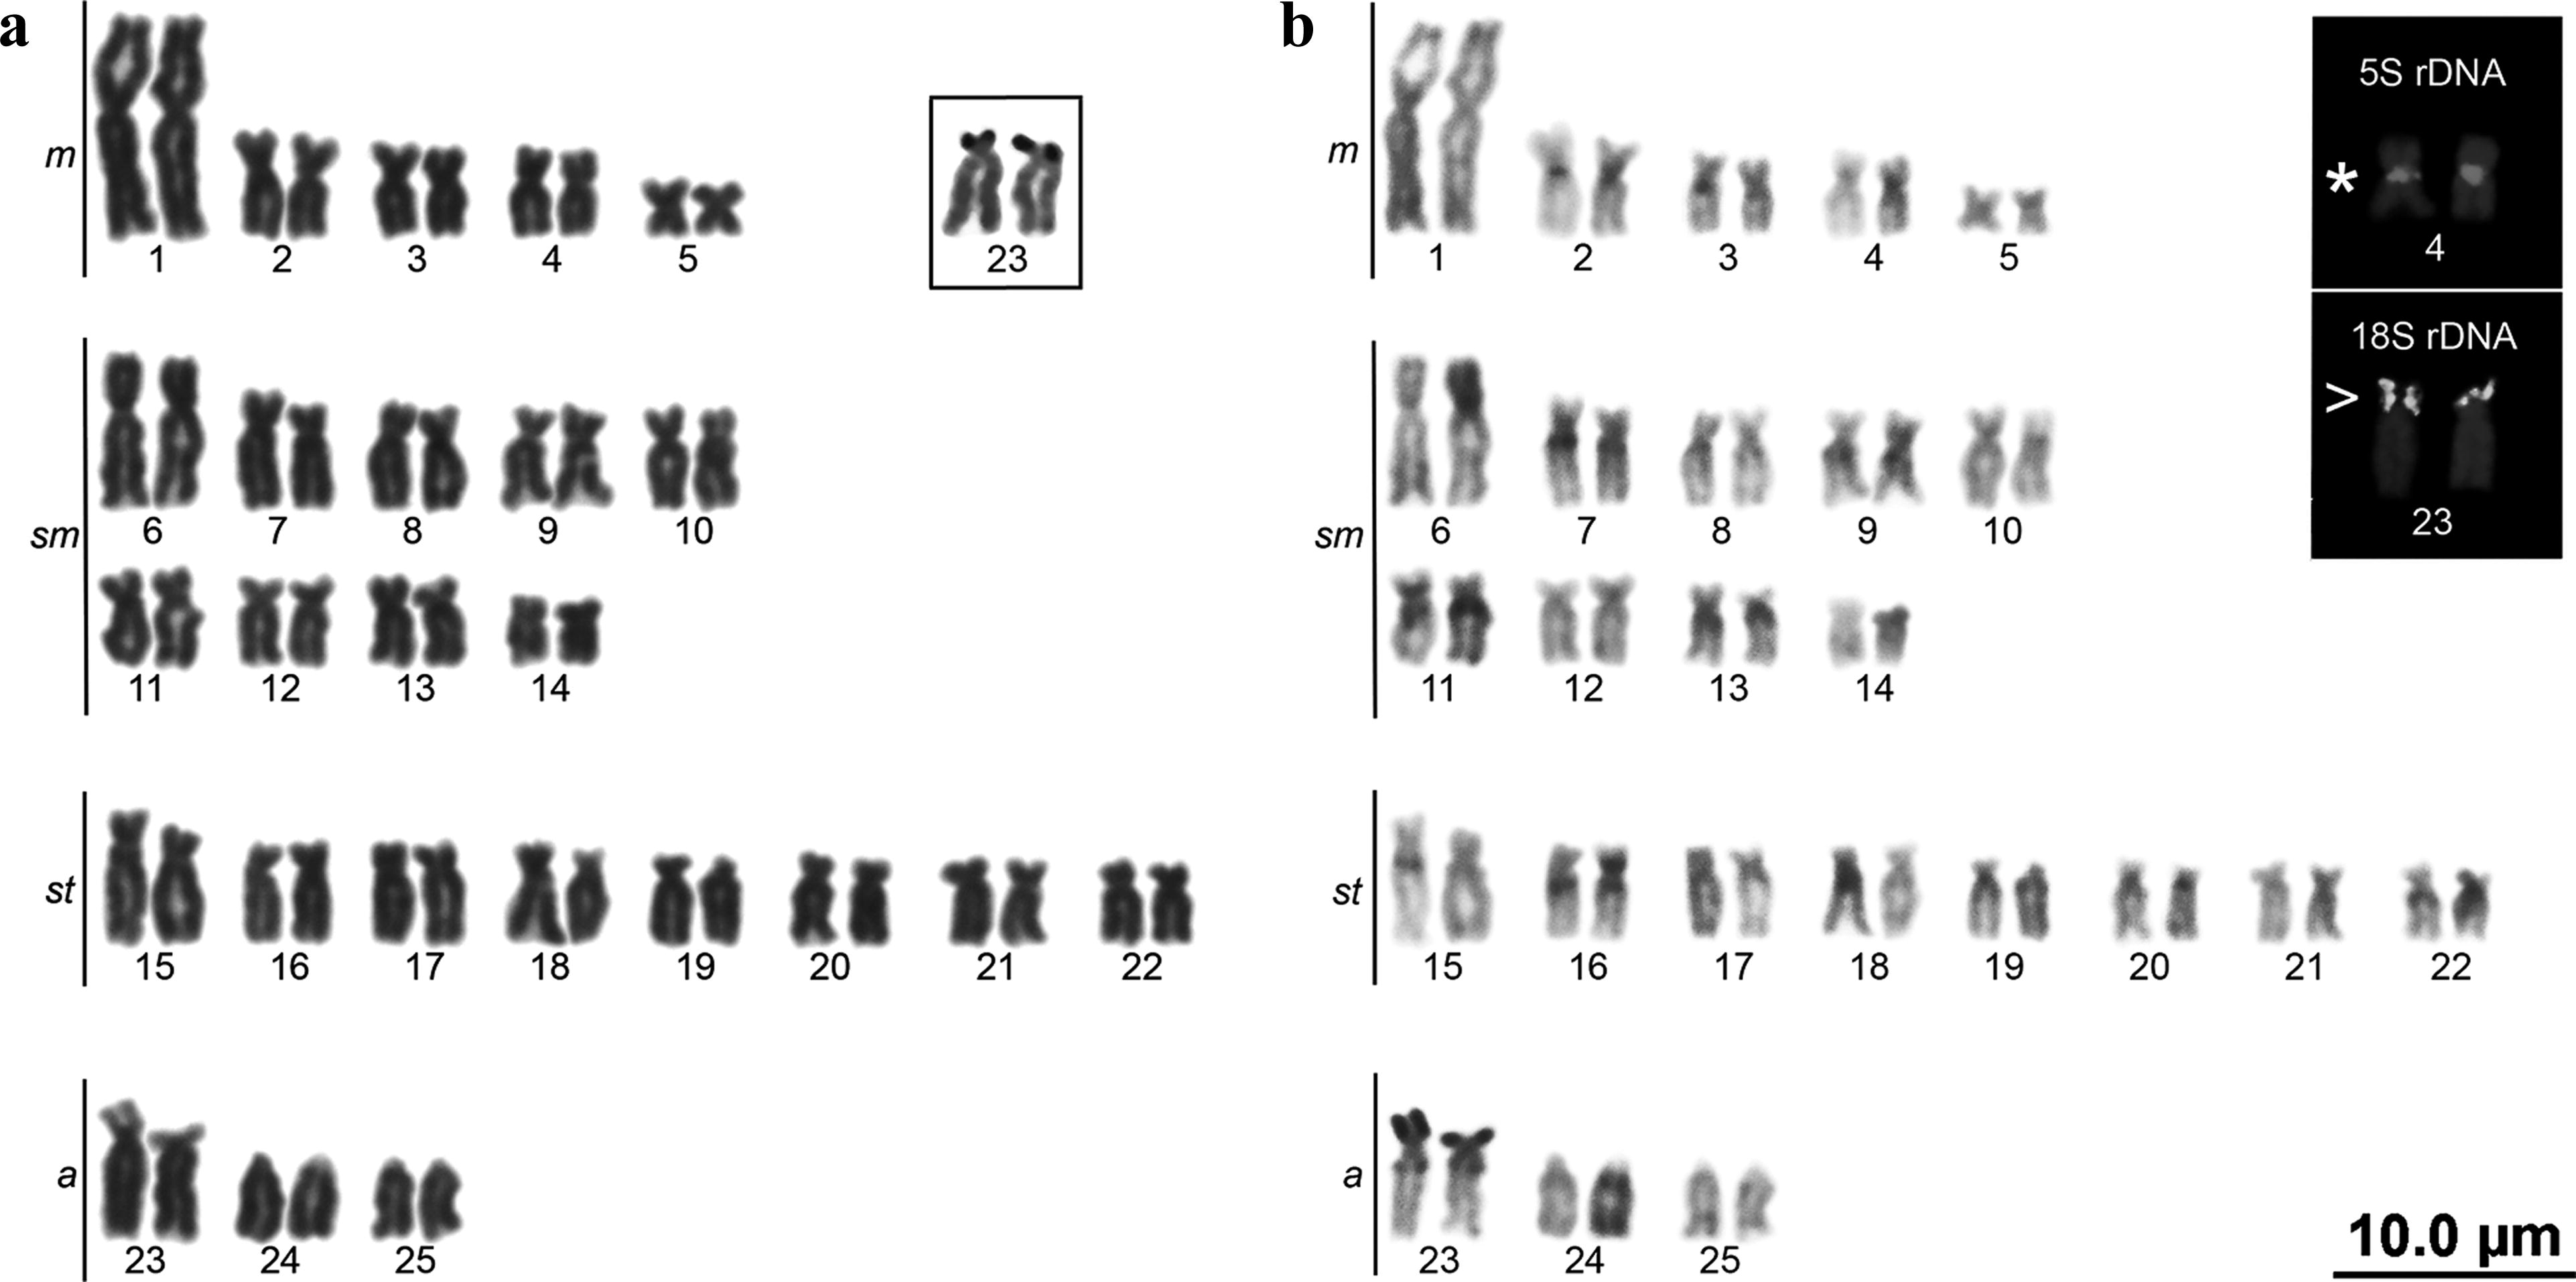
Karyotypes of Asytanax lacustris stained by Giemsa (
Cytogenetic Data Obtained in This Study for Species Synonymized with Astyanax lacustris by Lucena and Soares 10 and A. abramis
Gavazzoni et al., 11 present studyb.
a, acrocentric; cent, centromeric; m, metacentric; NORs, nucleolar organizing regions; p, short arm; sm, submetacentric; st, subtelocentric; term, terminal.
Molecular analyses
Cytochrome oxidase I
Sequences are available in the GenBank, with the accession numbers: “A. altiparanae” (OR287990-OR287991), A. abramis (OM858871-OM858872), “A. asuncionensis” (OR287992-OR287993), “A. jacuhiensis” (OR287994-OR287995), A. lacustris (OP537181-OP537183), and P. fasciatus (OM858867). The COI matrix contains 11 terminals and 625 bp with 30 variable sites (4.8%) and a further one terminal as the outgroup (Supplementary Data S1). The overall mean distance is 0.022 ± 0.004 (Supplementary Data S2).
All trees resulting from the phylogenetic analysis (NJ, ML, and MP) of COI showed that specimens of Astyanax analyzed in this study formed a monophyletic group with high bootstrap values. Three clades were formed: (1) A. abramis, “A. asuncionensis”, and “A. altiparanae”, (2) “A. jacuhiensis” and “A. altiparanae”, and (3) A. lacustris (Supplementary Data S3). The ASAP model for species delimitation showed the same arrangement as that of NJ, ML, and MP among the groups (Supplementary Data S4).
Cytochrome B
Sequences are available in the GenBank, with the accession numbers: “A. altiparanae” (OR335557-OR335558), A. abramis (OR335559-OR335560), “A. asuncionensis” (OR335561-OR335562), “A. jacuhiensis” (OR335563-OR335564), A. lacustris (OR335565-OR335567), and P. fasciatus (OR335568). The Cytb matrix contains 11 terminals and 845 bp with 42 variable sites (4.97%) and a further one terminal as the outgroup (Supplementary Data S5). The overall mean distance is 0.021 ± 0.004 (Supplementary Data S6).
All trees resulting from the phylogenetic analysis (NJ, ML, and MP) of Cytb showed that specimens of Astyanax analyzed in this study formed a monophyletic group with high bootstrap values. Three clades were formed: (1) A. abramis, “A. asuncionensis”, and “A. altiparanae”, (2) “A. jacuhiensis” and “A. altiparanae”, and (3) A. lacustris (Supplementary Data S3).
Cytochrome oxidase I + cytochrome B (concatenated analysis)
The COI+Cytb matrix contains 11 terminals and 1470 bp with 72 variable sites (4.90%) and a further one terminal as the outgroup (Supplementary Data S7). The overall mean distance is 0.052 ± 0.004 (Table 3).
Pairwise Kimura Two-Parameter Genetic Distance for the COI+Cytb Genes Among the Operational Taxonomic Units (Below Diagonal) and Values of Standard Error (Above Diagonal). Numbers in Bold Represent the Intraspecific Genetic Distance. Psalidodon fasciatus as the Outgroup
All trees resulting from the phylogenetic analysis (NJ, ML, and MP) of COI+Cytb showed that specimens of Astyanax analyzed in this study formed a monophyletic group with high bootstrap values. Three clades were formed: (1) A. abramis, “A. asuncionensis”, and “A. altiparanae”, (2) “A. jacuhiensis” and “A. altiparanae”, and (3) A. lacustris (Fig. 3).
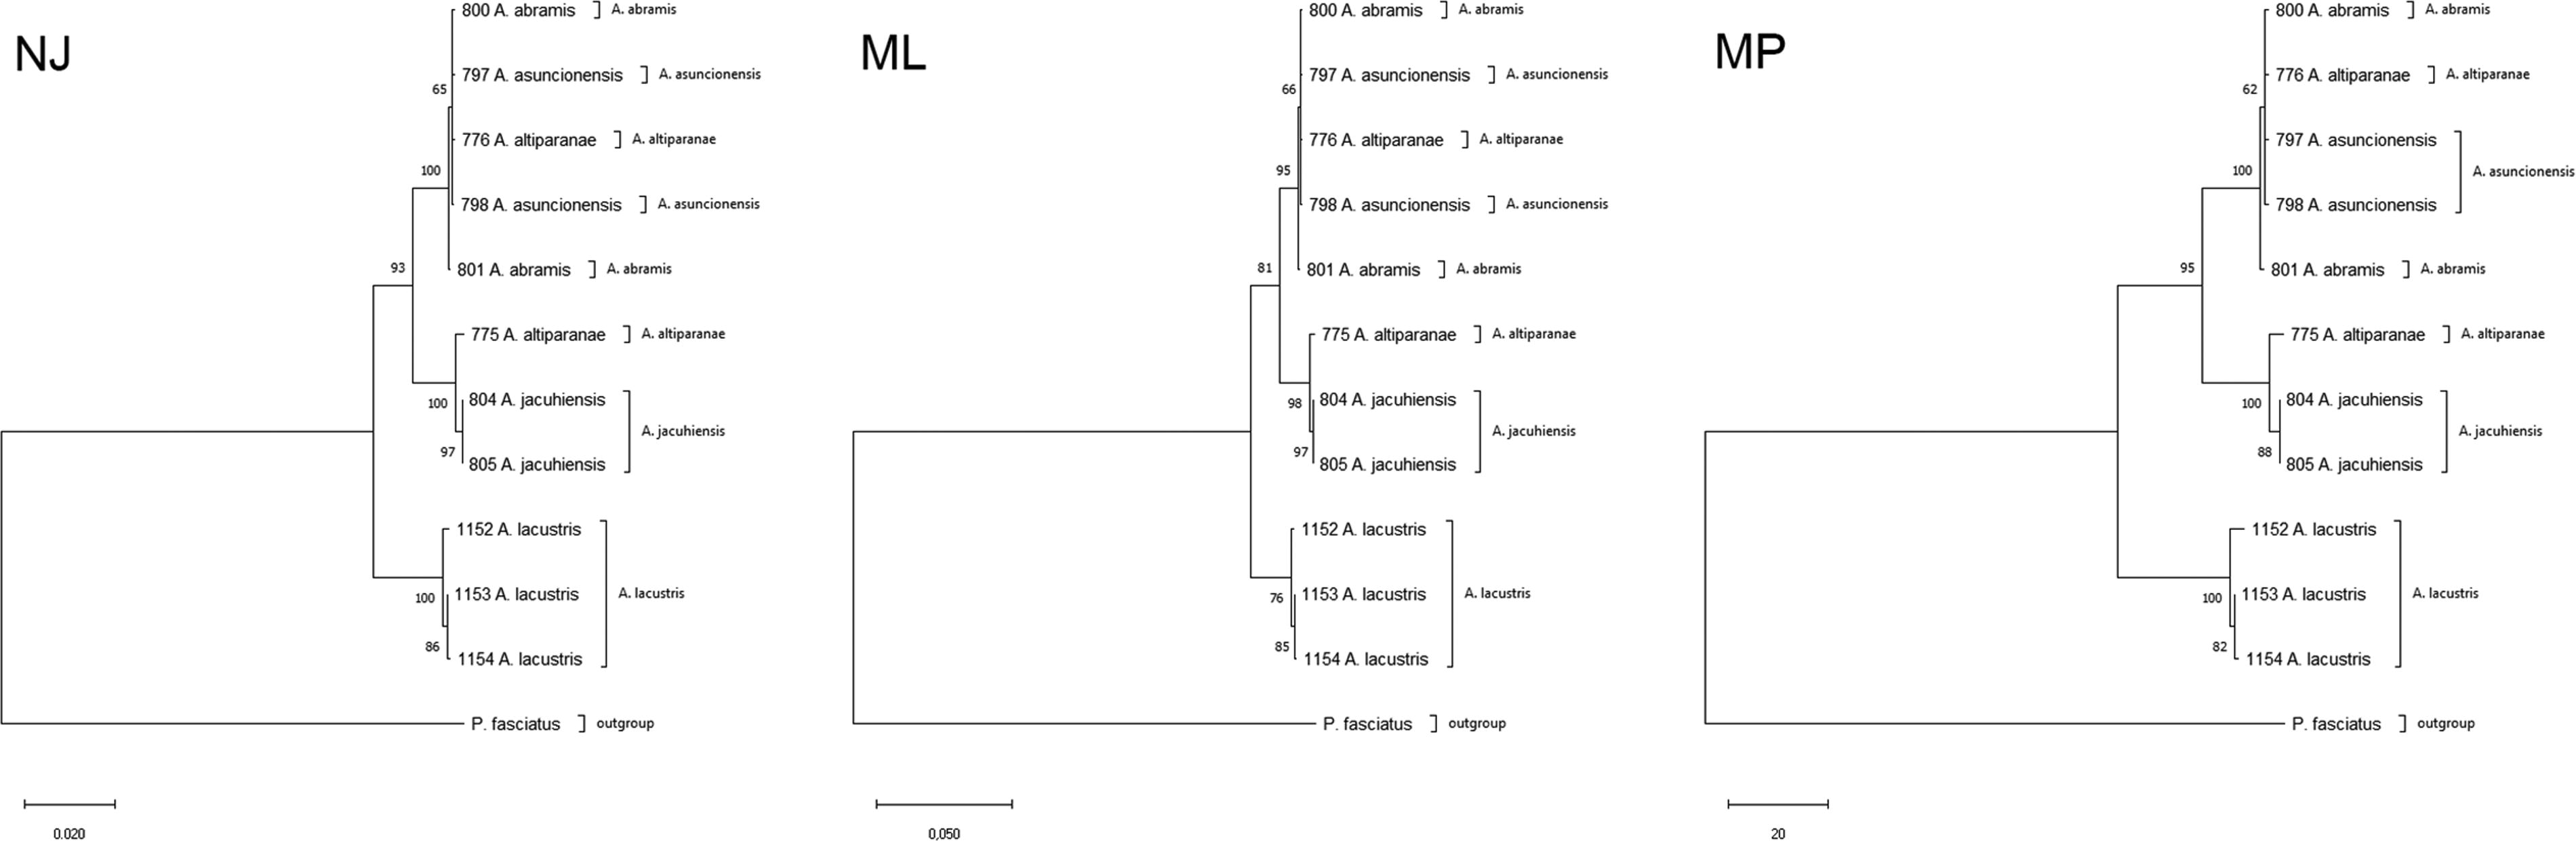
Relationship cladograms performed with COI+Cytb sequences generated by neighbor-joining (NJ), maximum likelihood (ML), and maximum parsimony (MP) analyses. Bootstrap values are represented in the branches. Psalidodon fasciatus was used as the outgroup.
Morphometric analysis
The analyses carried out by comparing the morphometric data obtained confirmed the identity of the five previously recognized species (Fig. 4) that were A. abramis, “A. altiparanae”, “A. asuncionensis”, A. lacustris, and “A. jacuhiensis”. The scores of the variables that most contributed to the separation of species are shown in Table 4.
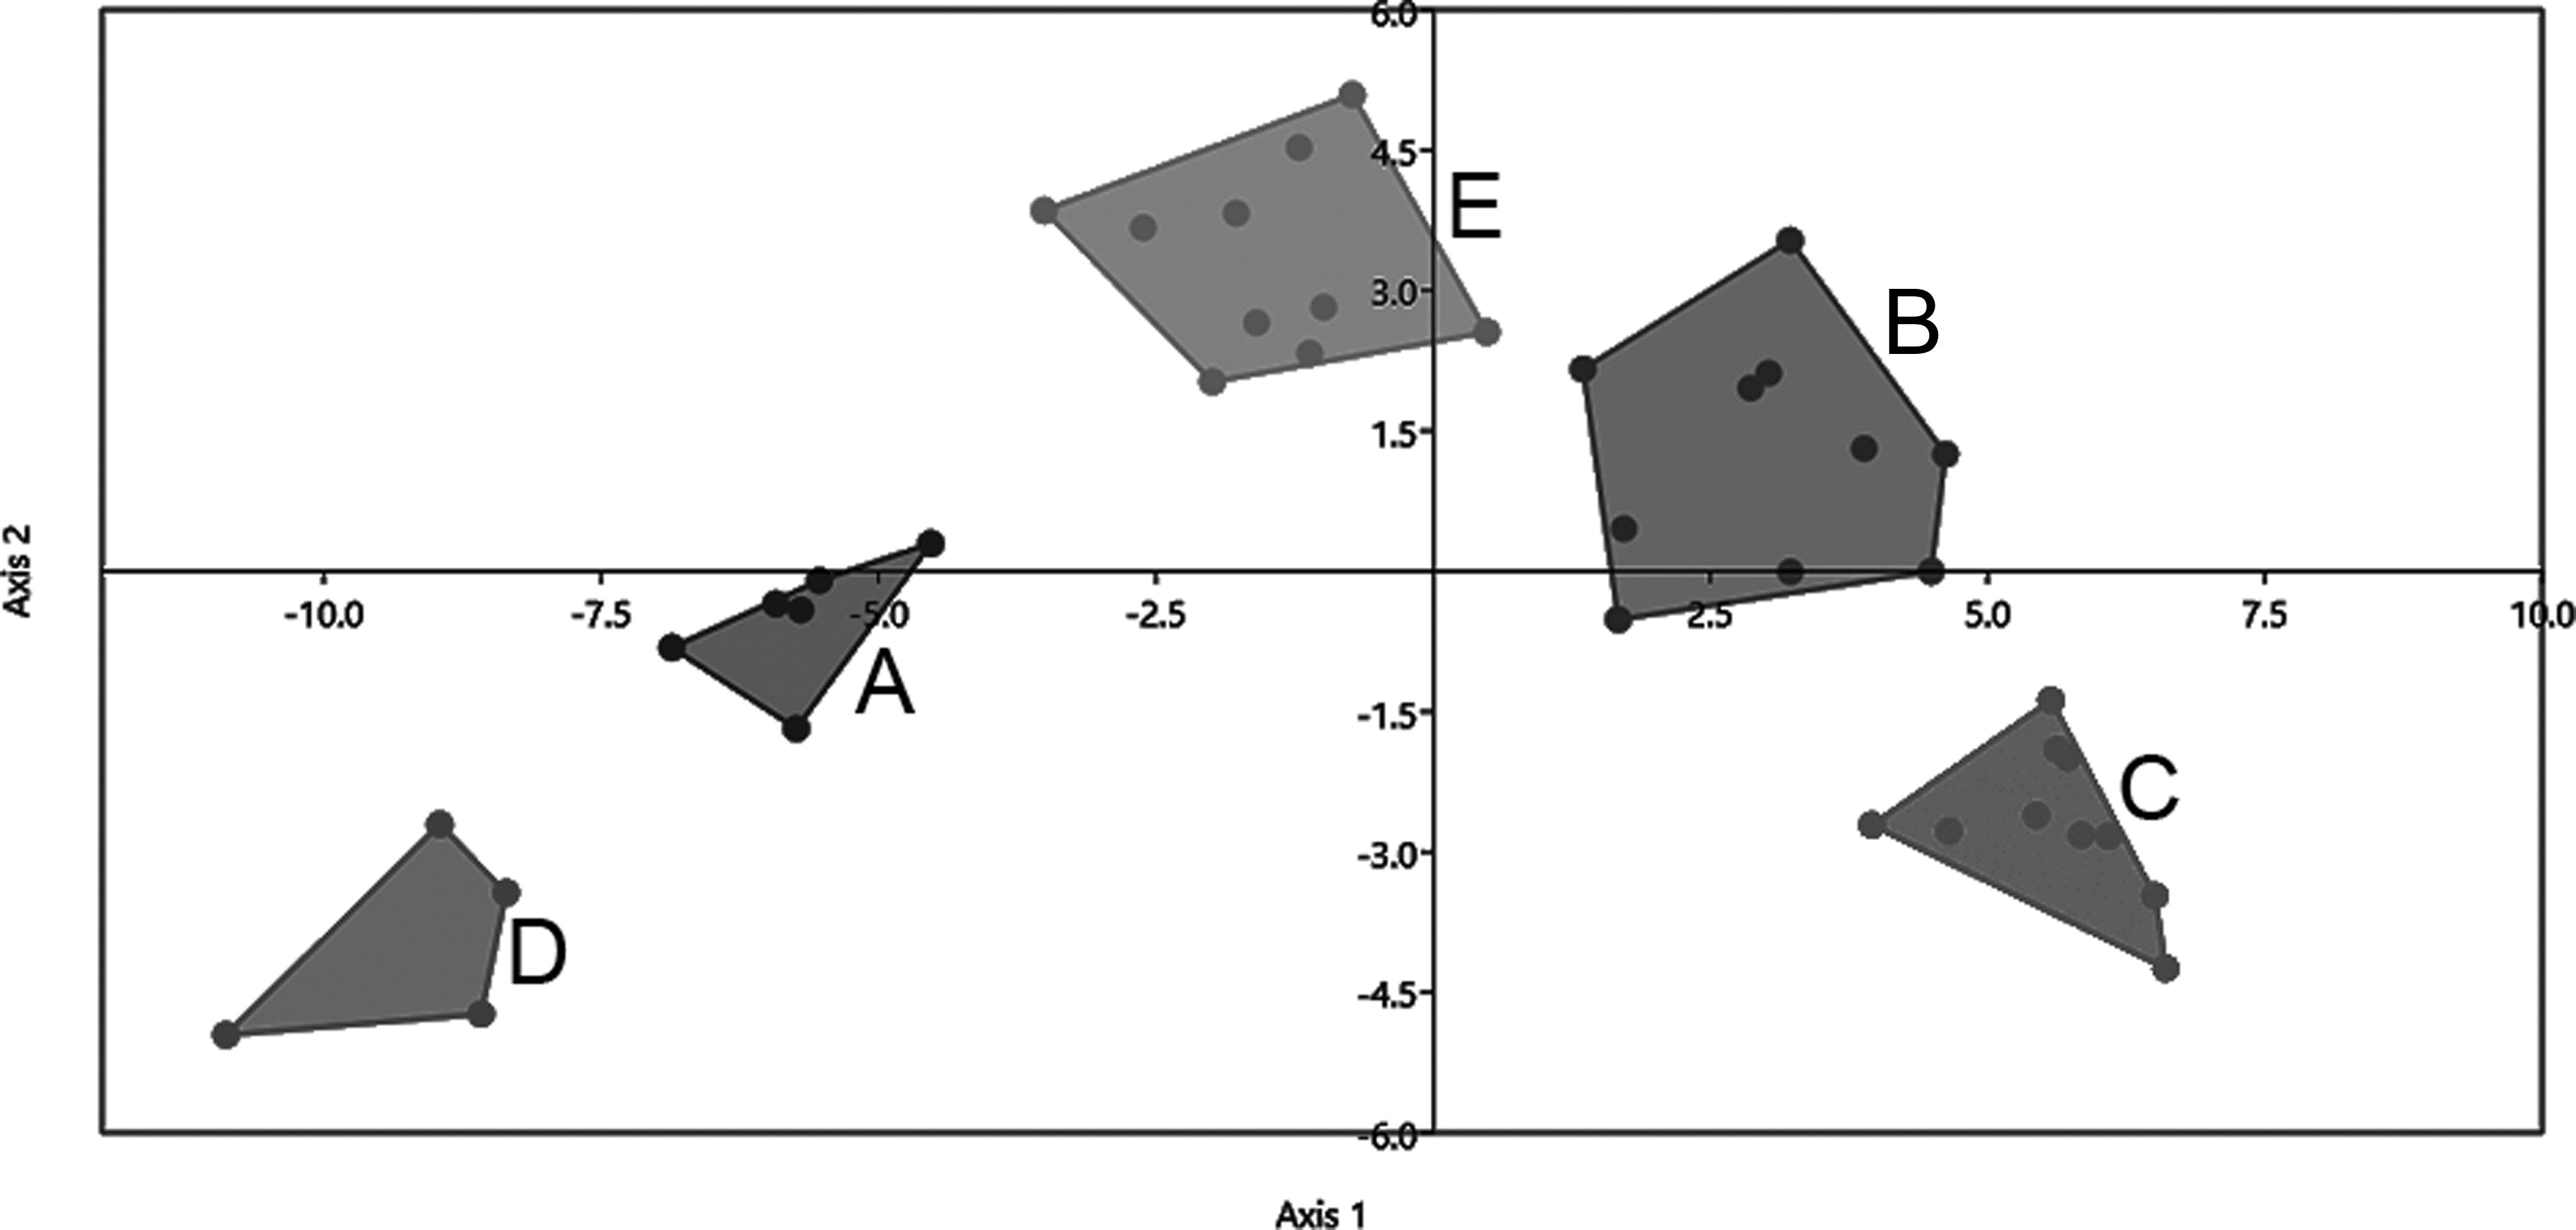
Linear discriminant analysis (LDA) performed with truss measurements obtained from the five species analyzed: A. abramis
Values Corresponding to Each Measure in Each of the Five Axes of the Analysis. The Values Highlighted in Bold Are Those That Most Contributed to the Separation of Groups on Axis 1, Which Were Used for Calculating Percentages in Relation to Each of the Measurements
LDA indicated the presence of five distinct groups (Fig. 4), with the first three axes explaining 96.4% of the data variation. The first axis represents 68.6% of the variation, and the variables that most contributed to the separation were: G-H: distance between the pectoral and pelvic fins (6); A-B: distance between the snout and the supraoccipital (9); B-J: distance between the maxillary commissure and the supraoccipital (10); B-I: distance between isthmus and supraoccipital (11); B-C: distance between supraoccipital and dorsal-fin (12); and E-F: distance between anal-fin and caudal peduncle (14). The results containing the measurements of trusses for all species are shown in Table 5.
Morphometric Data of Astyanax abramis (n = 6), “A. altiparanae” (n = 10), “A. asuncionensis” (n = 10), “A. jacuhiensis” (n = 4), and A. lacustris (n = 10)
A. lacustris differs from “A. jacuhiensis” by the higher distance between the snout and the supraoccipital (21.1%–24.9% SL vs. 18.8%–19.7% in A. jacuhiensis), higher distance between snout and supraoccipital (21.2%–24.9% HL vs. 18.8%–19.7% in A. jacuhiensis), higher distance between the snout and the supraoccipital in relation to the pre-anal length (30.6%–37.1% vs. 27.2%–29.5% in A. jacuhiensis), and by having a higher distance between snout and supraoccipital in relation to distance between dorsal-fin and caudal peduncle (39.1%–46.5% vs. 32.4%–36.4% in A. jacuhiensis); differs from A. abramis by having a higher pre-dorsal distance (51.4%–54.7% SL vs. 47.7%–51.0% in A. abramis), higher distance between the orbit and the dorsal (40.9%–43.6% SL vs. 35.9%–39.8% in A. abramis), and by having a lower distance between dorsal-fin to caudal peduncle (51.2%–55.7% SL vs. 55.8%–59.1% in A. abramis); differs from “A. altiparanae” by having a lower upper jaw length (35.3%–40.0% HL vs. 40.2%–45.2% “A. altiparanae”), higher distance between supraoccipital and dorsal-fin in relation to distance between anal-fin and caudal peduncle (75.0%–85.8% vs. 56.3%–72.6% in “A. altiparanae”), and by having a lower interorbital distance in relation to distance between snout and supraoccipital (52.4%–62.0% vs. 63.8%–77.7% in “A. altiparanae”); differs from “A. asuncionensis” by having a higher distance between the orbit and the dorsal (40.9%–43.6% SL vs. 36.7%–39.1% in “A. asuncionensis”), higher pre-dorsal distance (51.4%–54,7% SL vs. 47.7%–50.3% in “A. asuncionensis”), lower distance between dorsal and adipose (37.0%–40.1% SL vs. 41.0%–43.7% in “A. asuncionensis”), and by a higher distance between the supraoccipital and dorsal-fin (28.4%–32.0% SL vs. 22.4%–26.1% in “A. asuncionensis”).
“A. jacuhiensis” differs from A. abramis by having a lower distance between dorsal and adipose fins (38.6%–42.0% SL vs. 40.3%–42.2% in “A. abramis”), lower distance between supraoccipital and dorsal-fin (22.4%–26.1% SL vs. 27.6%–31.8% in “A. abramis”), and higher distance between snout and supraoccipital (24.4%–25.9% HL vs. 19.3%–21.5% in “A. abramis”); differs from “A. altiparanae” by having a lower length of the head (23.5%–24.7% SL vs. 24.9%–26.9% in “A. altiparanae”), higher distance between supraoccipital and dorsal-fin (29.1%–34.3% SL vs. 22.4%–28.5% in “A. altiparanae”), higher interorbital distance (38.4%–41.5% HL vs. 33.7%–38.4% in “A. altiparanae”), lower distance between snout to supraoccipital (18.8%–19.7% HL vs. 23.2%–27.3% in “A. altiparanae”), and lower distance between isthmus and supraoccipital (21.8%–24.3% HL vs. 25.6%–29.3% in “A. altiparanae”); differs from “A. asuncionensis” by having a higher distance between orbit and dorsal-fin (39.6%–43.2% SL vs. 36.7%–39.1% in “A. asuncionensis”), higher distance between supraoccipital and dorsal-fin (29.1%–34.3% SL vs. 22.4%–26.1% in “A. asuncionensis”), higher interorbital distance (38.4%–41.5% SL vs. 35.4%–37.3% in “A. asuncionensis”), higher distance between snout and supraoccipital (18.8%–19.7% HL vs. 24.4%–25.9% in “A. asuncionensis”), and by the lower distance between isthmus and supraoccipital (21.8%–24.3% HL vs. 26.8%–28.8% in “A. asuncionensis”).
A. abramis differs from the four species analyzed by having a higher number of perforated scales on the lateral line (42 or more vs. 40 or less), and by having a higher number of scales between the origin of the dorsal-fin and the lateral line (9 vs. 8 or less).
Discussion
Cytogenetic and morphometric analyses used here verified the occurrence of species-specific characters and did not corroborate the synonymization proposed by Lucena and Soares, 10 and suggest that, in addition to A. lacustris, the OTUs A. altiparanae, A. asuncionensis, and A. jacuhiensis are valid species. Analysis of mitochondrial DNA sequences was diagnostic of A. lacustris concerning other species. Few studies of integrative taxonomy using the same individuals with these approaches together (cytogenetics, DNA sequences, and morphology/morphometry) aiming at validating species have been carried out in Neotropical ichthyofauna.43,44
The cytogenetic markers, karyotypic formula, and number/location of 5S rDNA cistrons contributed to the differentiation of A. lacustris (10m + 26sm + 8st + 6a; 5S rDNA pair 4) from other currently synonymized OTUs: A. asuncionensis (8m + 24sm + 6st + 12a, 5S rDNA pair 9) and A. jacuhiensis (8m + 28sm + 6st + 8a, 5S rDNA pairs 2 and 20). A. lacustris and A. altiparanae (6m + 28sm + 4st + 12a) differed only concerning the karyotypic formula. Other cytogenetic markers: diploid number, NORs (Ag- and 18S rDNA), and pattern of heterochromatin distribution are conserved in these species (Gavazzoni et al. 11 and the present study) and another species of A. bimaculatus complex,45–47 and may represent plesiomorphic characters for this group of fish.
The analyses carried out by comparing the morphometric data obtained confirmed the identity of the four previously recognized species. Despite the synonymization proposal, Lucena and Soares 10 recommended further research on the mechanisms that isolated these lineages within the subgroup, in particular, to determine whether the speciation process occurred without morphological differentiation or whether morphological similarities emerged after genetic differentiation owing to the adoption of species adaptations to similar habitats. Similar results were observed in studies by Gavazzoni et al.43,48 for Psalidodon species and Rocha et al. 44 for two species of Corydoras; in both, the analysis of morphological characters was not enough for the diagnosis of the species.
The phylogenetic analysis of the mitochondrial genes COI, Cytb, and COI+Cytb (NJ, ML, and MP) and species delimitation using the ASAP model obtained the same results, in which A. lacustris can be diagnosed from the other synonymized species A. altiparanae, A. asuncionensis, and A. jacuhiensis, plus A. abramis (valid species), with high bootstrap values (Fig. 3). Cunha et al. 47 also verified the molecular differentiation of A. lacustris and A. altiparanae. According to these authors, two haplogroups were found, one represented by A. altiparanae (corroborating the molecular identity and distribution range) and another haplogroup indicating A. lacustris occurring in the São Francisco Basin and the coastal basins of the Brazilian Shield. These species diverged in the Pleistocene, suggesting the influence of the tectonic activity and sea-level changes during this period on the diversification of the A. bimaculatus complex. 47
Although the molecular analyses diagnosed A. lacustris, the molecular markers were not efficient in splitting the other species analyzed here (A. abramis, A. altiparanae, A. asuncionensis, and A. jacuhiensis). Barcoding analyses for species identification have been widely used with effective results in several fish species;8,20,21,49 however, it does not always bring concise results, especially in morphologically cryptic species and complex groups like Astyanax.21,43,47 Taxonomic uncertainties may result from a combination of aspects such as rapid speciation, species with a wide geographic distribution, lack of descriptions of local morphotypes, and inadequate phylogenetic analyses. The same can also be observed in the species complex P. fasciatus (cited as A. fasciatus).21,43,48,50
Ornelas-García et al. 51 and Pereira et al. 19 suggest that the low genetic diversity using DNA barcoding (COI sequences) in Astyanax and Psalidodon (formerly referred to as Astyanax) may be the result of the recent evolutionary process of radiation. Pazza et al. 50 suggest that the divergence rate between the São Francisco and Paraná populations is consistent for different species, separated after the vicariant event of the Upper Paranaíba uplift. The polytomy observed in the previous authors’ data, represented in the populations originating in the basins of the São Francisco and Paraná rivers, can be explained by the rapid dispersion and diversification accompanying the process of separation of populations. The same can be observed in the present study, where A. altiparanae (Upper Paraná River), A. asuncionensis (Lower Paraná River), A. jacuhiensis (Upper Uruguai River), and A. abramis (Lower Paraná River) belong to the La Plata basin.
The speciation process is not uniform and not leading to changes in all aspects of the organism (morphological, ecological, genetic, among others) at the same time, generating the so-called gray zone, a moment in the speciation process that depending on the characters used and evaluated, it is possible to reach different conclusions regarding the existence of one or more species. 52 To avoid the conflicts generated by alternative species concepts, many researchers use species as lineages of populations or metapopulations that evolve independently.52,53 In the present study, analysis of different characters proposed by the integrative taxonomy used in the same individuals could provide larger reliability and minimize the underestimation of biodiversity, recognizing the four synonymized OTUs as valid species.
Footnotes
Acknowledgments
The authors are grateful to the Western Paraná State University (UNIOESTE) and Research Nucleus in Limnology, Ichthyology and Aquaculture (Nupélia) for logistical support.
Authors’ Contributions
All authors wrote the article. M.G. and V.P.M. developed cytogenetic and molecular Analyses. T.H.P., C.S.P., and W.J.d.G. developed morphometric analyses.
Data Availability
Ethics Approval
Fish collections were authorized by the Chico Mendes Institute for Biodiversity Conservation (MMA/ICMBio) (license number: SISBIO 10522-1).
Ethical Consent
This study was carried out in strict accordance with the recommendations of the Guide for the Care and Use of Laboratory Animals, approved by the Committee on the Ethics of Animal Experiments of the Universidade Estadual do Oeste do Paraná (license number: Protocol 13/09—CEEAAP/Unioeste).
Disclosure Statement
The authors have no conflicts of interest to declare.
Funding Information
This study was supported by CAPES (Coordenadoria de Aperfeiçoamento de Ensino Superior), the Araucária Foundation (Fundação Araucária de Apoio e Desenvolvimento Científico e Tecnológico do Estado do Paraná), and CNPq (Conselho Nacional de Desenvolvimento Científico e Tecnológico).
References
Supplementary Material
Please find the following supplemental material available below.
For Open Access articles published under a Creative Commons License, all supplemental material carries the same license as the article it is associated with.
For non-Open Access articles published, all supplemental material carries a non-exclusive license, and permission requests for re-use of supplemental material or any part of supplemental material shall be sent directly to the copyright owner as specified in the copyright notice associated with the article.