
Abstract
Background
The minute ventilation-carbon dioxide production (VE/VCO2) slope, obtained during exercise testing, possesses prognostic value in heart failure (HF). The VE-VCO2 relationship is generally linear thereby hypothetically producing similar slope values regardless of the exercise-test time interval used for calculation.
Design
This study assesses the ability of the VE/VCO2 slope, calculated at different time intervals throughout a progressive exercise test, to predict 1-year cardiac-related hospitalization and mortality in subjects with HF.
Methods
Seventy-two subjects underwent symptom-limited exercise testing with ventilatory expired gas analysis. Mean age and left ventricular ejection fraction for 44 male and 28 female subjects were 51.2 years (± 13.0) and 27.0% (± 12.3) respectively. The VE/VCO2 slope was calculated from time 0 to 25, 50, 75 and 100% of exercise time and subsequently used to create five randomly selected VE/VCO2 slope categories.
Results
(The intraclass correlation coefficient found calculation of the VE/VCO2 slope, when divided into quartiles, to be a reliable measure (alpha = 0.94, P<0.0001). Univariate Cox regression analysis revealed all VE/VCO2 slope categories (25-100% and random selections) were significant predictors of cardiac-related hospitalization and mortality over a 1-year period. Multivariate Cox regression analysis revealed all VE/VCO2 slope categories outperformed peak oxygen consumption (VO2) in predicting hospitalization and mortality at 1 year.
Conclusions
Although the different classification schemes were not identical, these results suggest VE/VCO2 slope maintains prognostic significance regardless of exercise-test time interval. Calculation of VE/VCO2 slope may therefore still be valuable in subjects putting forth a sub-maximal effort while effort-dependent measures, such as peak VO2, are not.
Introduction
Symptom-limited exercise testing with ventilatory expired gas analysis provides a wealth of valuable information in the heart failure (HF) population. Peak oxygen consumption (VO2) is presently considered the diagnostic/prognostic gold standard in HF [1]. Numerous investigations provide data to support the use of peak VO2 in this capacity [2–5]. A potential weakness of peak VO2 is its dependence on subject effort. Cessation of an exercise test secondary to subject request and prior to maximal physiological effort produces a falsely low peak VO2. This obviously has negative implications for the diagnostic/prognostic value of this parameter. The risk of poor effort is of particular concern in the HF population given the potential apprehension a number of individuals may have in maximally exerting themselves during the exercise test.
Other ventilatory expired gas measures have recently emerged as potentially having diagnostic/prognostic superiority over peak VO2. One such measure is the minute ventilation (VE)-carbon dioxide production (VCO2) relationship commonly expressed as the VE/VCO2 slope [3, 6–11]. Robbins et al. [6], for example, found a VE-VCO2 relationship 44.7 at peak exercise was superior to a peak VO2 13.9 ml/kg per min in predicting 18-month survival in a group of patients with HF. The VE-VCO2 relationship was also a significant predictor of survival as a continuous variable and was again superior to peak VO2. The authors of the present study have also found VE/VCO2 slope to be superior to peak VO2 in predicting 1-year, cardiac-related hospitalization in a small group of patients with HF [10].
The slope of the VE-VCO2 relationship is generally linear and should therefore remain relatively constant throughout a progressive exercise test making this measure independent of subject effort. In the event of submaximal effort, the VE/VCO2 slope would then theoretically maintain diagnostic/prognostic significance. To date, however, no investigation has tested this hypothesis. The purpose of this investigation is therefore to assess the ability of VE/VCO2 slope, calculated at different time intervals throughout a progressive exercise test, to predict 1-year hospitalization and mortality in a group of patients with HF.
Methods
Seventy-two consecutive subjects diagnosed with HF and undergoing a symptom-limited exercise test between 15 May 1997 and 2 May 2001, were retrospectively recruited from the HF program at the Virginia Commonwealth University Health Systems. All tests were conducted on an outpatient basis. Written informed consent was obtained from all subjects prior to testing. Virginia Commonwealth University Institutional Review Board approval was obtained for those subjects undergoing an exercise test as part of a prospective research project and not as a standard of care. The exercise tests performed as part of a subject's standard of care was done so to establish a baseline aerobic capacity. None of the tests were performed to assess worsening heart failure or arrhythmias. The exercise testing procedures were, however, identical for all subjects. Subject and pharmacological characteristics are listed in Table 1.
Exclusion criteria consisted of diagnosed pulmonary disease (per physician examination), myocardial infarction within the past 6 months, signs and/or symptoms suggestive of decompensated heart failure, and/or any orthopedic condition that would not allow the subject to ambulate on a treadmill. Inclusion criteria consisted of diagnosed compensated HF, and evidence of left ventricular dysfunction by echocardiogram or cardiac catheterization.
Subject characteristics
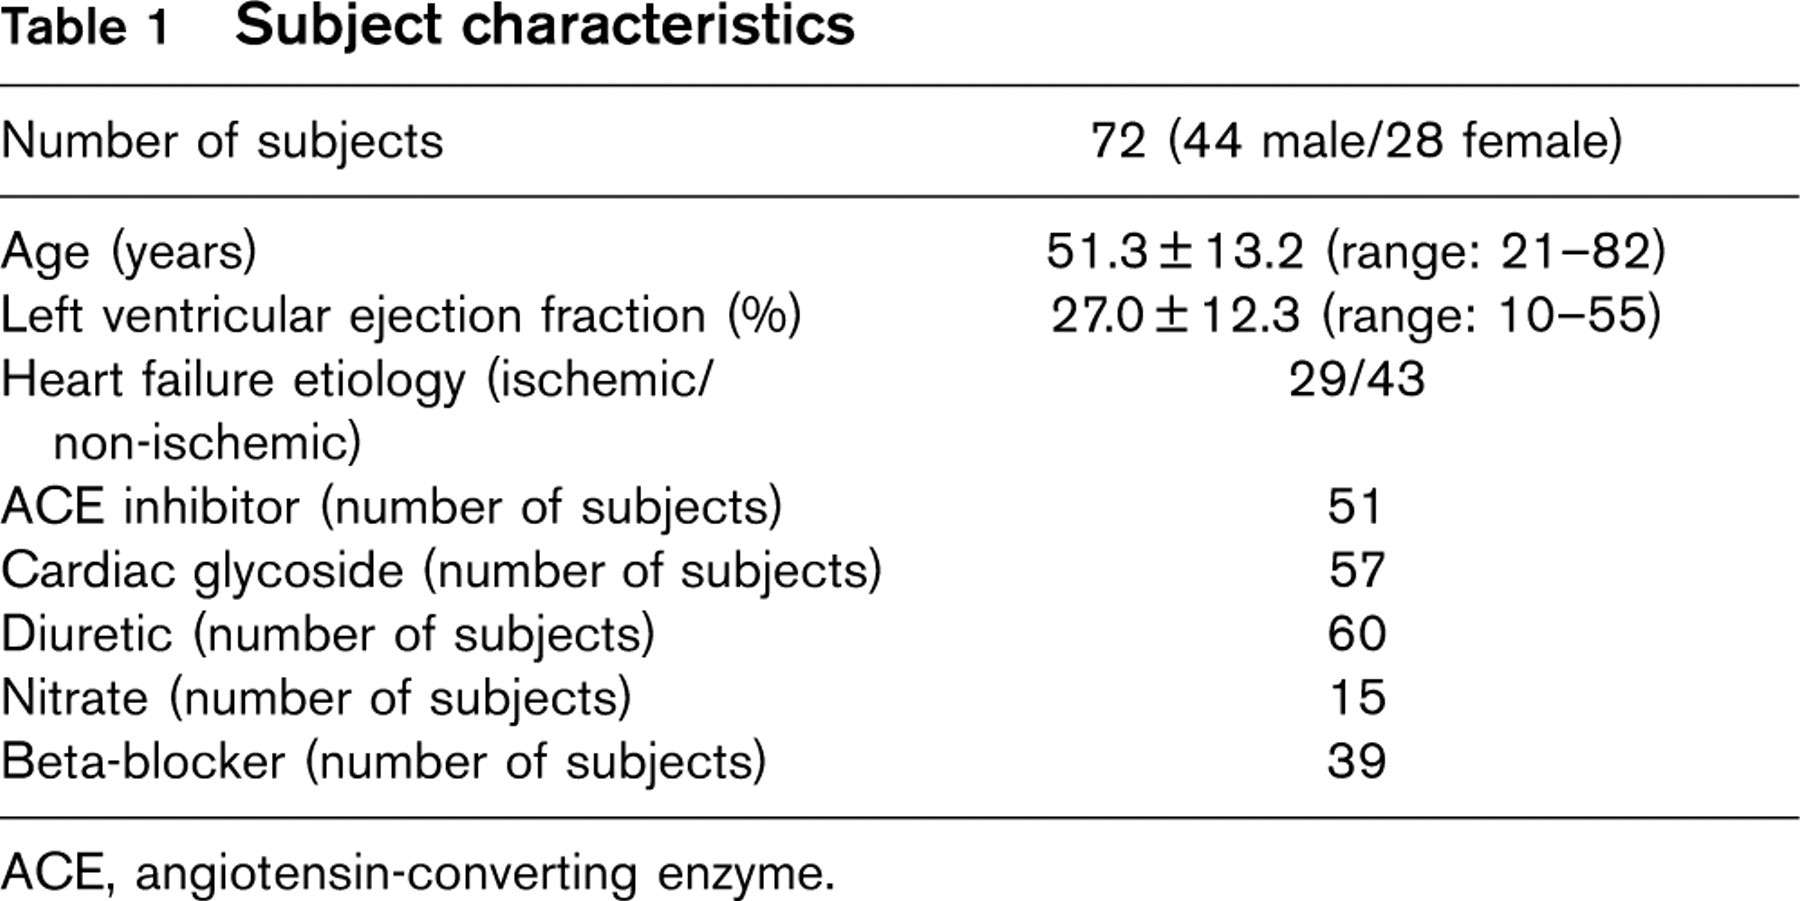
ACE, angiotensin-converting enzyme.
Equipment calibration
Ventilatory expired gas analysis was obtained through a metabolic cart (Medgraphics CPX-D, Minneapolis, Minnesota, USA or Sensormedics Vmax29, Yorba Linda, California, USA). The oxygen and carbon dioxide sensors were calibrated using gases with known oxygen, nitrogen, and carbon dioxide concentrations prior to each test. The flow sensor was also calibrated before each test using a three-litre syringe.
Testing procedure and data collection
Symptom-limited exercise tests with ventilatory expired gas analysis were conducted through the use of a treadmill. The modified ramping protocol selected for testing consisted of approximately 2 mlO2 kg per min increases in workload every 30 s [10, 12, 13]. Stage one began at 1.0 mile per hour (mph) and a 0% grade. Stages increased by 0.1 mph and 0.5% grade thereafter. The same conservative treadmill protocol was used to test all subjects. Monitoring consisted of continuous 12-lead electrocardiography (Quinton 4000, Seattle, Washington, USA), manual blood pressure measurements approximately every third stage (90 s), heart rate recordings every stage via the electrocardiogram, and rating of perceived exertion (Borg 15 grade scale) at each stage. Test termination criteria consisted of patient request, ventricular tachycardia, 2 mm of horizontal or down sloping ST segment depression, or a drop in systolic blood pressure of 20 mmHg during progressive exercise. A qualified exercise physiologist with physician supervision conducted each exercise test.
Breath-by-breath VCO2 (l/min) and VE (l/min) collected pre-, during, and post-exercise, was averaged over 10-s intervals prior to analysis. The 10-s average VO2 during the final stage of the exercise test was deemed the peak value. The VE/VCO2 slope was determined by manually inputting the 10-s averaged VE and VCO2 data throughout the test into spreadsheet software (Microsoft Excel; Microsoft Corp., Bellevue, Washington, USA). Four different VE/VCO2 slope values were derived from the exercise test. The starting point for each was at the beginning of the ramping protocol. The amount of data used for the four VE/VCO2 slope calculations were 25, 50, 75, and 100% of the exercise test. Although not an exact depiction of the VE-VCO2 relationship given the possible non-linear response toward maximal exercise, Figure 1 provides a graphical illustration of the quartile calculations. Using the data from the 25, 50, 75, and 100% VE/VCO2 slope calculations, a random number generator created five random categories (r1-5) for each subject. For example, in subject one, the random number generator selected the 100% (r1), 75% (r2), 75% (r3), 50% (r4), and 100% (r5) VE/VCO2 slope calculations for the five random categories respectively.
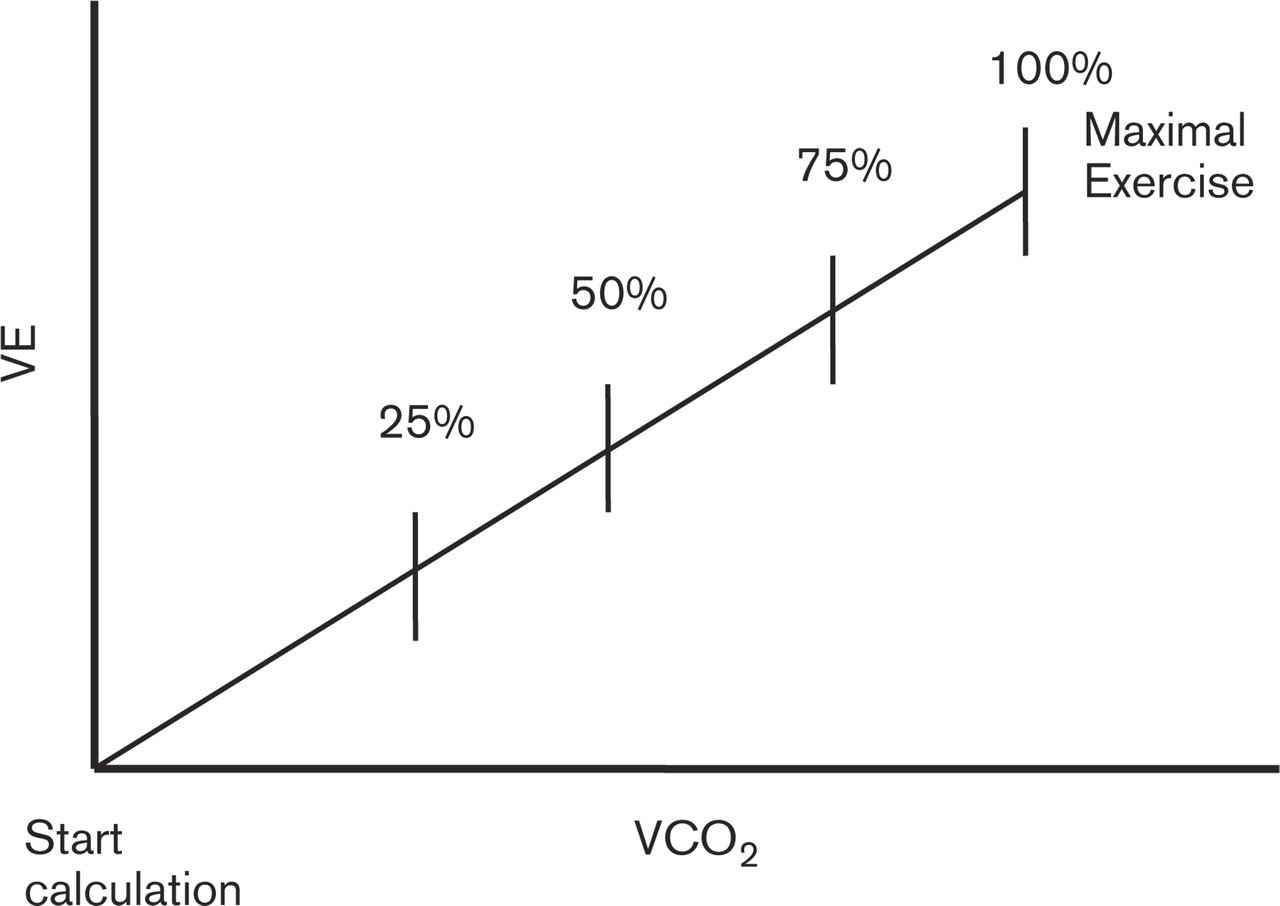
Illustration of 25, 50, 75, and 100% VE/VCO2 slope calculations.
Subjects were tracked for hospitalization and mortality 1 year following exercise testing via medical chart review. Any hospital admission or death with a cardiac-related diagnosis within the 1-year tracking period was counted as an event for this study. Tracking continued until a subject was admitted to the hospital with a cardiac-related discharge diagnosis, died, or 1 year since the time of the exercise test had passed.
Statistical analysis
The intraclass correlation coefficient (ICC) assessed reliability amongst the 25, 50, 75, and 100% VE/VCO2 slope categories. Univariate Cox regression analysis determined the ability of the 25, 50, 75, and 100% VE/ VCO2 slope categories, five randomly selected VE/VCO2 slope categories (r1-5) and peak VO2 to predict cardiac-related hospitalization and mortality over a 1-year period. The construction of the randomly selected VE/VCO2 slope classification schemes is described in the testing procedures and data collection section. Nine separate multivariate Cox regression analyses were conducted using each of the VE/VCO2 slope classification schemes and peak VO2 to predict cardiac-related hospitalization and mortality over a 1-year period. A statistical software program was used for data analysis (SPSS 10.0 for Windows; Chicago, Illinois, USA). All statistical tests with a P value < 0.05 were considered significant.
Results
The primary endpoint for each exercise test was volitional fatigue with no adverse events warranting premature test termination occurring. None of the exercise tests were terminated secondary to angina. The mean peak respiratory exchange ratio (RER) was 1.06 (± 0.11). Fifty-one of the subjects had a peak RER ≥ 1.0. Twelve of the remaining 21 subjects had a peak RER ≥ 0.95. Mean and standard deviation of peak VO2, 25, 50, 75, and 100% VE/VCO2 slope categories, and randomly selected VE/VCO2 slope categories (r1-r5) are listed in Table 2. A graphic representation of mean values of the variables of interest is illustrated in Figure 2.
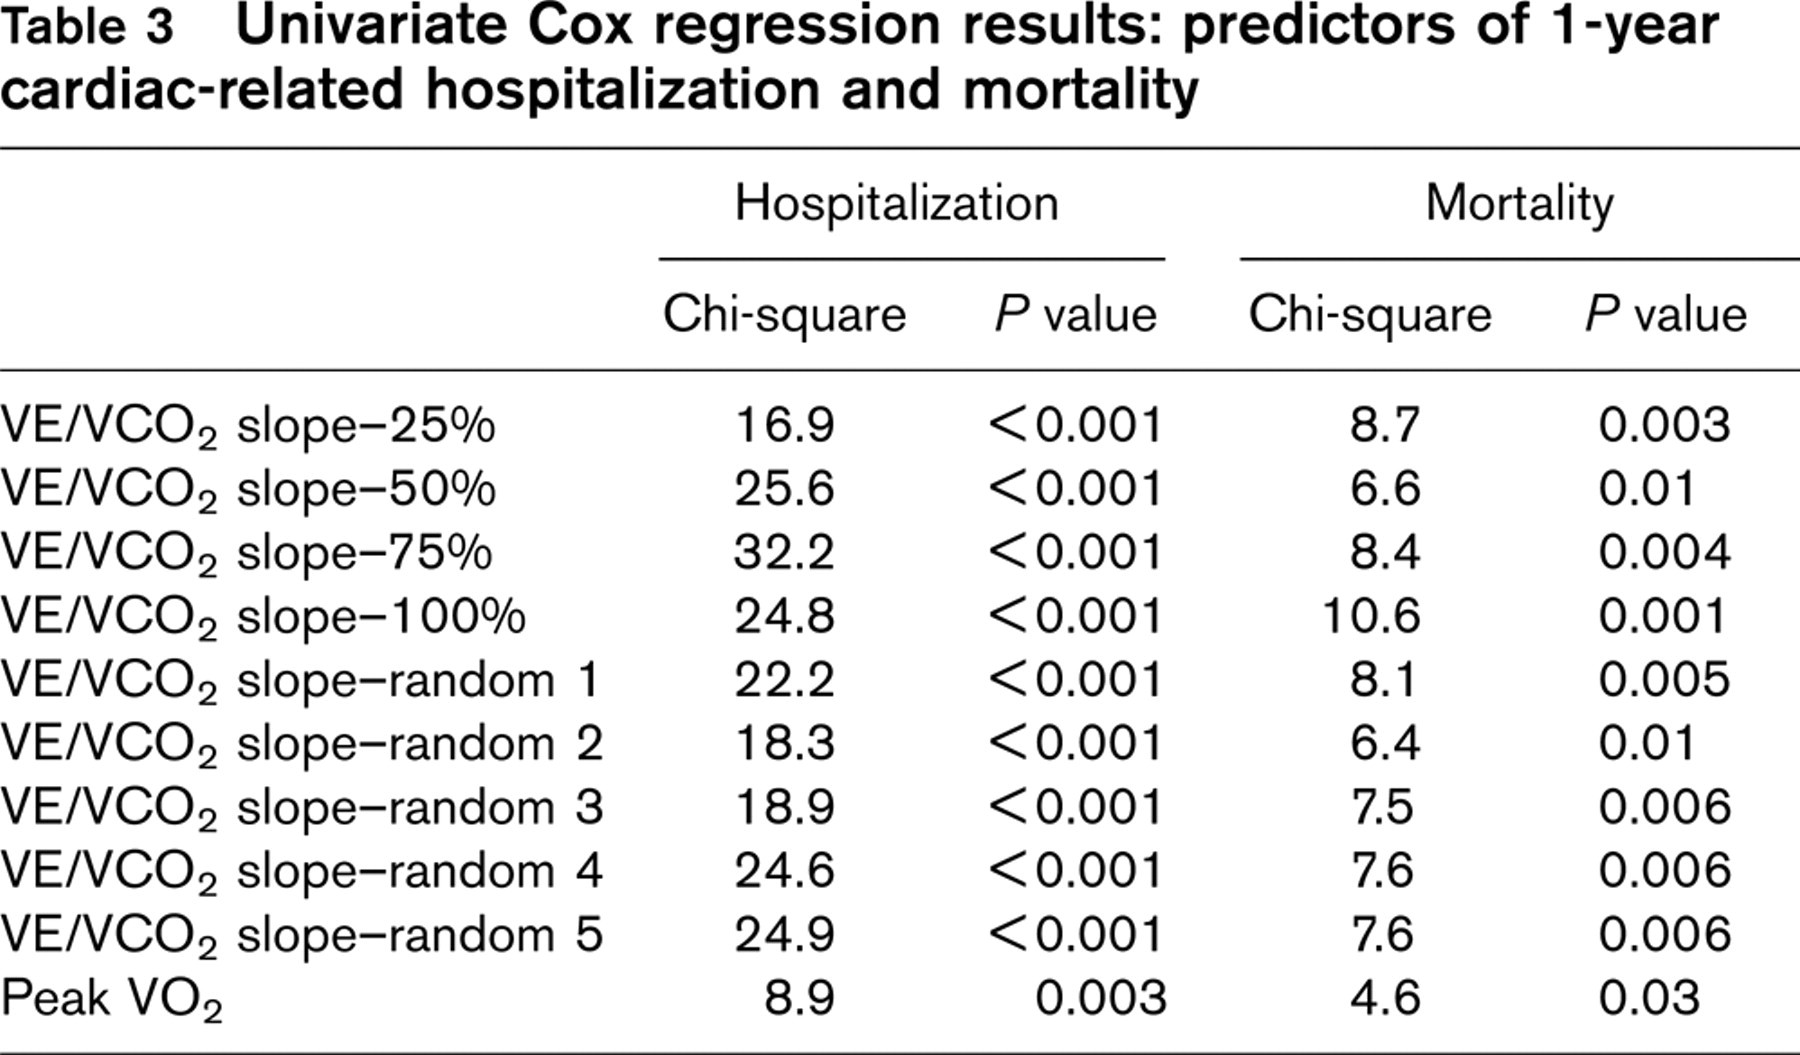
The ICC found reliability amongst the 25, 50, 75, and 100% VE/VCO2 slope calculations to be highly significant (alpha = 0.94, P < 0.0001). Twenty-five of 72 (34.7%) subjects were hospitalized with a cardiac-related discharge diagnosis in the year following the exercise test. There were additionally eight (11.7%) cardiac-related deaths 1 year after exercise testing. Univariate Cox regression results are presented in Table 3. All VE/VCO2 slope classification schemes and peak VO2 were significant predictors of 1-year cardiac-related hospitalization and mortality.
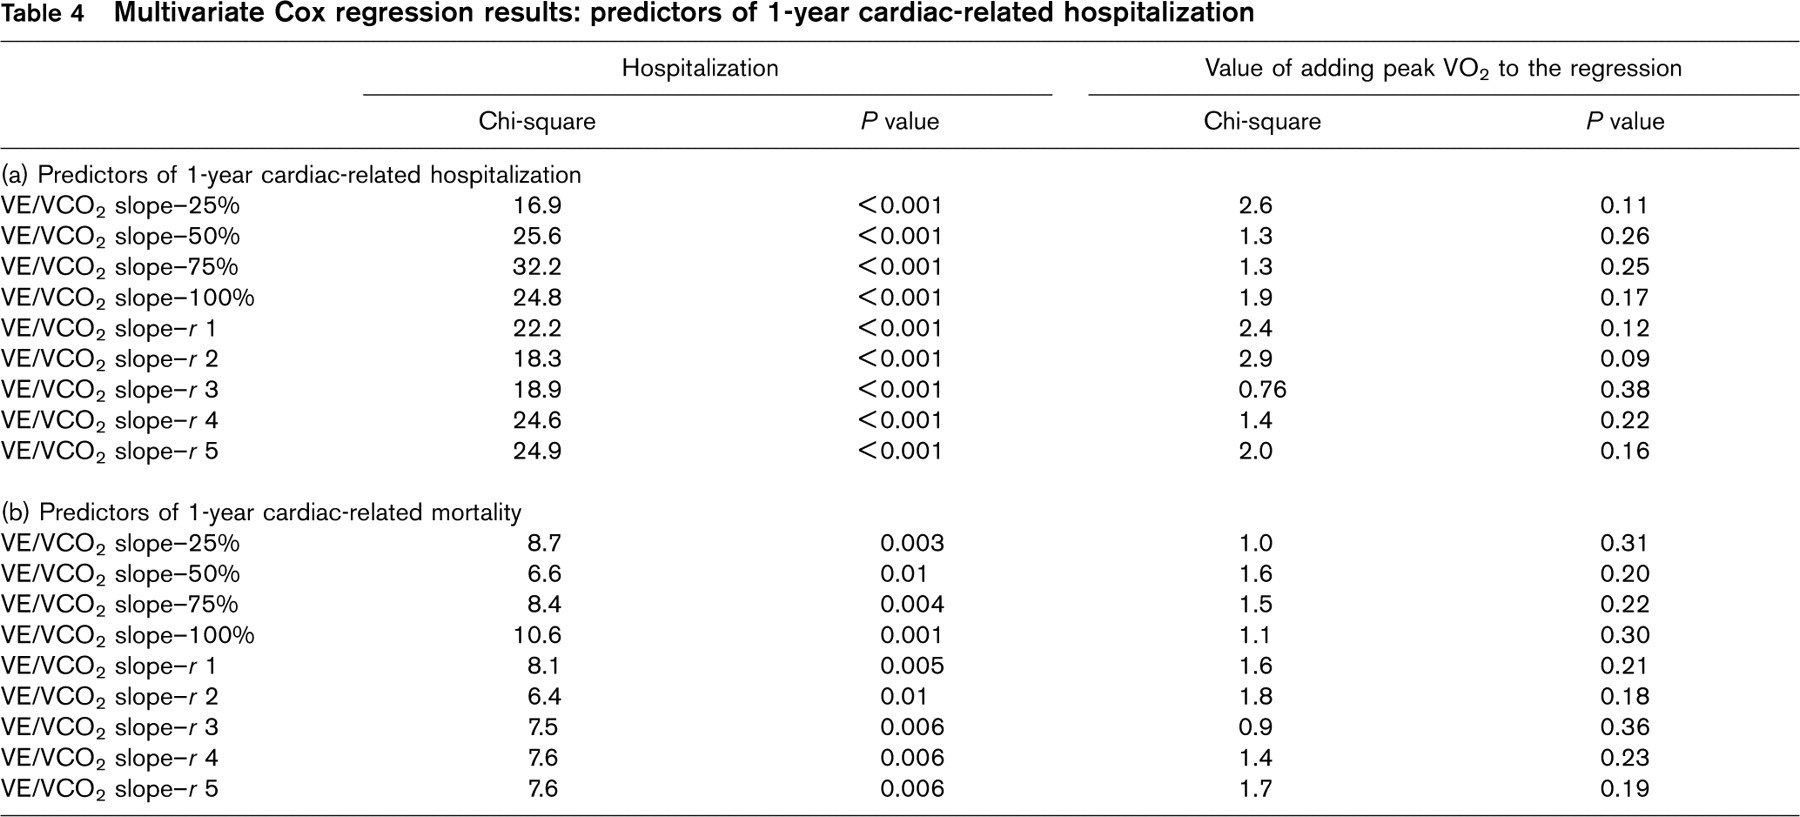
Multivariate Cox regression results are presented in Table 4. In each of the analyses, peak VO2 did not significantly improve prediction of 1-year cardiac-related hospitalization or mortality and was removed from the equation.
Mean and standard deviation of pertinent ventilatory expired gas calculations∗
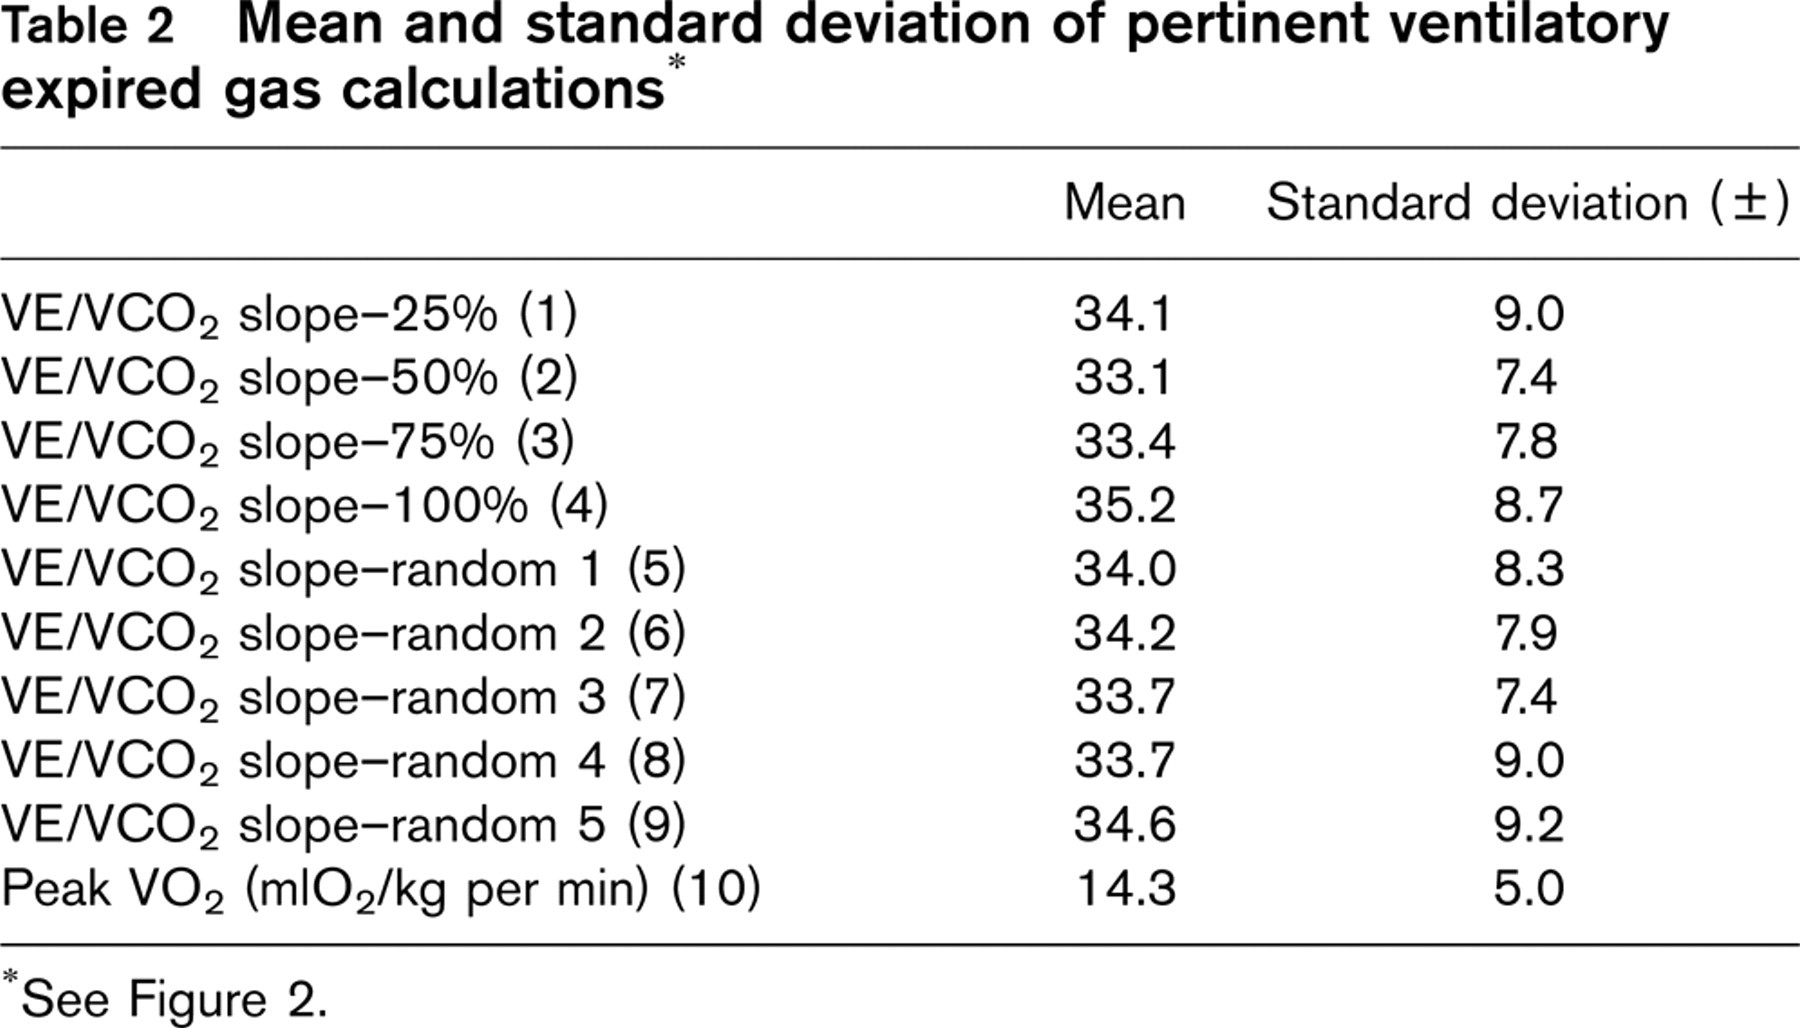
See Figure 2.
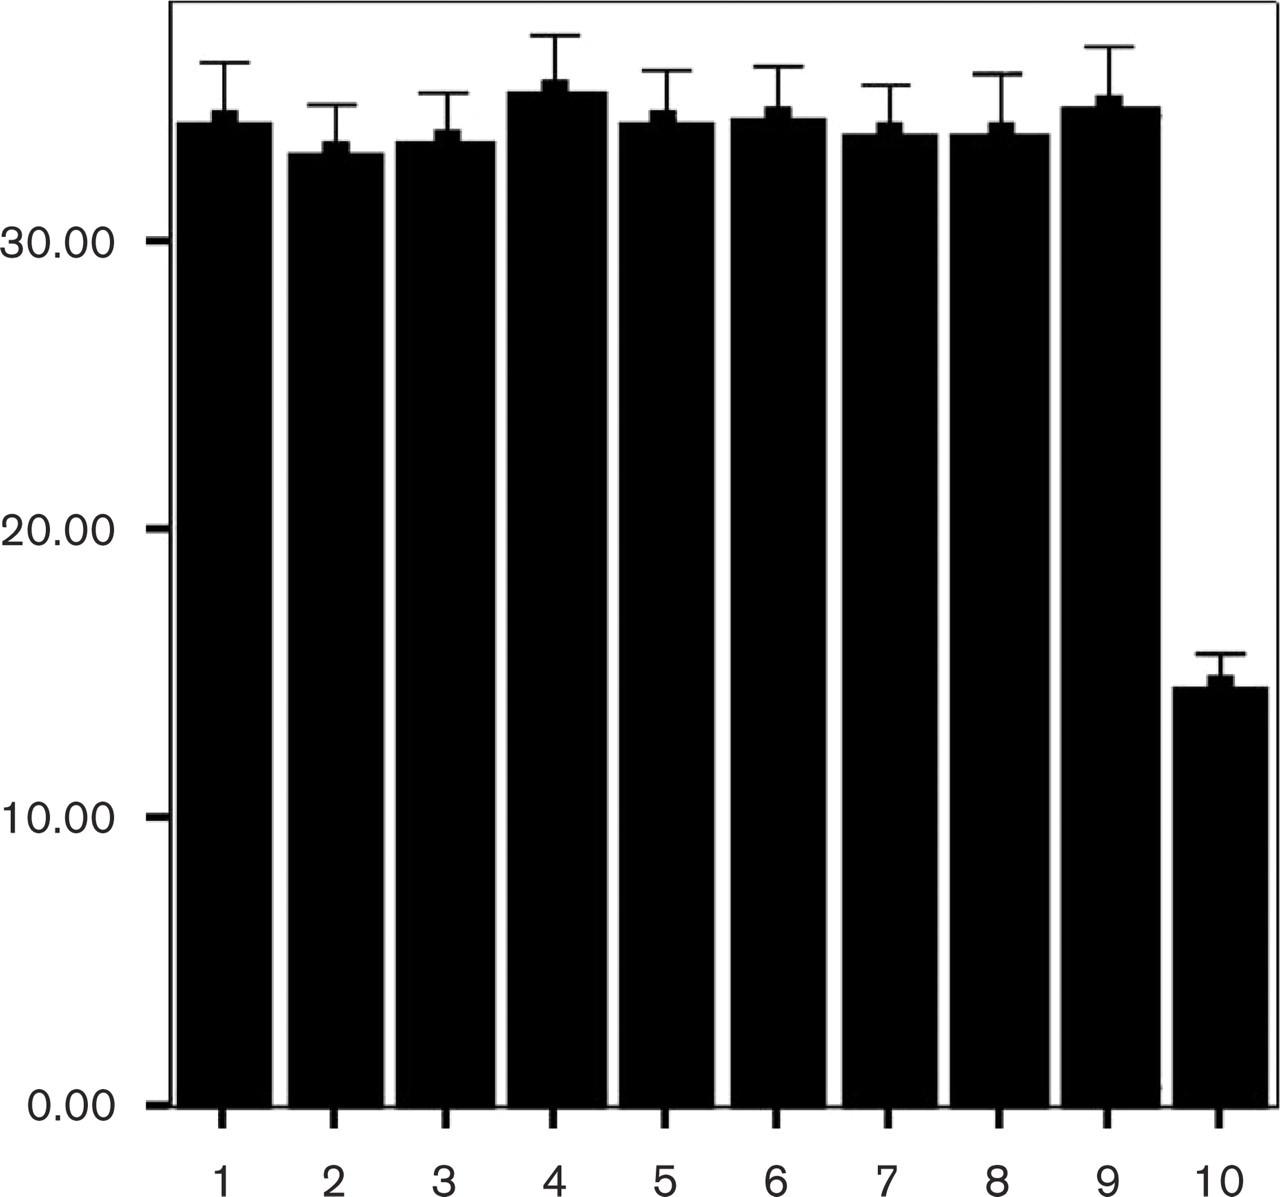
Mean values of VE/VCO2 slope categories and peak VO2. Bar graph numbers on x-axis correspond to numbers in parenthesis in Table 2.
Univariate Cox regression results: predictors of 1-year cardiac-related hospitalization and mortality
Discussion
The results of the present study indicate that VE/VCO2 slope is a reliable measure, which maintains prognostic value irrespective of the exercise test time interval used for calculation. Maintenance of prognostic value indicates that VE/VCO2 is independent of subject effort. This may be a primary reason for the prognostic superiority of the VE/VCO2 slope over peak VO2 (an effort-dependent parameter) as demonstrated by several investigations [6, 8, 10].
The five random VE/VCO2 slope categories were created to ensure that patterns within the classification schemes (25, 50, 75, and 100%) did not influence prognostic value. The random categories may more accurately reflect clinical practice as exercise effort varies among subjects. As indicated by the univariate and multivariate Cox regression analysis in Tables 3 and 4, the prognostic capability of the VE/VCO2 slope was highly consistent.
Decreased pulmonary perfusion and cardiac function appear to be a leading mechanism behind the elevated VE/VCO2 slope observed in some patients with HF [7, 14–16]. Additionally, the abnormal VE-VCO2 relationship, when observed in patients with HF, is often apparent at rest and throughout exercise. Given the association between cardiopulmonary function and the VE-VCO2 relationship during both rest and exercise, the robust predictive value of this ventilatory expired gas measure should come as no surprise.
An assumption of the present study is all subjects put forth near maximal effort represented by the 100% VE/VCO2 slope classification scheme. Although the mean peak respiratory exchange ratio was above one (1.06), some subjects were most certainly at submaximal effort when the exercise test was terminated. While the authors recognize this assumption as a limitation, the fact that the VE/VCO2 slope was a significant predictor of hospitalization and mortality irrespective of calculation scheme should not be dismissed.
Determining and recommending an optimal exercise test time interval for VE/VCO2 slope calculation or cutoff value is not the intent of the present study. Quartile calculations were an arbitrary selection and should not be implemented into clinical practice. The intent was rather to simulate submaximal effort and demonstrate that the VE/VCO2 slope maintains prognostic value, which was achieved. Presently, the VE/VCO2 slope has primarily been calculated by either using data to the point of ventilatory threshold [8] or to peak exercise [10]. The premise for using data only to the point of ventilatory threshold for the calculation is the belief that the excessive rise in VE following an increase in anaerobic metabolism causes the VE/VCO2 slope to become nonlinear and capturing this response adds no value. Strong scientific support for an optimal VE/VCO2 slope expression is, however, lacking and both methods of calculation (to the point of ventilatory threshold and to maximal exercise) have produced a measure of prognostic value. The authors feel a deeper discussion of this issue is beyond the scope of this study and recommend further investigation to examine the possibility of an optimal VE/VCO2 slope calculation method.
The choice of endpoints for the present study was based upon previous investigations and the authors view on the time period and information that potentially provides optimal clinical data. Limiting endpoints to a 1-year time period may be clinically optimal given the fluid nature of cardiac function in the HF patient. Since individuals with HF can shift from compensated to uncompensated HF (or vice versa) rather abruptly, limiting the time period a single exercise test is used for prognostic assessment seems prudent. A 1-year tracking period may strike a sufficient balance between avoiding outdated information and the economic constraints of multiple exercise tests. Additionally, most research examining the prognostic value of ventilatory expired gas parameters do not use hospitalization as an endpoint. Given that HF is the primary hospital diagnostic-related group among Medicare patients [17], analysis of measures predicting hospitalization in this population seems warranted. The ability of the VE/VCO2 slope to effectively predict hospitalization may provide clinicians with the unique opportunity to identify high-risk patients, provide appropriate interventions, prevent non-fatal adverse events, and reduce cost of care.
Multivariate Cox regression results: predictors of 1-year cardiac-related hospitalization
Of paramount importance is the need for future investigations to clearly define the clinical role of the VE/VCO2 slope in assessing patients with HF. With regards to exercise testing, peak VO2 is presently the ventilatory expired gas gold standard measure when determining prognosis and guiding clinical decisions in the HF population. The dependence attainment of a true peak VO2 has on subject effort is a limitation considering the apprehension a patient with HF may have in physically exerting himself/herself to maximal capacity. The prognostic value of the VE/VCO2 slope, as supported by the findings of the present study, does not appear to have an effort-dependent limitation and consistently outperforms peak VO2 in predicting outcome. If further investigations continue to demonstrate the prognostic superiority of the VE/VCO2 slope over peak VO2, thought should be given to revising clinical guidelines, which define interpretation of ventilatory expired gas data in the HF population. The authors are certainly not suggesting peak VO2 should be disregarded. Analysis of this measure has consistently demonstrated prognostic value [2–4, 18] and is the cornerstone of prescribing exercise/activity guidelines [1]. However, given the building body of evidence reporting the diagnostic/prognostic value of the VE-VCO2 relationship in the HF population [3, 5–8, 10, 19], thought should be given to optimizing the value of information obtained from exercise testing with ventilatory expired gas analysis.
In conclusion, the VE/VCO2 slope continues to show clinical promise as a prognostic marker in HF. The fact that this measure, independent of subject effort, is reproducible at different exercise test time intervals and maintains prognostic value may help to explain the findings of this and previous investigations.