
Abstract
Background
Most studies on the effect of alcohol consumption on coronary heart disease or all-cause mortality assess alcohol intake at one point in time and therefore do not take into consideration changes in drinking habits over time. We investigate whether a second assessment of alcohol intake substantially improves estimation of the effects of alcohol intake on these outcomes.
Design
A prospective cohort study of 2710 men and women, age 35-64 years at baseline in 1984/85 in the Augsburg region in southern Germany. We recorded incident fatal and non-fatal coronary events and all-cause mortality until 1997. Alcohol intake and other explanatory variables were assessed in 1984/85 and 1987/88.
Methods
Based on these assessments, participants were classified as non-drinkers, quitters, starters and constant drinkers. We calculated hazard rate ratios for coronary events and all-cause mortality in these groups and adjusted for several potential confounders using Cox's proportional hazards model. These estimates were compared with hazard rate ratios based on a single assessment of alcohol intake in 1987/88.
Results
Among male constant drinkers the adjusted hazard rate ratio (HRR) for coronary events was lowest among those consuming 0.1-19.9 g alcohol per day, compared with non-drinkers [HRR 0.29; 95% confidence interval (Cl) 0.12-0.70]. The lowest all-cause mortality risk was observed among men drinking 20.0-39.9 g per day (HRR 0.48; 95% Cl 0.26-0.88). In female constant drinkers the HRR for all-cause mortality was 0.71 (95% Cl 0.40-1.26) for those reporting 0.1-19.9 g daily alcohol consumption. Hazard rate ratios for alcohol intake classified by two assessments consistently revealed a more pronounced beneficial effect of alcohol consumption than those for alcohol intake groups based on a single measurement.
Conclusions
Assessment of alcohol intake at two points in time seems slightly to improve the risk estimation for coronary heart disease (CHD) and for all-cause mortality, compared with a single measurement. Thus, our findings strengthen the evidence of a beneficial effect of light to moderate alcohol consumption on coronary heart disease and all-cause mortality.
Introduction
A wealth of epidemiological and experimental studies have demonstrated a reduced risk of coronary heart disease (CHD) among people consuming light to moderate amounts of alcohol, compared with non-drinkers [1–5]. A recent meta-analysis of 28 cohort studies showed a maximum risk reduction for CHD at a drinking level of 20 g/day and a significantly increased CHD-risk at 89 g or more per day [6]. This beneficial effect of alcohol on CHD is carried forward to all-cause mortality patterns on a population level. Since a considerable fraction of deaths in developed countries are due to CHD, all-cause mortality rates are usually lower among light to moderate drinkers. However, among heavy drinkers harmful effects of alcohol on diseases other than CHD dominate, leading to a U- or J-shaped all-cause mortality pattern [7–11].
Individual drinking habits change over time, even over short time periods. These changes were often not addressed in previous epidemiological studies, which were designed as prospective cohort studies with only a single assessment of current alcohol consumption at the beginning of follow-up. In these studies the estimation of the effect of alcohol consumption on CHD and all-cause mortality may be hampered by misclassification of alcohol intake.
There is some discussion in the literature as to whether non-drinkers may contain a considerable fraction of ex-drinkers and especially ‘sick quitters’. The latter refers to people who abstained from drinking alcohol because of poor health and may thus introduce a selection bias which results in unduly high-risk estimates for CHD and all-cause mortality for non-drinkers [12].
However, a limited number of studies obtained alcohol intake at two or more points in time [11,13–18]. They either explicitly analysed the health effects in subjects who changed alcohol drinking habits or estimated the effect of alcohol intake by employing statistical methods for time-varying exposure variables. We investigate whether concentrating on subjects with more or less constant alcohol intake improves estimation of alcohol effects. For this purpose, we extended the analysis of data from the MONICA-Augsburg cohort study (Monitoring Trends and Determinants in Cardiovascular Disease) by Keil et al. [19] with respect to follow-up time and age range of the participants. While the original study [19] used data on alcohol intake assessed at the baseline survey in 1984/85 only, we now also utilize a repeated assessment of alcohol intake (and other explanatory variables) in 1987/88 on the same participants. Besides an analysis of ‘constant drinkers’ we also briefly investigate subjects with changing drinking patterns, especially quitters.
Methods
Design of the MONICA-Augsburg Cohort Study
The MONICA-Augsburg cohort study, part of the multinational World Health Organization MONICA project [20], was initiated in 1984/85 in the city of Augsburg, Germany, and two adjacent counties [21]. A random sample of 5312 persons of German nationality, stratified for age, was drawn from the population of 282279 inhabitants aged 25-64 years. A response of 79.3% was achieved; that is, 4022 out of 5069 eligible people participated in the study.
The data were gathered through interview and physical examination, adhering to the standards prescribed by the MONICA Manual [22]. This baseline examination was repeated from October 1987 to June 1988, with the same participants.
Assessment of alcohol intake
Each subject was asked at baseline in 1984/85 and in the second examination in 1987/88, how much beer, wine and spirits he or she had drunk on the previous workday and over the previous weekend. We multiply the weekday consumption by five and add this figure to the weekend consumption to obtain the alcohol consumption per week in 1984/85 and in 1987/88. These numbers are converted to total alcohol intake per day, using the following conversion: 11 beer = 40 g alcohol, 11 wine = 100 g alcohol, 1 shot spirits (0.021) = 6.2 g alcohol [19]. For the baseline examination, this 7-day recall method was validated against a 7-day dietary record method in 899 male participants, aged 45-64 years. The Pearson correlation coefficient between the two methods was 0.75 [19, 23].
For our present analyses we use the participants’ characteristics obtained from the second examination in 1987/88. However, alcohol intake from 1984/85 is used to characterize the participants’ alcohol consumption on a broader basis. For the purpose of this paper, we label people with no self-reported alcohol intake in both examinations as ‘non-drinkers’. These subjects provide the reference group for estimates of relative risks. People claiming to drink alcohol in both interviews (‘constant drinkers’) constitute by far the largest group. They are categorized by their alcohol intake in 1987/88 at 20, 40, 80 g of alcohol per day for men and 20 g per day for women. Furthermore, we distinguish subjects who reported alcohol consumption in one examination only as ‘quitters’ or ‘starters’. In view of a comparison of classification schemes, subjects are also categorized according to their alcohol intake in 1987/88 only, using the same cut-off points as above.
Assessment of other explanatory variables
Participants were interviewed at baseline in 1984/85 and followed up 3 years later, with respect to medical history, smoking habits and socio-economic factors. The interviews were complemented by physical examinations. For the present analyses the following definitions and categorizations of these data from the second of the two surveys were used.
Age is calculated for the time when the random sample for the baseline survey of 1984/85 was drawn and is given in years. Partner situation was defined as living with or without a partner independent of marital status. Educational attainment was estimated by recording years of schooling completed and dichotomized into 10 years or less and more than 10 years.
Body mass index (BMI) was calculated as weight (kg) per height squared (m2) and is categorized at cut-off points 25 and 30 kg/m2. A current smoker was defined as someone who reported smoking one cigarette or more per day. Physical activity was assessed by the question: ‘How often do you participate in sports?’ Answer categories included more than 2 h per week, 1-2 h per week, less than 1 h per week and no sport activity. Activities in the winter and summer seasons were asked separately. For the analyses answers were dichotomized into less than 1 h per week and 1 or more hours per week.
Non-fasting blood samples were drawn under standardized conditions from each participant. Serum total cholesterol and high-density lipoprotein-cholesterol analyses were carried out on an autoanalyser at the laboratory of the Zentralklinikum Augsburg, using standard laboratory methods [21]. Internal and external quality control on laboratory analyses was performed according to the WHO MONICA Manual [22]. Serum total cholesterol is used as a continuous variable in the statistical models.
Systolic and diastolic blood pressure were measured with the Hawksley random zero sphygmomanometer three times under standardized conditions [22]. All results concerning blood pressure values are based on the first and fifth phase of the Korotkoff sounds and on the calculation of the mean of the second and third blood pressure measurements. Subjects having blood pressure values ≥ 160 mmHg systolic or ≥ 95 mmHg diastolic were defined as hypertensive, in accordance with previous publications [21]. Participants aware of hypertension and taking medication against hypertension were also classified as hypertensive.
Subjects were asked if they had ever been diagnosed by a physician as having had myocardial infarction, stroke or diabetes. A number of other diseases and conditions within the previous 12 months were assessed by self-reports. Stomach disease comprised ulcus ventriculi, ulcus duodeni and gastritis.
Self-perceived health status was assessed with the question: ‘How do you rate your health status compared with others of your age?’ Answer categories were ‘better’, ‘worse’, ‘same’ and ‘do not know’. For multivariable statistical models a single indicator variable for self-rated health, namely ‘worse than others’ was used.
Morbidity and mortality follow-up
Follow-up was conducted from 1984 to 1997, assessing non-fatal and fatal CHD cases by means of the MONICA-Augsburg coronary event register. It covers the population from which the sample of the 1984/85 survey was drawn and monitors fatal and non-fatal CHD events outside and inside hospitals of the study area [24] up to the age of 75 years. Older participants are censored on their 75th birthday. Total mortality was monitored by regularly checking the vital status of all cohort members in the population registries inside and outside the study area without an upper age limit. This procedure guaranteed that the vital status of cohort members who had moved out of the study area could also be assessed.
The WHO MONICA diagnostic categories (derived from electrocardiographic tracings and enzyme, symptom and necropsy findings) were used to define: (1) definite and possible non-fatal acute myocardial infarction, and (2) fatal CHD (combining definite and possible fatal coronary events and fatal cases with insufficient data). Detailed descriptions of the definitions and applications of these diagnostic categories have been published [25]. A CHD event was categorized as incident if it was the first event during follow-up in a person reporting no history of acute myocardial infarction in the 1984/85 survey.
Study population
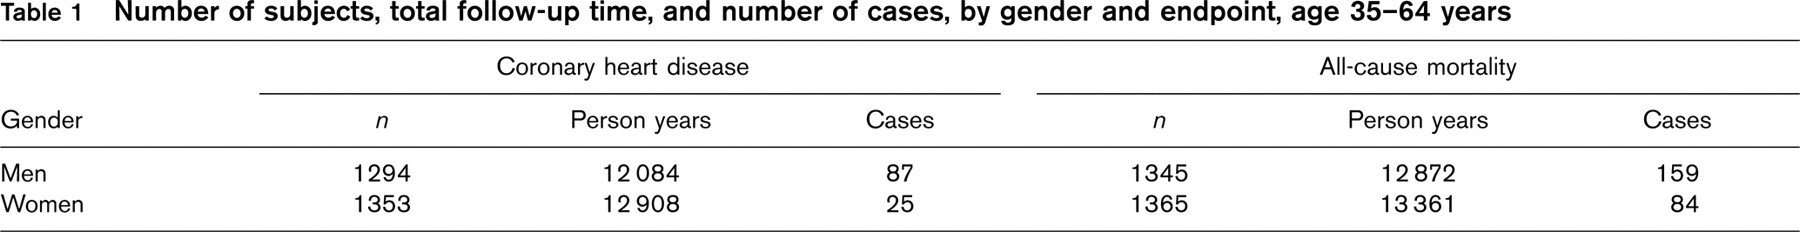
Among the participants of the baseline examination in 1984/85, 1559 men and 1536 women were in the age range 35-64 years and are therefore potentially eligible for our analyses. However, the main analyses are based on subjects who also participated in the examination in 1987/88 (1421 men and 1457 women). Among them, 76 men and 92 women with incomplete data on potential confounders at the examination in 1987/88 or incomplete data on alcohol intake on at least one examination were excluded from the analyses. These drop outs were mostly due to missing cholesterol values (61 men and 76 women). After these exclusions, 1345 men and 1365 women were eligible for the main analyses on all-cause mortality (see Table 1).
For the analyses of CHD incidence some further subjects had to be excluded who either reported CHD events prior to the survey in 1984/85 or experienced such an event between both surveys. The main analyses of CHD incidence are therefore based on the data of 1294 men and 1353 women. The number of subjects, the observed person-years and the number of events used in the final analyses for coronary heart disease and all-cause mortality are reported in Table 1. In addition, 138 men and 79 women attending only the baseline survey are investigated in accompanying analyses.
Statistical methods
The distribution of alcohol intake patterns and potential confounders is described by means of absolute numbers and percentages for categorical variables and means for continuous variables. The effect of alcohol intake on CHD incidence and all-cause mortality is analysed by the Cox proportional hazards model [26], adjusted for potential confounders. The selection of potential confounders is in line with our previous study [19]. Independent variables for the Cox models are taken from the survey in 1987/88, except for alcohol consumption, which is assessed at both examinations, as described above.
Number of subjects, total follow-up time, and number of cases, by gender and endpoint, age 35-64 years
Three-year changes of alcohol intake in men
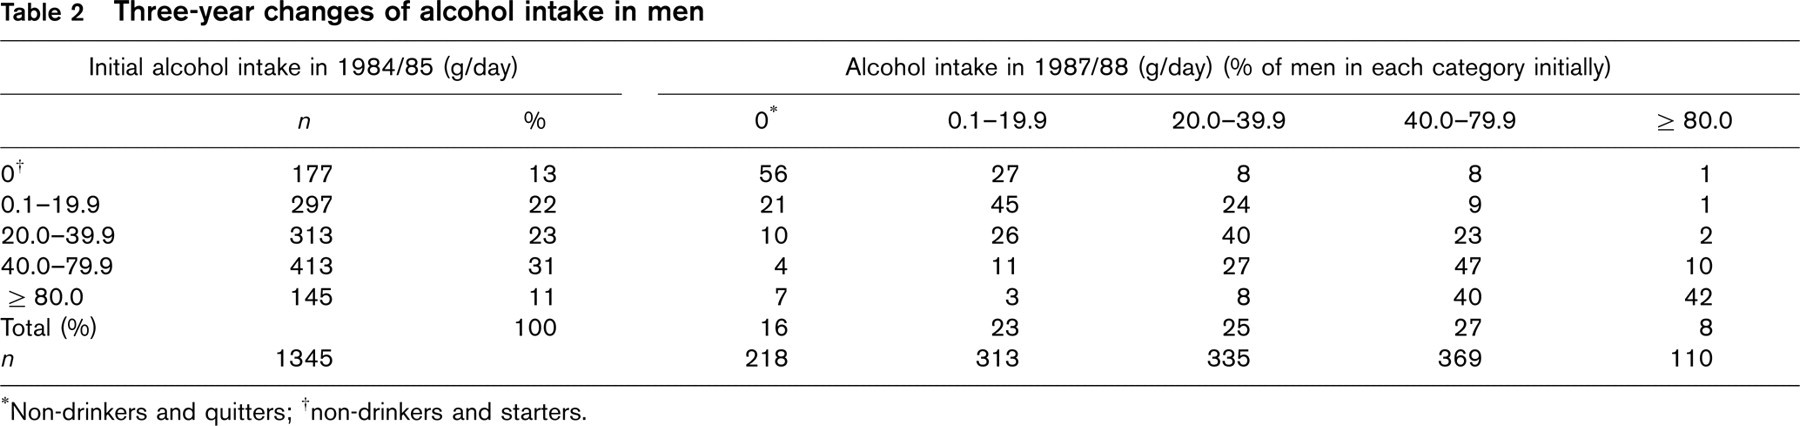
†non-drinkers and starters.
We define the date of the examination in 1987/88 as the starting point of our cohort. Therefore, the basic time variable for the Cox models is follow-up time since this date. However, for some auxiliary Cox regression analyses time since baseline examination in 1984/85 is used.
Results
Results of follow-up
During a median follow-up time from 1987/88 to 1997 of 10.0 years in men and 10.1 years in women, more than 12000 person-years for each men and women were accumulated. In men, 87 fatal and non-fatal CHD events and 159 deaths from all causes occurred; in women, 25 fatal and non-fatal CHD cases and 84 deaths from all causes were recorded (Table 1). Due to the small number of CHD cases in women we restricted the analyses to all-cause mortality in women.
Patterns of alcohol intake
In the two surveys, 87 and 84% of men and 61 and 56% of women, respectively, reported drinking alcohol (Tables 2 and 3). The mean alcohol consumption in men and women decreased from 36.5 and 10.7 g/day in 1984/85 to 32.2 and 8.7 g/day 3 years later, respectively. Spearman correlation coefficients were 0.63 for men and 0.56 for women.
In men, the alcohol categories are roughly equally distributed. Women show a clear tendency to low amounts of alcohol intake. In both sexes and every alcohol category the fraction of participants drinking about the same amount of alcohol in 1984/85 as in 1987/88 is predominant, but there is a considerable fraction of subjects who changed their drinking habits.
Table 4 presents descriptive statistics for baseline characteristics by pattern of alcohol consumption. The table shows no marked differences in age, body mass index or total cholesterol across categories of alcohol intake in men or women. The prevalence of cigarette smoking increases with increasing alcohol consumption among constant drinkers, however, male non-drinkers also had a high smoking prevalence. The highest prevalence of hypertension and antihypertensive treatment was observed in male non-drinkers and starters as well as in female non-drinkers. Subjects who reported drinking alcohol in both surveys seem to suffer less from health problems than non-drinkers, starters or quitters. We especially observed a relatively high prevalence of self-reported stroke, diabetes, liver disease and stomach disease in male quitters and an increased perception of self-reported health ‘worse than that of others’ in female non-drinkers.
Risk assessment
As a preliminary step we repeated the analyses of Keil et al. [19] of alcohol intake in 1984/85 and subsequent risk of CHD and all-cause mortality, but now based on a mean follow-up of 13 years until 1997. We observed the same type of L-shaped and U-shaped relationships, but risk reductions for drinkers were slightly lower in magnitude (data not shown).
Three-year changes of alcohol intake in women
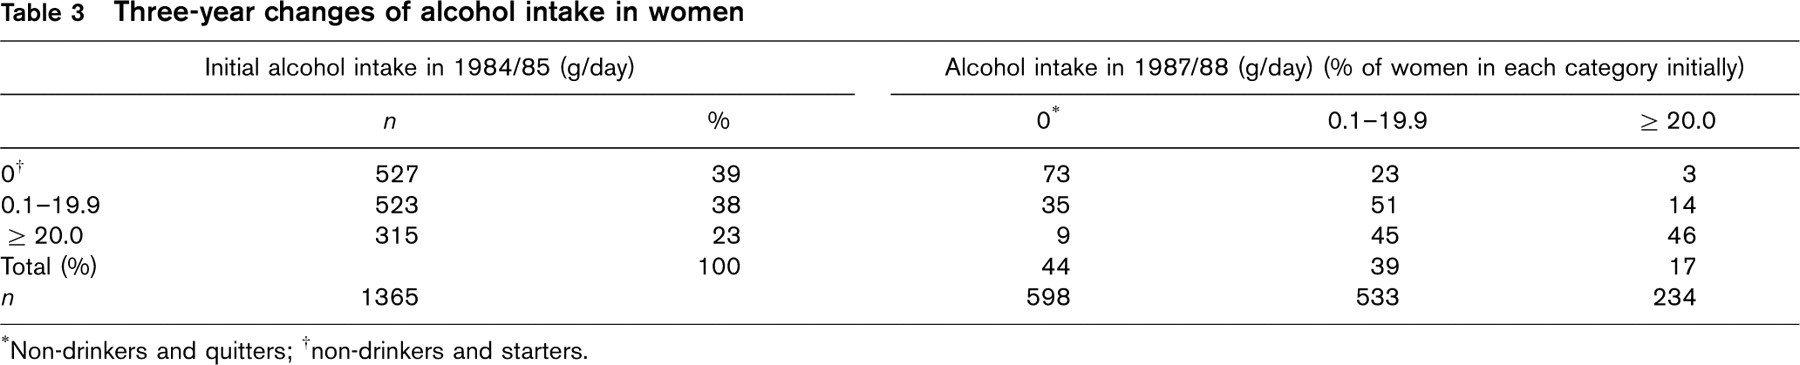
∗Non-drinkers and quitters;
†non-drinkers and starters.
Characteristics of the cohort in 1987/88 by pattern of alcohol intake
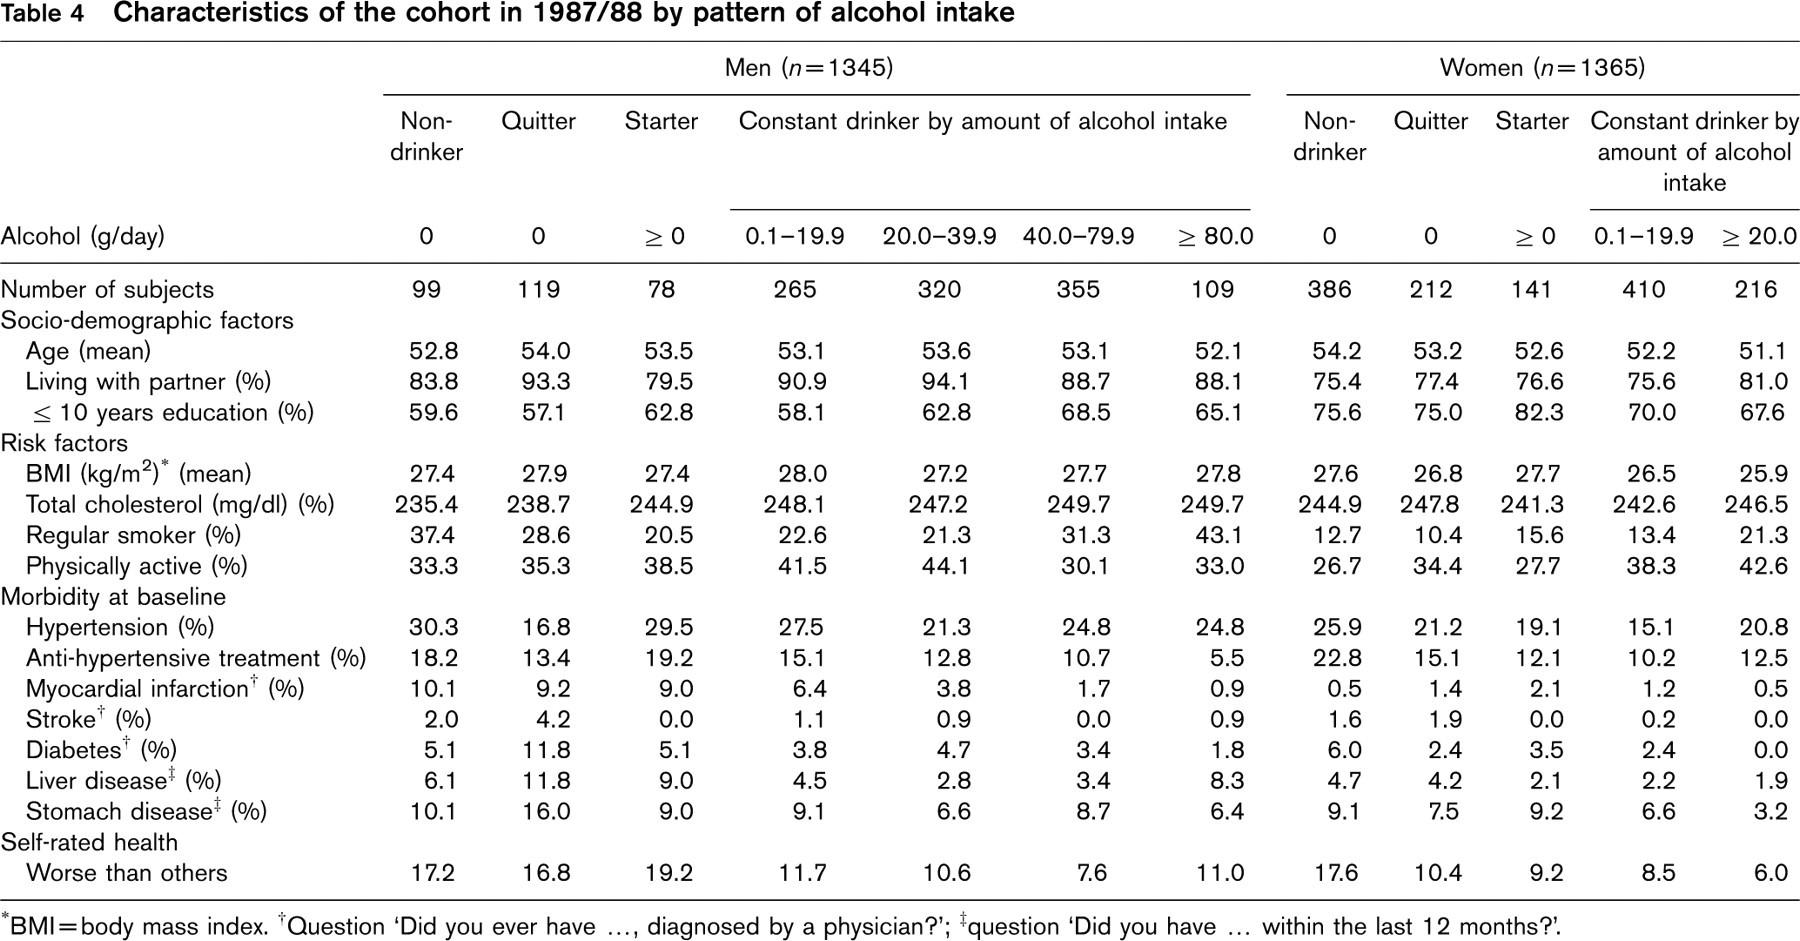
∗BMI = body mass index.
†Question ‘Did you ever have …, diagnosed by a physician?’;
‡question ‘Did you have … within the last 12 months?’.
Tables 5–7 show the results of the risk assessments by level of alcohol intake in 1987/88 and the risks for constant drinkers, starters and quitters versus non-drinkers as defined above. For this purpose we restricted the study cohort to those individuals with two assessments of alcohol intake in 1984/85 and 1987/88. During this time period 138 (9.3%) of the male participants of the interview in 1984/85 (n = 1345 + 138 = 1483) did not respond to the second interview, with different drop-out rates for each alcohol category. About 12% of male participants in the interview in 1984/85 were lost among those who drank no alcohol or more than 80 g per day in 1984/85, while 8 to 9% in the other drinking categories could not be followed. A considerable fraction of these drop-outs is due to death or CHD before 1987/88 (data not shown). Table 5 shows the CHD risks for men. The dose-response curves for both types of alcohol quantification are approximately L-shaped, with an additional peak in the 40.0-79.9 g/day category. The relative risks for constant drinkers versus non-drinkers, based on the two assessments of alcohol intake, are slightly but consistently lower than the corresponding relative risks by alcohol intake based on the data from 1987/88 alone.
Table 6 shows reduced HRRs in men who participated in both examinations for all-cause mortality for all levels of alcohol intake. The reduction in all-cause mortality reveals a similar pattern as for CHD-risks, but with relative risks closer to 1. Again, the risk reduction is more pronounced when the classification of subjects is based on two assessments of alcohol intake, compared with a single measurement.
The dose-response curve for all-cause mortality in women (Table 7) is U-shaped in both types of analyses. The relative risks for the highest alcohol category (≥ 20 g/day) are similar. In light drinkers (0-19.9 g/day), however, relative risks for constant versus non-drinkers are again slightly lower than the corresponding relative risks based on a single assessment in 1987/88 only.
Effects of alcohol intake and change in consumption on risk of developing coronary heart disease in men after 10 years of follow-up
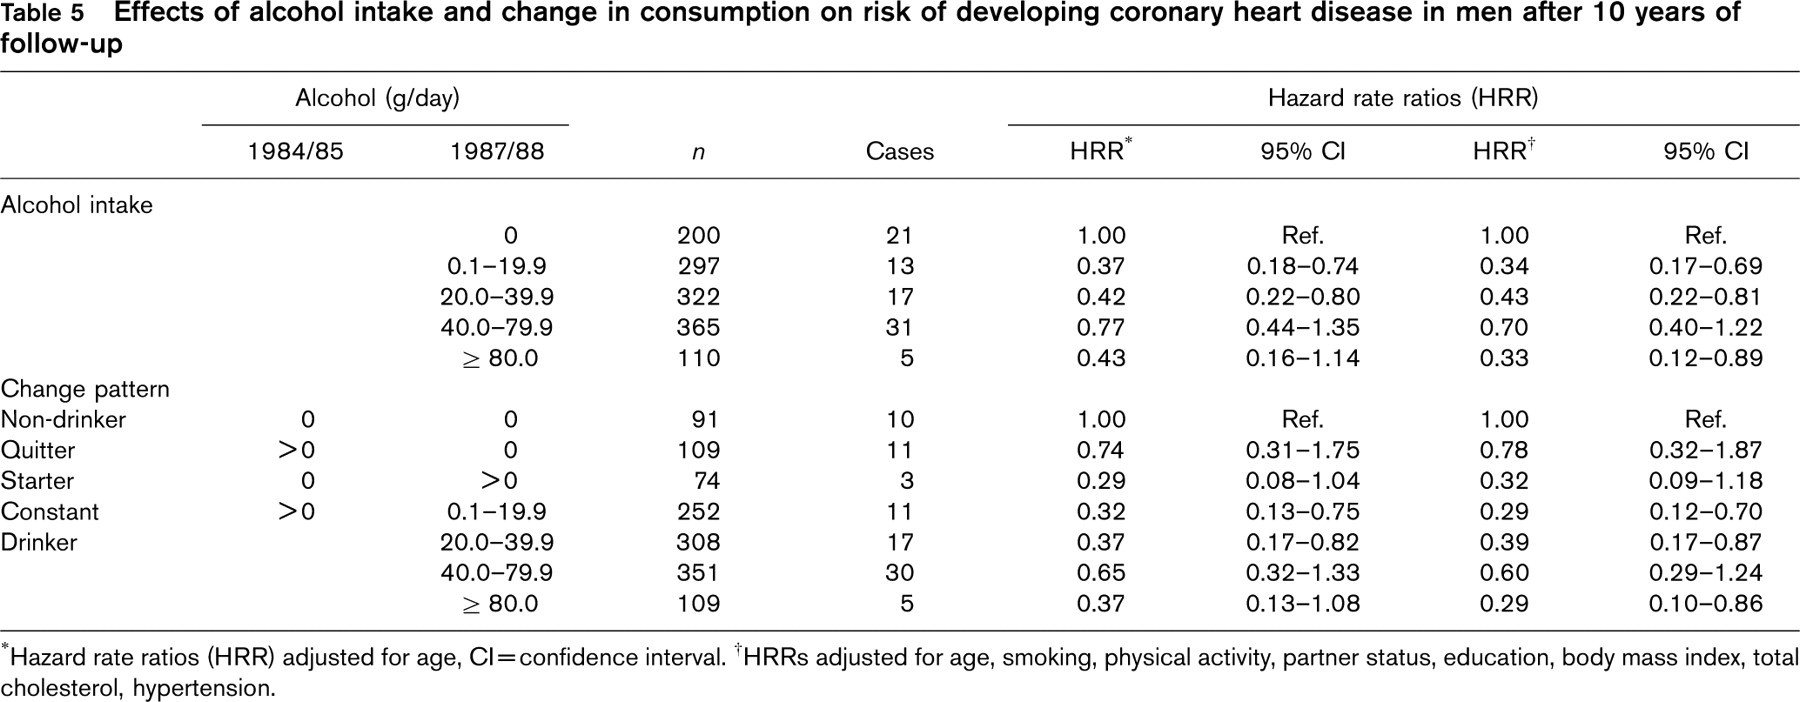
∗Hazard rate ratios (HRR) adjusted for age, Cl = confidence interval.
†HRRs adjusted for age, smoking, physical activity, partner status, education, body mass index, total cholesterol, hypertension.
Effects of alcohol intake and change in consumption on all-cause mortality in men after 10 years of follow-up
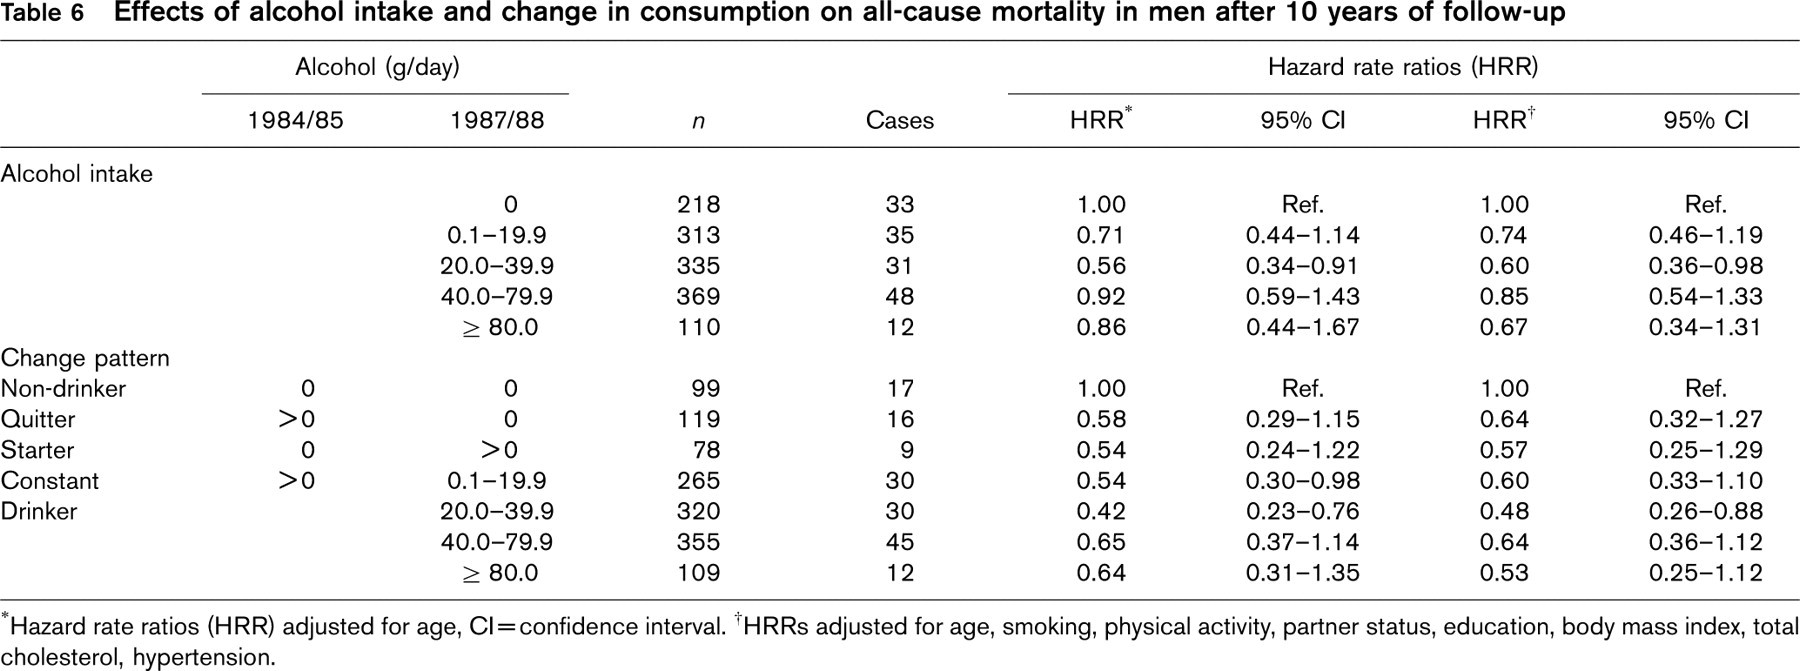
∗Hazard rate ratios (HRR) adjusted for age, Cl = confidence interval.
†HRRs adjusted for age, smoking, physical activity, partner status, education, body mass index, total cholesterol, hypertension.
Regarding the changes in alcohol intake between both surveys, in all analyses the quitters and especially the starters have a reduced risk for CHD or all-cause mortality, compared with the non-drinkers. In all regression analyses adjustment for potential confounders does not materially change the results, as is shown when comparing adjusted HRRs with those only adjusted for age. Additional adjustment for self-rated health does not change the results either (data not shown).
Discussion
In this population-based study from southern Germany we observed considerable changes in alcohol intake over a 3-year period. The overall trend showed a slightly reduced alcohol intake at the second examination in 1987/88. This finding is consistent with prospective studies in other populations [13, 14, 16] and the trend observed with the two MONICA-Augsburg surveys performed in 1984/85 and 1989/90 [27]. But on an individual level, between 40 and 60% of male participants changed from one category of alcohol intake in 1984/85 to another in 1987/88, dependent upon the initial level of intake. In women, the percentage who changed was slightly lower (30-50%). These changes within a 3-year period seem to support the necessity to assess alcohol intake on a repeated basis.
In spite of many studies to date on alcohol consumption and its relation to CHD and all-cause mortality, few have made repeated measurements of alcohol intake and investigated the importance of changes in alcohol consumption over time. Three studies assessed alcohol intake of each participant at more than two (three to six) points in time over the whole study period [11, 14, 15]. They employed appropriate statistical methods to utilize the information on a time-dependent exposure variable. These studies confirmed the beneficial effect of light to moderate alcohol intake on cardiovascular diseases and all-cause mortality.
Effects of alcohol intake and change in consumption on all-cause mortality in women after 10 years of follow-up
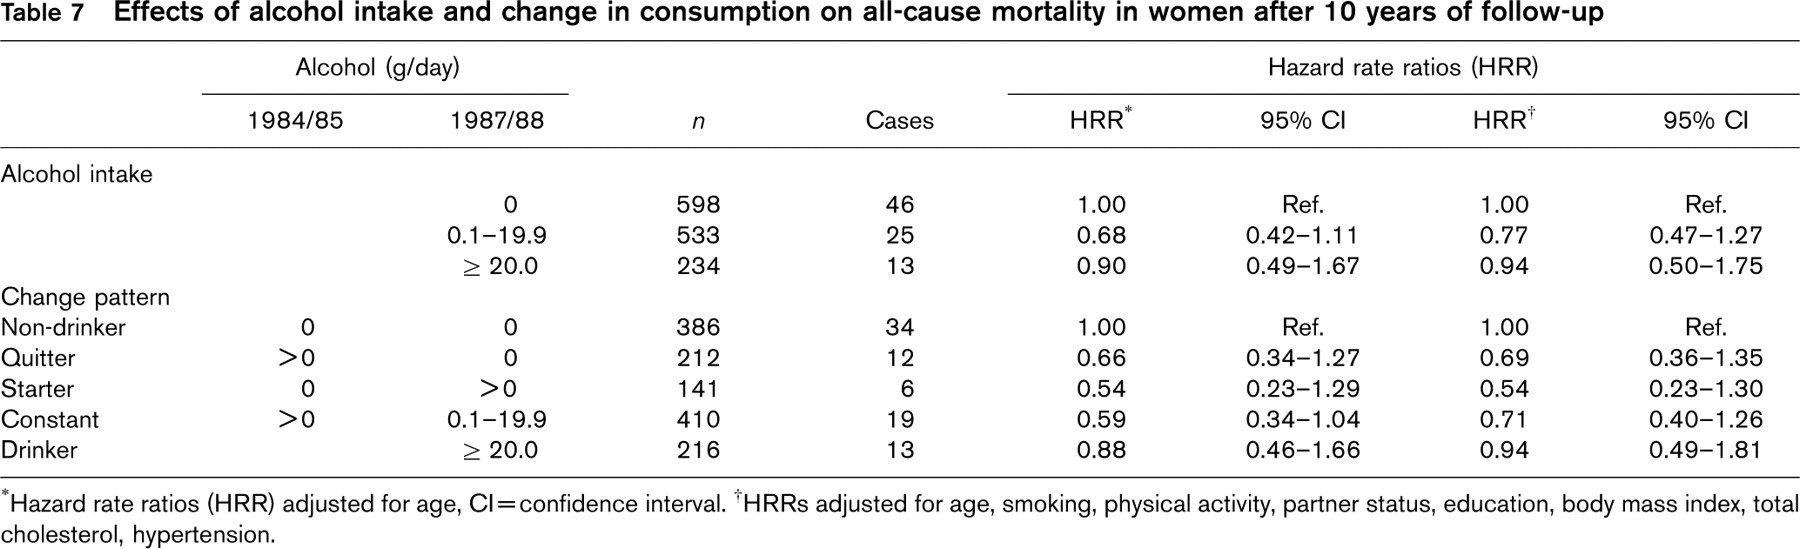
∗Hazard rate ratios (HRR) adjusted for age, Cl = confidence interval.
†HRRs adjusted for age, smoking, physical activity, partner status, education, body mass index, total cholesterol, hypertension.
Some investigators based their analyses on alcohol intake at two points in time, and explicitly investigated the effect of changes of alcohol intake [13], especially the effect of quitting alcohol consumption [17, 18]. The latter two studies found an association of quitting or substantially reducing alcohol consumption with decreased risk of CHD but an increased risk of all-cause mortality in men, compared with non-drinkers.
In order to contribute to these discourses we investigated whether the beneficial effects of alcohol are more pronounced in participants with rather constant drinking habits in the MONICA-Augsburg cohort which was set up in 1984/85. We estimated relative risks based on two assessments of alcohol intake in 1984/85 and in 1987/88 and 10 years of follow-up to 1997. Generally, risk reduction of CHD and all-cause mortality associated with alcohol intake appeared to be more pronounced in this analysis, compared with a more traditional analysis based on alcohol consumption from a single assessment. The differences in the results from the two approaches are small but consistent, and could be observed in all subgroup analyses. We postulate that these findings are a consequence of the categorization of participants with more stable drinking habits, assessed from two examinations. The more accurately assessed alcohol intake reduced misclassification that is bound to occur when relying only on a single measurement of alcohol intake.
A special concern regarding changes in alcohol intake, namely the ‘sick quitters hypothesis’, was also addressed by our study. The interest in quitters was brought up by Shaper [28], who was especially concerned that there may be a substantial number of quitters among subjects who currently do not drink alcohol. This situation may lead to unduly high risks in current non-drinkers if there are many subjects who stopped alcohol intake due to health concerns. Indeed, some risk factor and comorbidity profiles according to alcohol intake showed less health problems in constant drinkers compared with quitters in our study (Table 4). Quitters, however, still had lower hazard rate ratios for CHD and overall mortality compared with non-drinkers. Further adjustment for self-perceived health, which had been shown to be a convincing predictor of CHD and all-cause mortality in this particular cohort [29], did not change the results. We therefore conclude that there might be sick quitters in our study cohort, but seemingly not to an extent that is likely to introduce a severe bias, at least not after 10 years of follow-up. The British Regional Heart Study [17] found increased all-cause mortality in quitters after 16.8 years of follow-up. The difference to our study might be due to differences in length of follow-up.
We note several strengths and limitations of our study. In contrast to many other studies we were able to assess changes in alcohol intake at two points in time and thus reduce misclassification of drinking habits. Alcohol consumption was self-reported at both interviews, but it was validated against a 7-day dietary record at baseline showing a high reliability of self-reports in this cohort [19, 23]. Our study is population based, in contrast to some of the larger studies on this topic which recruited their study cohort from the medical professions [11, 14]. The prevalence and amount of alcohol consumption is higher than in most other study cohorts, which also allowed us to analyse health effects of higher levels of alcohol intake.
On the other hand, the low all-cause mortality in men drinking high amounts of alcohol is remarkable. The previous analysis of this cohort after 8 years of follow-up [19], with alcohol intake assessed in 1984/85, yielded a U-shaped curve for all-cause mortality. We repeated this analysis with a mean follow-up of 13 years which yielded the same type of L-shaped curve for the alcohol-CHD relationship and U-shaped curve for the alcohol-all-cause mortality association. The risk reductions for drinkers, however, were slightly lower in magnitude, compared with those of the 8-year follow-up study. This result is consistent with other prospective studies observing reductions in risk estimates over longer periods of follow-up.
However, a selection due to deaths before 1987/88 and non-responding to follow-up in 1987/88 may have occurred in our 10-year follow-up study. Especially in the alcohol intake category ≥ 80 g per day a selection of participants towards ‘the fittest’ might have occurred, explaining the low risk ratios for all-cause mortality over a follow-up of 10 years among men in this group. Therefore, the hazard rate ratios of Tables 5–7 must be interpreted cautiously. This drawback seems to be the price for a better classification of exposure. Due to the small number of CHD events in women in our study, no results of alcohol consumption on CHD risk reduction in women could be reported.
In summary, in our study assessment of alcohol intake at two points in time does not seem to produce major changes in risk estimation for CHD and for all-cause mortality compared with assessing alcohol intake only once at baseline. Thus, our study contributes further to strengthen the evidence of a beneficial effect of low to moderate alcohol consumption on CHD and all-cause mortality.