
Abstract
Background
The incidence and mortality of cardiovascular disease among Orientals are very different than among Caucasians. This study addresses the prevalence and magnitude of classic cardiovascular disease risk factors associated with coronary heart disease (CHD) in an Oriental cohort of at-risk men (blood pressure, total cholesterol, Body Mass Index [BMI] and smoking), compared to Caucasian populations. We also address which blood pressure index (SBP, DBP, mean arterial pressure [MAP] and pulse pressure [PP]) is the best predictor of CHD.
Methods and Results
A cohort of 5092 male steelworkers (18–74 years old) recruited between 1974–1980 was followed up for an average of 13.5 years. The prevalence of risk factors was lower in Orientals than in Caucasians, except for smoking. The relative risks (RRs) of CHD associated with classic risk factors in this Oriental population were similar to Caucasians, except for blood pressure. The RRs of CHD associated with both SBP and DBP in this Oriental group were higher than in Caucasians; RR of CHD was ∼3 for each 40 mmHg rise of SBP versus ∼2 in Caucasians. SBP was the single best predictor for CHD, followed by MAP, and DBP. The population attributable risk (PAR%) for hypertension (140/90 mmHg) was 42.4.
Conclusion
Our results would indicate that the lower incidence of CHD in Orientals is at least partly due to the lower prevalence of hypertension, hypercholesterolemia, and obesity. The magnitude of the risk associated with these factors is similar to that in Caucasians, except perhaps for a greater risk associated with hypertension. The most predictive BP index for CHD is SBP. These results are based on indirect comparisons only and should be studied further in prospective multiethnic cohorts. Eur J Cardiovasc Prevention Rehab 11:113–120 © 2004 The European Society of Cardiology.
Introduction
Ischaemic heart disease predominates in Caucasians; the age-standardised, gender-specific mortality rates per 100, 000 population for Australian Caucasian males is 104.6, versus 26.3–45.5 for Japanese and Chinese males [1]. By contrast, cerebrovascular disease predominates in Orientals; the age-standardised, gender-specific mortality rates per 100,000 population for Japanese and Chinese males is 44.0–102.6 versus 19.3 for Australian males [1]. The reasons for these differences are still unclear. They may reflect an underlying difference in genetic make-up, prevalence or magnitude of risk factors, or new risk factors. In Caucasians, the incidence of coronary heart disease is well associated with classic risk factors such as blood pressure, serum total cholesterol, smoking status, and obesity. In this paper, we specifically address the prevalence and magnitude of these classic risk factors in an Oriental cohort of at-risk men, and specifically compare these results to those in Caucasians. We also compare four blood pressure indices: systolic blood pressure (SBP), diastolic blood pressure (DBP), mean arterial pressure (MAP), and pulse pressure (PP) as predictors of coronary heart disease (CHD).
Methods
Population
Subjects were selected from among the workforce of the Beijing Iron and Steel Complex. Seven representative factories (of the 21 in the complex) located within 15 kilometre from the city centre, were included for study. The total number of male workers in these 7 factories was 7933, of which up to 70% were men aged 35 years or more (∼5553 people, the uncertainty is due to the inability to recheck all records in Human Resources, some as old as 30 years ago). In 3 separate waves of recruitment (1974, 1979 and 1980), invitations were sent to these men to participate in a health check. In total, 5298 male workers attended this health check, of which 5092 were free of vascular disease. This figure includes 388 younger workers (aged 18–34) who did not receive an invitation, but heard about the health check and decided to participate. We therefore estimate a participation rate for those over 35 years old in the range of 88–95%.
The health practitioners conducted follow-up until 1993, by way of face to face or telephone interviews. If participants moved, their relatives or colleagues were contacted for information, and hospital records were checked. Loss to follow-up was only 144 subjects. If the participants reported coronary heart disease, their hospital record was checked by doctors from the cardiovascular institute of Fu Wai hospital (a tertiary care referral centre) or the company hospital.
Measurements
At baseline examination, blood pressure, total serum cholesterol, height, and weight were measured. Blood pressure was measured in the right arm using a standard mercury sphygmomanometer on a single occasion, after participants had been seated at least 5 min. PP was calculated as SBP minus DBP, and MAP as 1/3(SBP) + 2/3(DBP). Total serum cholesterol was also determined on the same single occasion, from a fasting venous blood sample, using the enzyme reagent method [2]. BMI was calculated as weight (kg)/height (m)2. Smoking status was self-reported and defined as non smoker, light (less than 10 cigarettes per day), medium (11 to 20 per day), and heavy (greater than 20 per day); number of years of smoking was also recorded.
Outcomes
Self-reported outcomes were confirmed by reviewing hospital records. Incidence of fatal and non-fatal CHD included angina pectoris, and myocardial infarction (MI) (ICD-9 Codes: 410–414.9). The definition of angina pectoris was confirmed by review of the hospital record and defined as clinical symptoms (typical chest pain, relief with anti-anginals), and ECG changes, as judged by a clinician. An MI was defined according to WHO standards, i.e. 2 of 3 of: ECG changes, elevated cardiac enzyme levels (creatine kinase), and typical chest pain. Sudden death was defined as cases who had a fatal event within 1 h of a documented MI, not explained by other reasons. Death certificates were also obtained for all fatalities to confirm cause of death.
Statistical analyses
TC and BMI were categorised into 5 groups: TC (mmol/L): < 4.5, 4.5–4.9, 5.0–5.4, 5.5–5.9, ≥ 6.0; BMI: < 20, 20–22.4, 22.5–24.9, 25–29.9, ≥ 30. Smoking status was defined dichotomously as smokers and non-smokers or continuously as pack-years.
Multivariate Cox models were undertaken with CHD incidence as the outcome variable, and age, TC, BMI, and smoking as the independent variables. For the various BP indices, four Cox proportional Hazard models were used, all of which were adjusted for age (in years), BMI (kg/m2), TC (mg/dl) and smoking history (yes or no):
a) Each BP index individually; Hazard ratios (HRs) for a 10 mmHg increase in each of the indices was calculated.
b) Combinations of two of the indices; HRs for an increase of 10 mmHg in each of the indices was again calculated. No more than two of the indices could be included in any one model because of problems of multi-collinearity.
c) Each BP index considered as a categorical variable (4 levels). The cutoffs for PP and MAP were chosen according to quartile levels.
d) The participants were classified categorically using two methods: in the first, normotension was defined as SBP < 140 mmHg and DBP < 90 mmHg, isolated systolic hypertension (ISH) as SBP ≥ 140 mmHg and DBP < 90 mmHg, isolated diastolic hypertension (IDH) as SBP < 140 mmHg and DBP ≥ 90 mmHg, and combined hypertension (SDH) as SBP ≥ 140 mmHg and DBP ≥ 90 mmHg. In the second method, normotension was defined as SBP ≥ 160 mmHg and DBP < 90 mmHg, isolated systolic hypertension as SBP < 160 mmHg and DBP ≥ 90 mmHg, isolated diastolic hypertension as SBP < 160 mmHg and DBP ≥ 90 mmHg, and combined hypertension as SBP ≥ 160 mmHg and DBP ≥ 90 mmHg. The two methods were used in order to allow comparisons with other studies.
The Akaike Information Criteria (AIC) [3] and standardised co-efficients were calculated in order to compare different (non nested) models and to determine which BP measure was the best predictor for CHD. A lower AIC and higher standardised co-efficient indicate a better model. Data were censored at the last point of follow-up (i.e. 1993). This analysis was performed with the 4400 individuals that had serum cholesterol measurements available and no missing data for other variables measurements, and was repeated excluding the 388 participants under 35 years of age (with no significant change). Population-attributable risk (PAR) was calculated as [f(RR-1)]/[1+f(RR-1)], where f is the frequency of the risk factor in the population at baseline. Stata 7.0 was used for all analyses.
Cardiovascular classic risk factors (mean [SD] or prevalence) for study participants in Beijing cohort at baseline
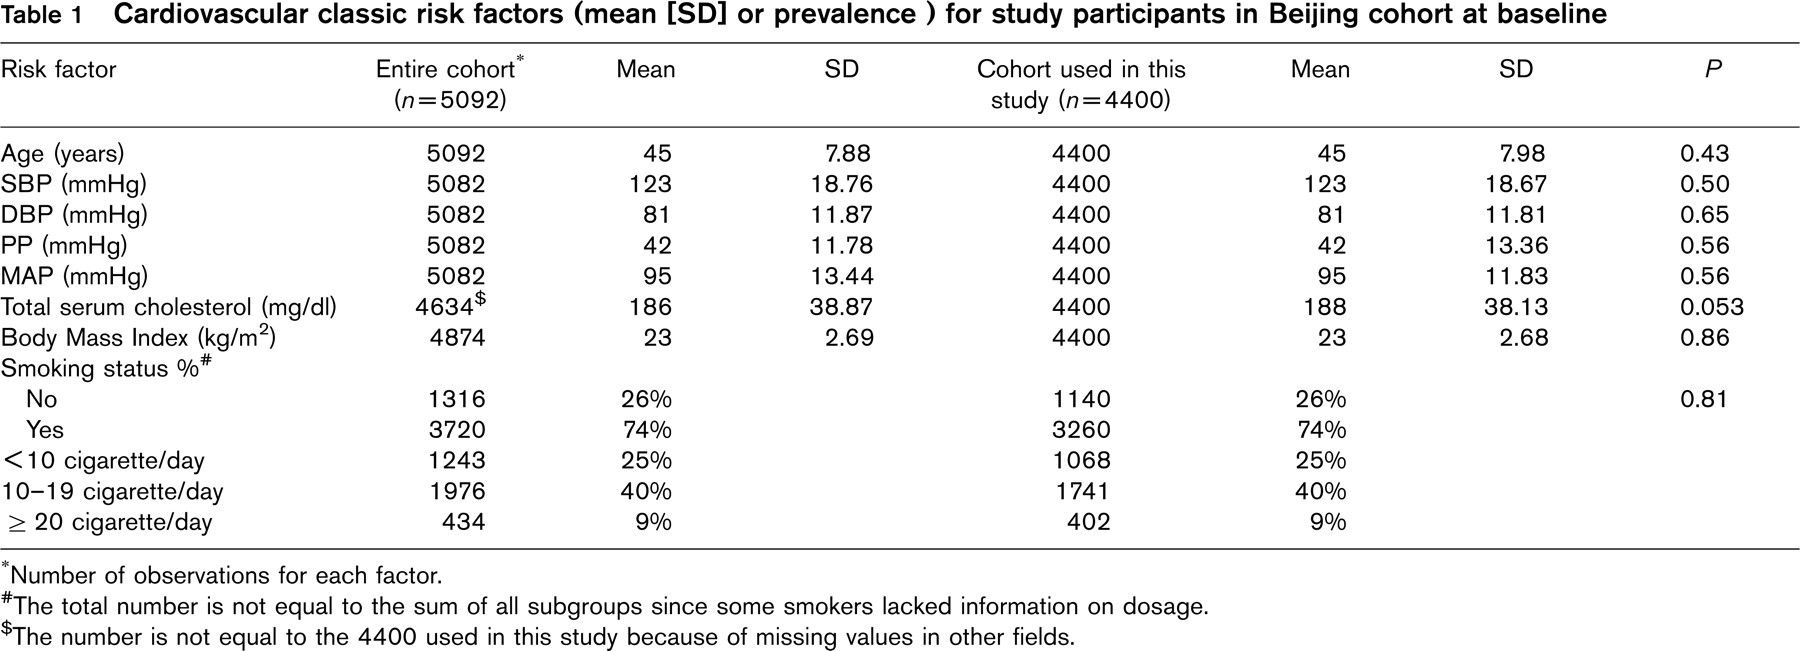
∗Number of observations for each factor.
#The total number is not equal to the sum of all subgroups since some smokers lacked information on dosage.
†The number is not equal to the 4400 used in this study because of missing values in other fields.
Results
Baseline characteristics of the study population
The characteristics of the original cohort, as well as the subset used in this study, are given in Table 1. The average age of the study population was 45 years (18–74 years old), with an average blood pressure of 123/81. Average total serum cholesterol was 186 mg/dl (4.8 mmol), with only 6.3% having a reading over 250 mg/dl (6.5 mmol). Average BMI was 23. There was a high proportion of smokers (74%), with most being moderate users. As seen in Table 1, the subset with full information was representative of the original cohort. At the conclusion of the study in 1993, representing a mean follow-up time of 13.5 years, there was a total of 83 new events of CHD (21 angina, and 62 MI/sudden death), including 31 fatal cases.
Multivariate analysis of classical risk factors
Total cholesterol
There was a graded, continuous increase in risk of CHD across the 5 categories of total cholesterol (TC), with the extreme 3 groups reaching statistical significance compared to the lowest TC group (Table 2). The multivariate relative risk of CHD in the highest TC group was 3.4 (95% CI, 1.6 to 6.7). When considered as a continuous variable, there was a RR of CHD of ∼1.8 (95% CI, 1.5 to 2.0) for every 60 mg/dl (1.6 mmol) increase in total cholesterol (Table 3). The PAR for hypercholesterolemia (cutoff 200 mg/dl) was 37.8%.
Body Mass Index (BMI)
In multivariate analysis, there was an increased risk of CHD only in the most extreme BMI category (≥ 30), with a RR of 4.1 (95% CI, 1.2 to 13.7) (Table 2), and this was based on only a small number of events and person years. When analysed as a continuous variable, there was a RR of CHD of 1.7 (95% CI, 1.4 to 2.1) for every 5 point increase in BMI. Using a cutoff of 25, the PAR for overweight was 17.4% for CHD.
Smoking
Taken as a dichotomous outcome, the multivariate relative risk of CHD for smokers was 2.1 (95% CI, 1.2–3.7) (Table 2). Taken as a continuous measure, this translates into a RR of CHD of ∼2 (95% CI, 1.7 to 2.1) for every increase of one pack year, compared to non-smokers (Table 3). The PAR for smoking was 34.9%.
Blood pressure
As shown in Table 2, all four blood pressure indices, SBP, DBP, PP, and MAP, considered separately, were each related to CHD. For each, there was a graded increase in risk, independent of other major risk factors, with the extreme groups, i.e., highest versus lowest, being significantly different, indicating a 5.7, 3.7, 4.5, and 4.4-fold increase in CHD respectively.
To identify which BP index was most predictive, a number of analyses were undertaken:
a. As continuous variables SBP, DBP, PP, and MAP were individually associated with CHD, with DBP and MAP having the greatest effect per 10 mmHg change (Table 4). However a 10 mmHg change represents a different proportion of each BP index range, and so standardised coefficients and Akaike information criteria (AIC) were calculated (Table 4); SBP was the single best predictor for CHD. The regression coefficient for systolic pressure indicates a relative risk of CHD of ∼3 (95% CI, 2.5 to 3.7) for every 40 mmHg rise in systolic blood pressure (Table 3). The magnitude of this RR is slightly higher (RR: 3.3, coefficient: 0.0299) when anginal cases are excluded in the analysis.
b. In general, inclusion of two BP indices in the same model reduced the effect of each of the individual BP measures for CHD. However, based on the AIC, none of the models with two BP indices were better than the best individual model (Table 4).
c. In order to allow comparisons with other studies, hypertension was also defined clinically as isolated systolic, diastolic, and combined hypertension using two schemes (Table 5). Although the greatest risk is for combined hypertension, severe isolated systolic hypertension is also a risk factor, with a RR of 3.6 (95% CI, 0.5–26.5). Using a cutoff of 140/90 mmHg, the PAR for hypertension was 42.4%; with a cutoff of 160/95 mmHg, PAR was 34.5%.
Relative risk† of incidence by risk factors level
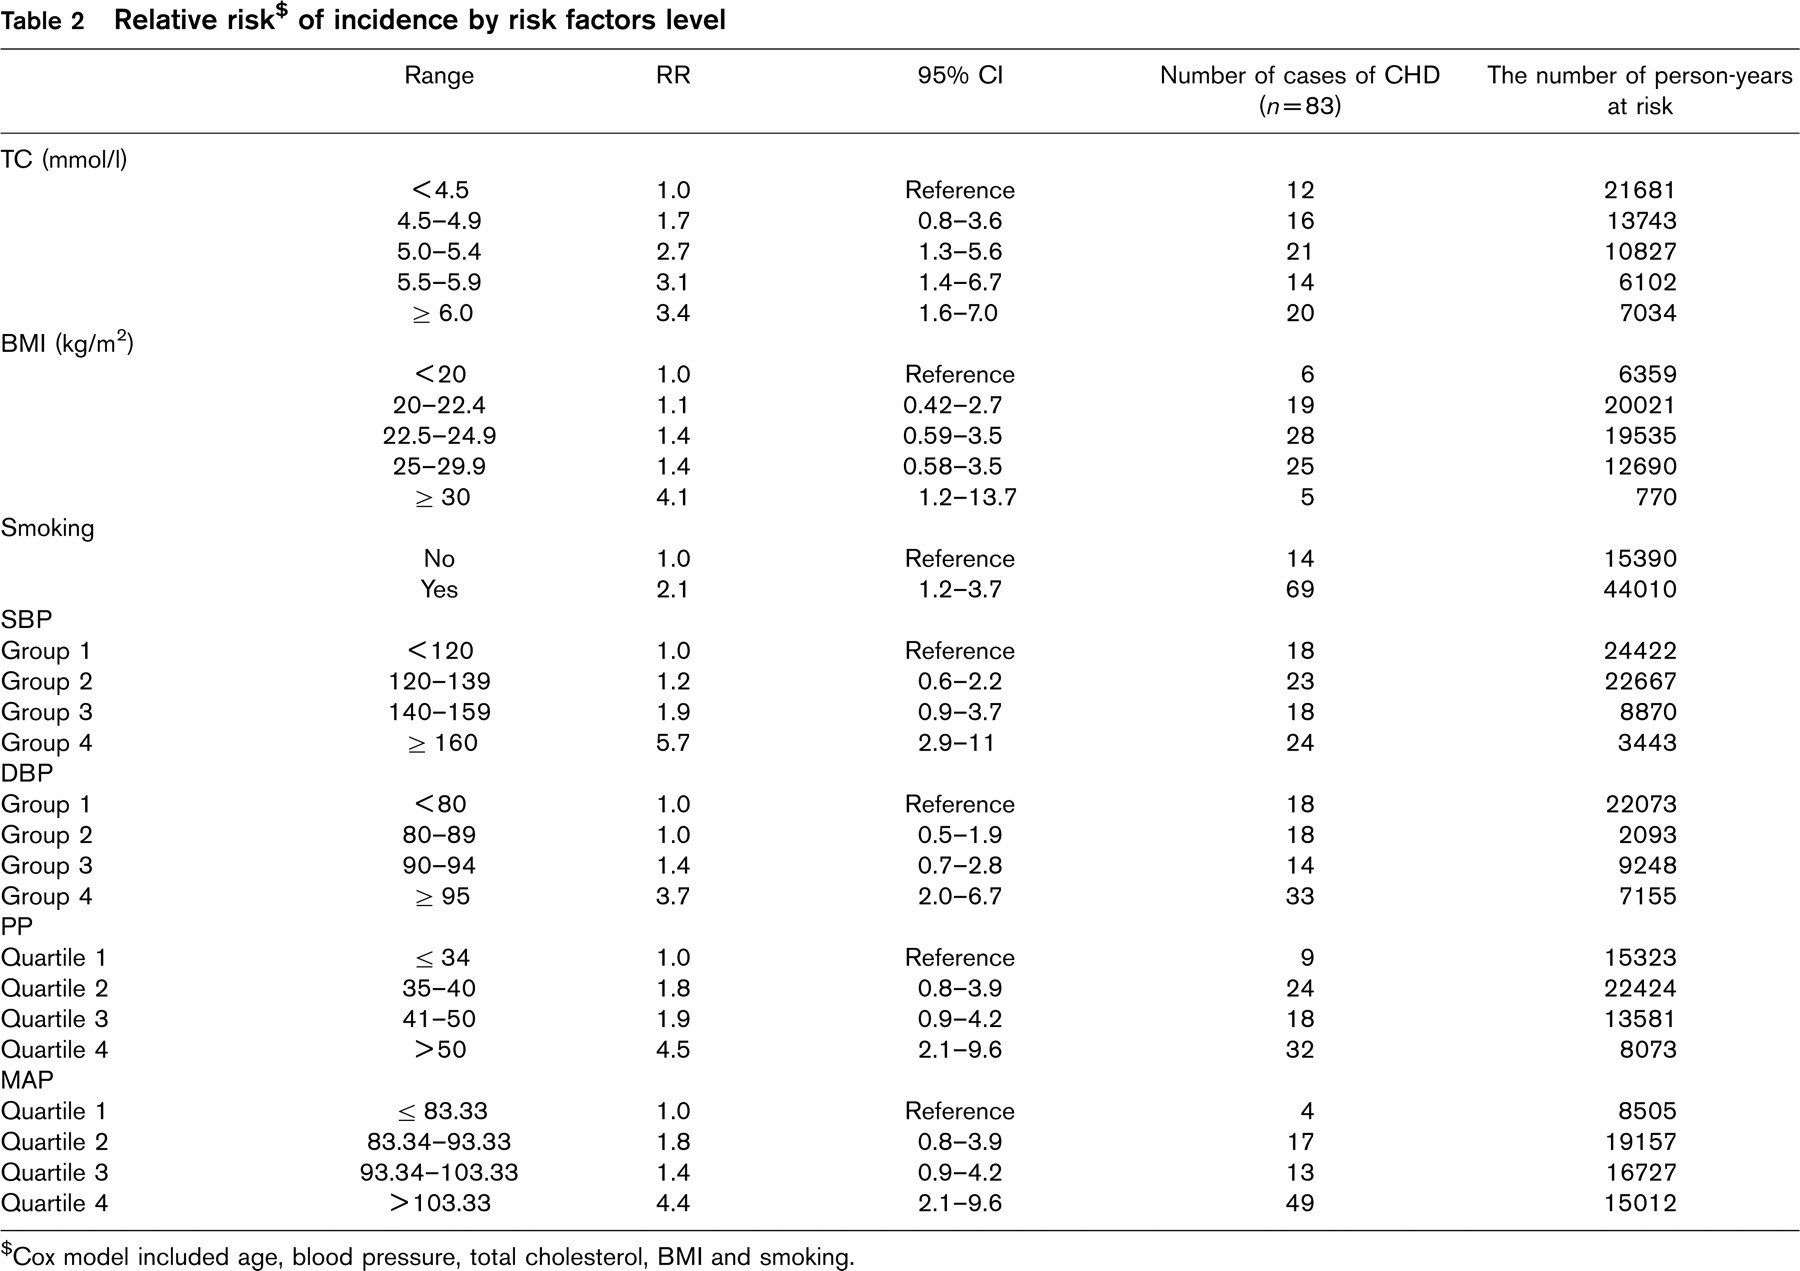
$Cox model included age, blood pressure, total cholesterol, BMI and smoking.
Logistic regression coefficient and their errors and odds ratios for the given change (Δ) in the Variables, from selected studies for males and CHD events only
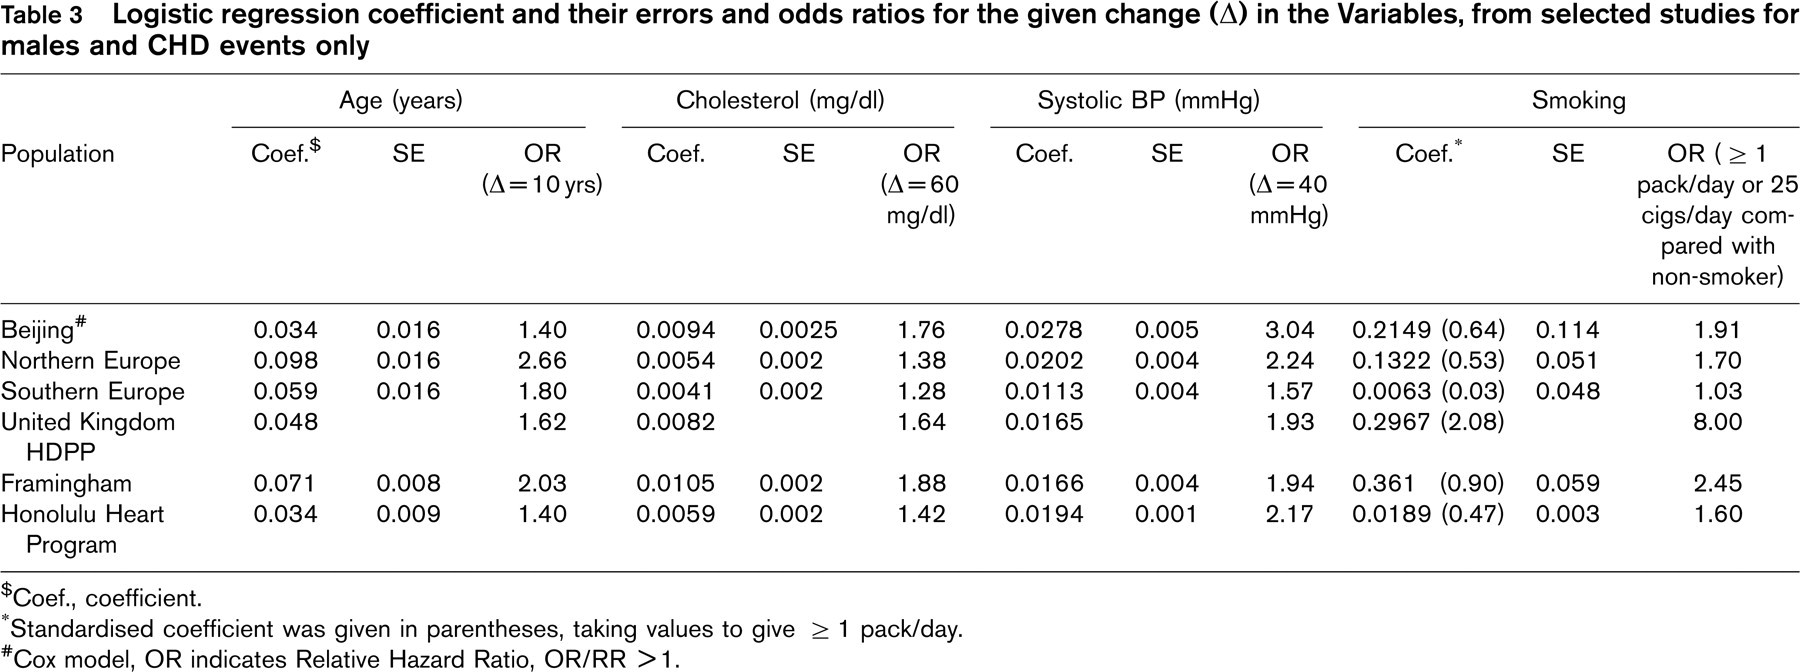
†Coef., coefficient.
∗Standardised coefficient was given in parentheses, taking values to give ≥ 1 pack/day.
#Cox model, OR indicates Relative Hazard Ratio, OR/RR > 1.
Hazard Ratios and 95% Confidence Intervals per 10 mmHg increase in BP indices, from Cox Proportional Hazard Models (M1-M10) for Coronary Heart Disease§
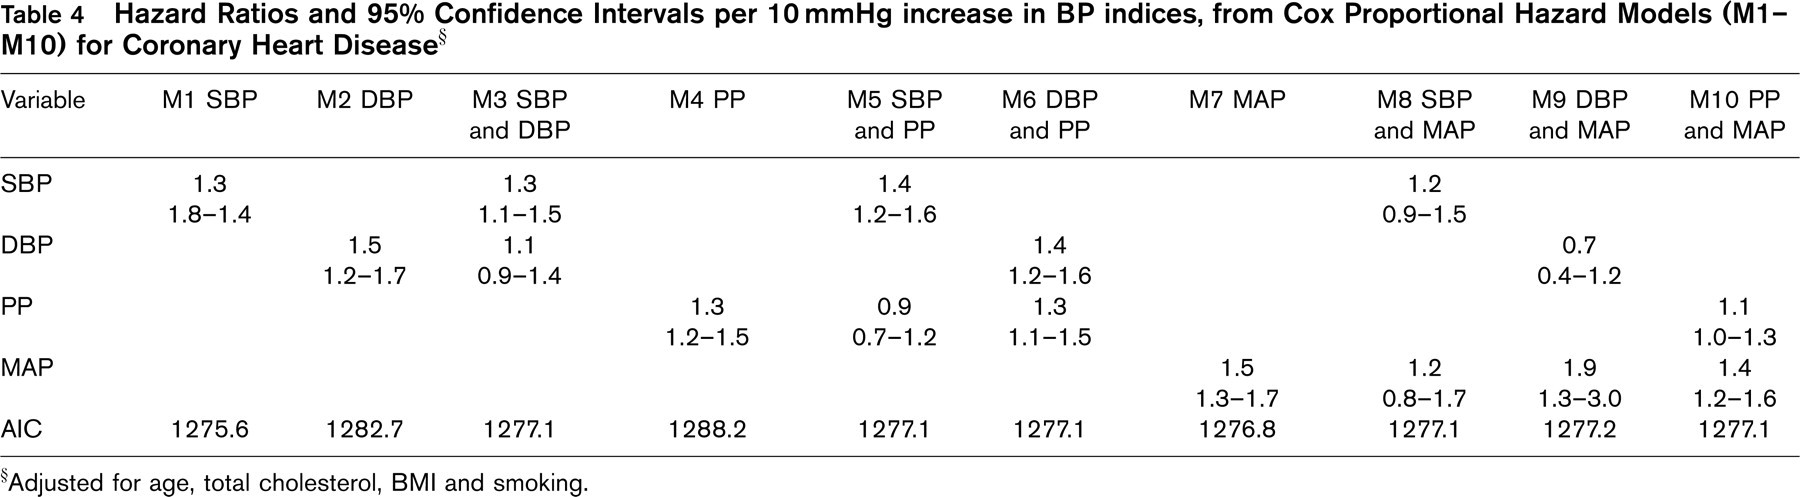
§Adjusted for age, total cholesterol, BMI and smoking.
Hazard Ratios and 95% Confidence Intervals for hypertension categories (definition 1¥ and definition 2#) for Coronary Heart Disease§
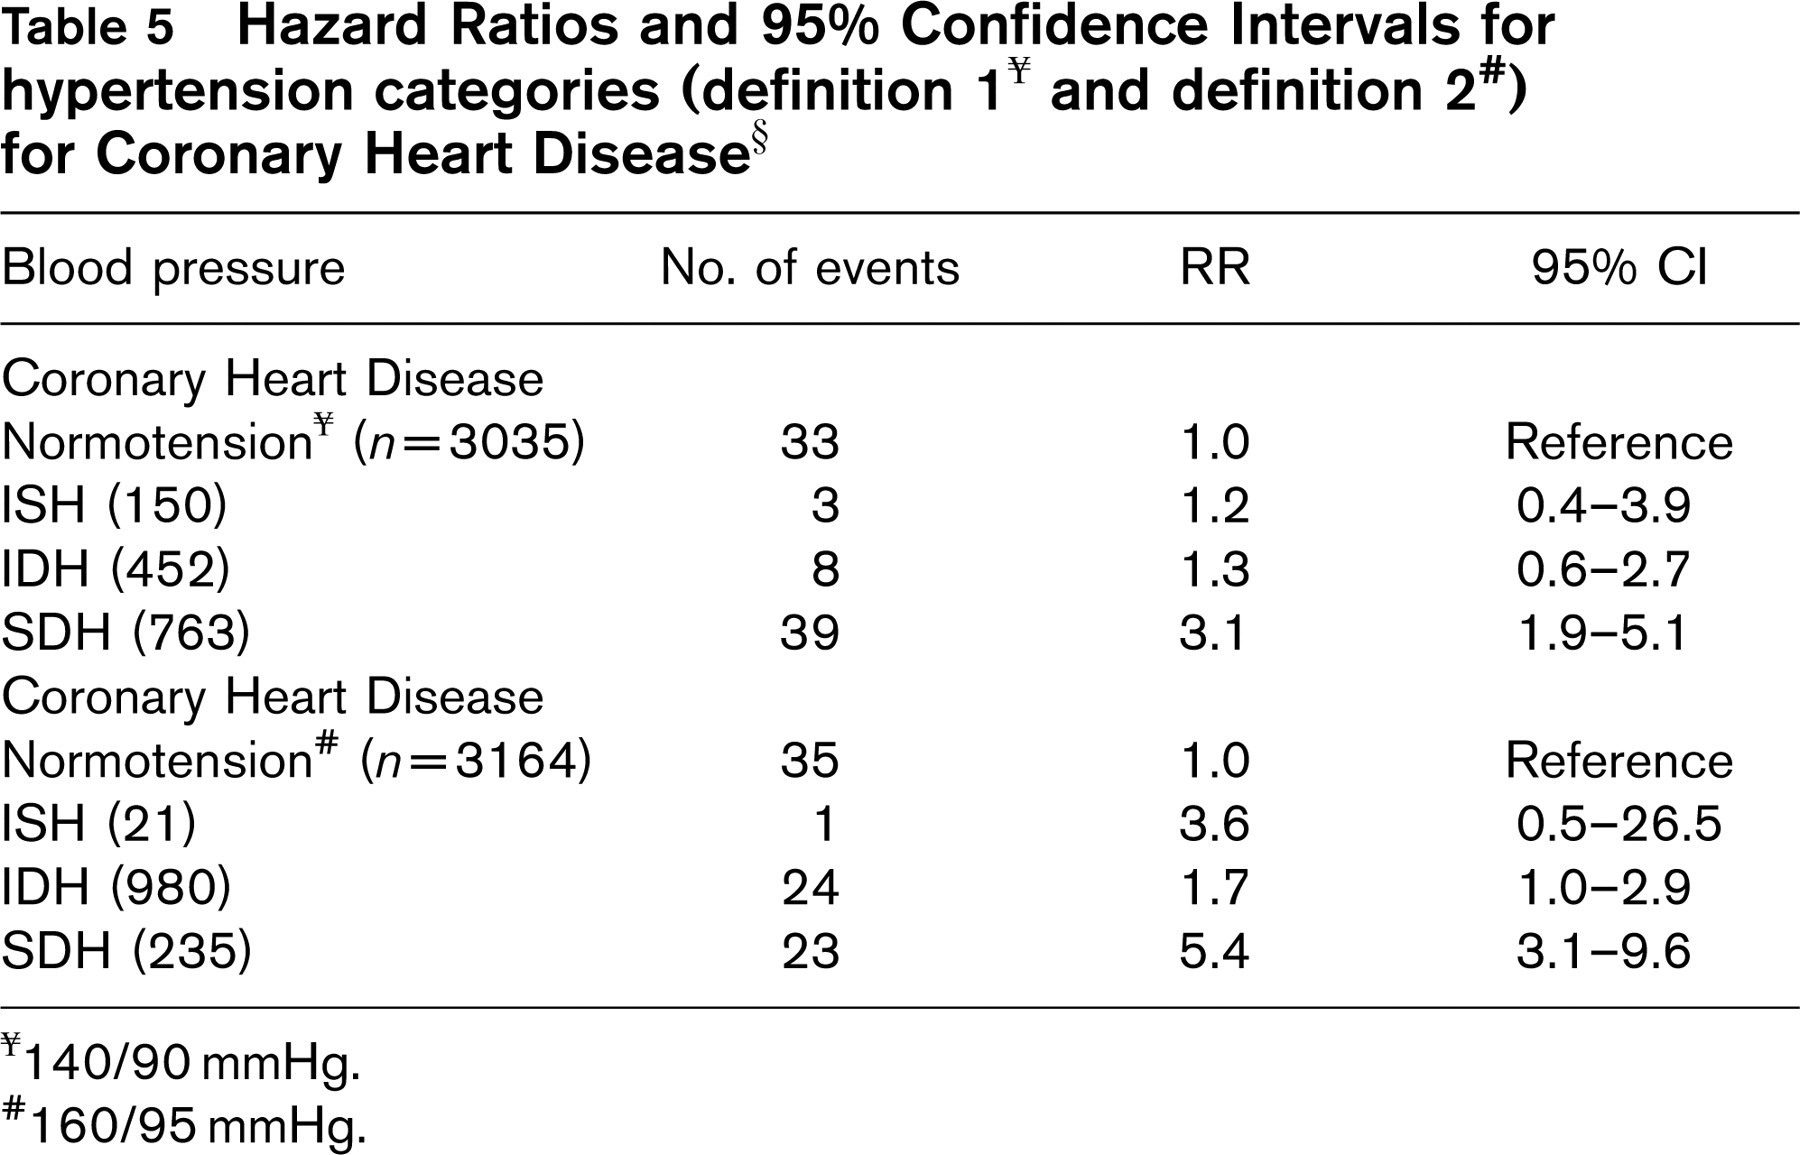
¥140/90 mmHg.
#160/95 mmHg.
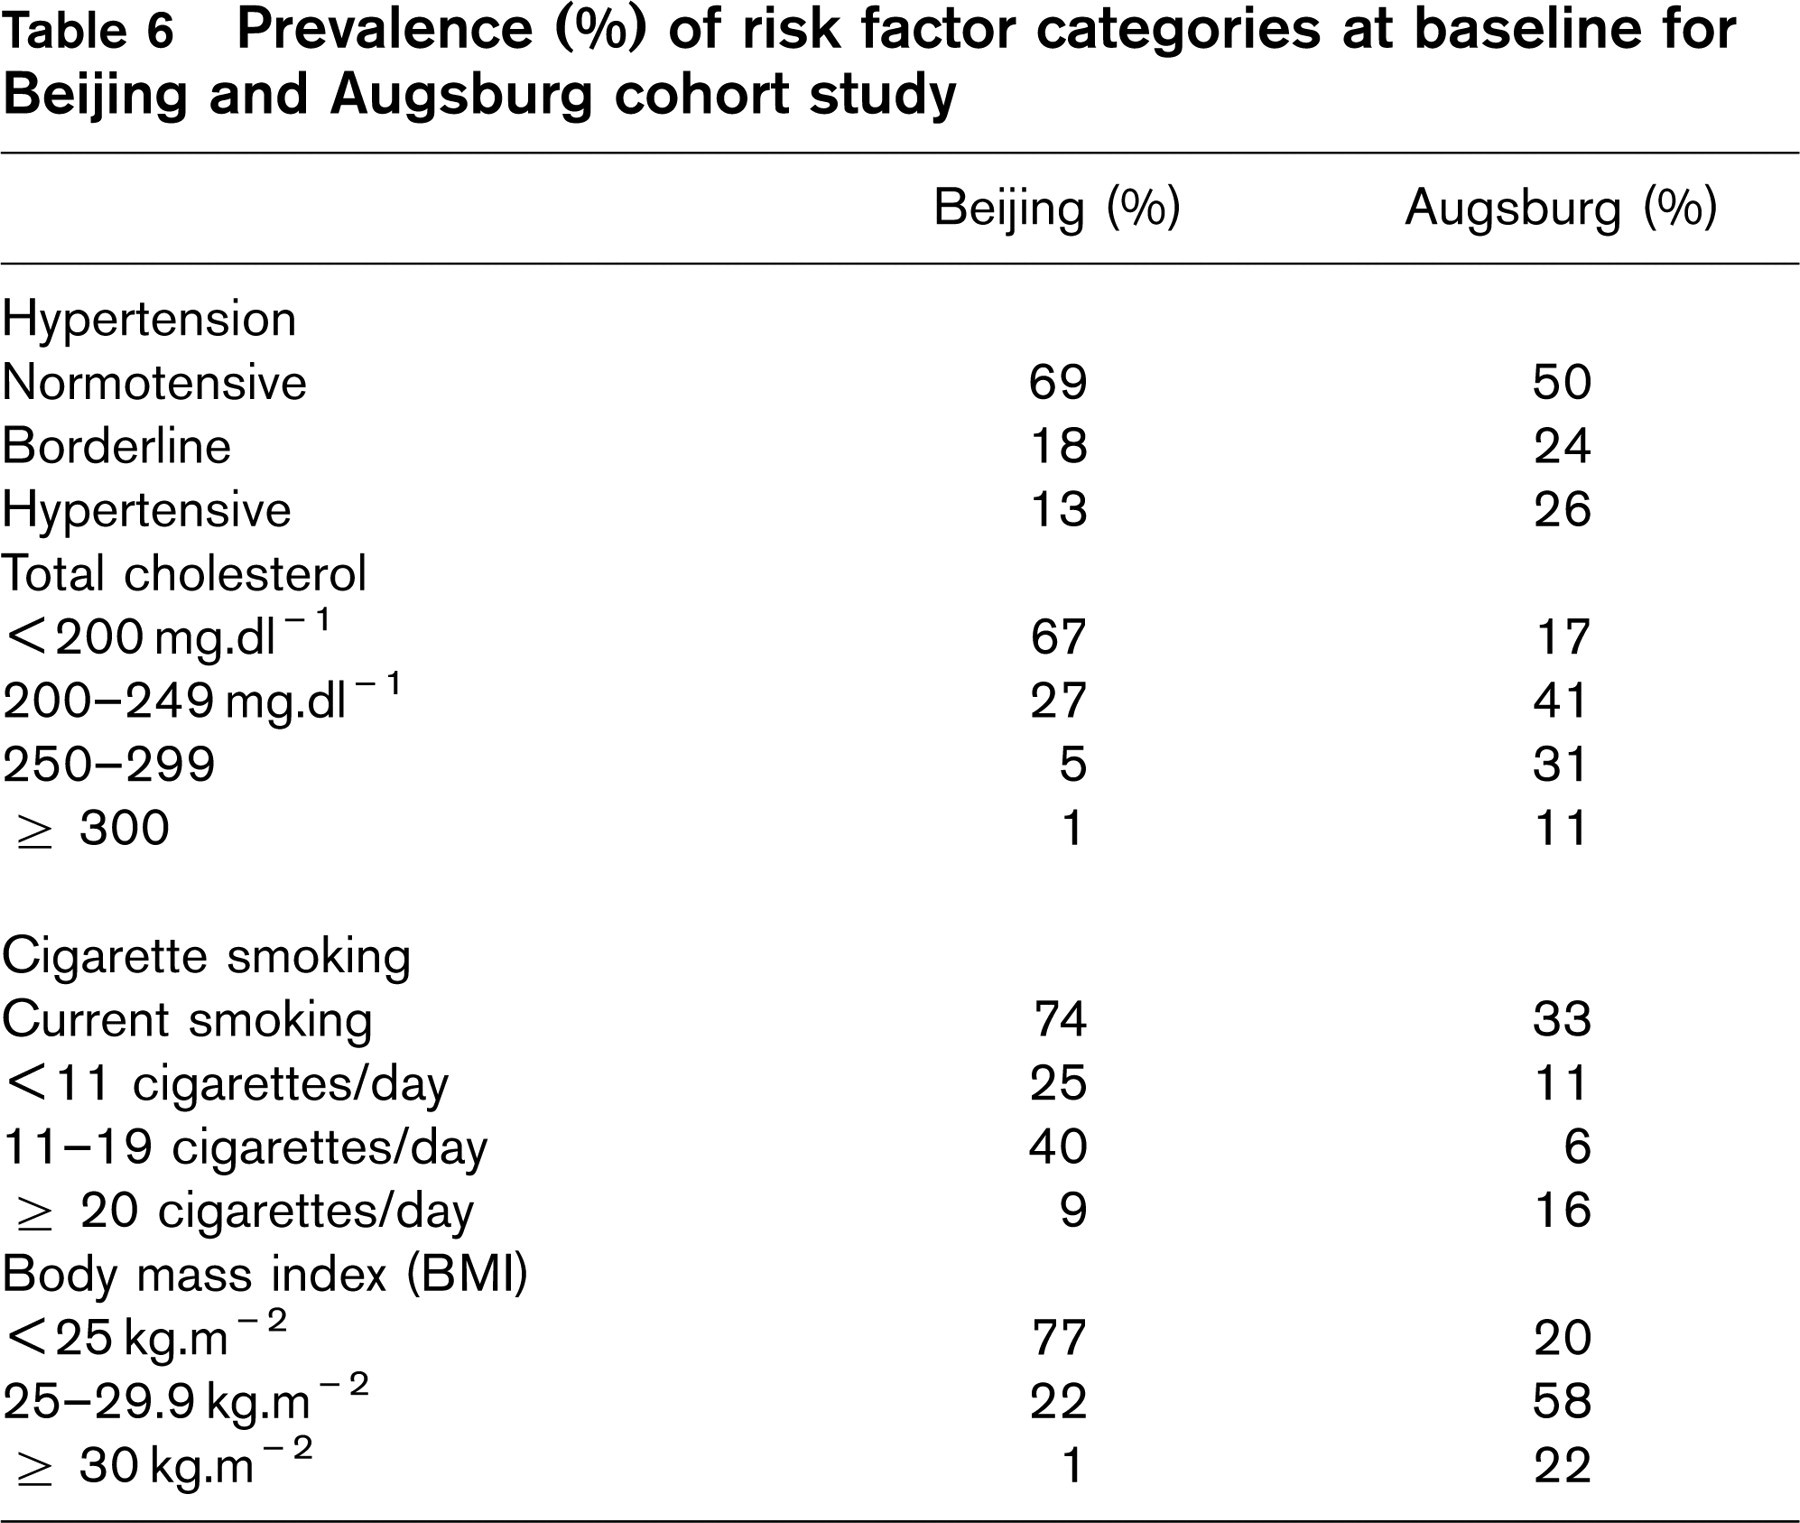
Prevalence (%) of risk factor categories at baseline for Beijing and Augsburg cohort study
Discussion
It has been well established that the incidence of CHD in Orientals is substantially lower than in Caucasians [1]. This was noted in the 1940's and 1950's, [4] and despite recent increases still remains true; average crude death rates from CHD are estimated at 20 per 100,000, which is approximately one tenth of the rates for North America [5]. Average age-standardised CHD mortality rates for Beijing over the period from 1976–1986 are in the range of 80–120 deaths per 100,000 per year, roughly consistent with the numbers of events we noted in our cohort [5]. Our specific focus in this paper was to contrast the CHD incidence rates in our Oriental cohort to known Caucasian rates and to compare the prevalence and magnitude of risk factors. Is the lower rate seen in Orientals a result of lower prevalence of risk factors? Or is the magnitude of the risk associated with each factor lower in Orientals than Caucasians?
Prevalence of risk factors
High blood pressure, total cholesterol, smoking, and obesity have been established as important cardiovascular risk factors [6–13].
Table 6 contrasts the prevalence of risk factors in our cohort against that of a similar Caucasian cohort, the MONICA cohort in Augsburg; this cohort uses a similar standard definition of CHD, and has comparable demographics (middle aged, working men). In most cases, the prevalence is much lower, except that smoking. For example, hypertension, defined as BP > 160/95, was seen in 13% of our cohort, comparable to the 12% reported for Beijing men in the 1991 PRC national hypertension survey [14] but half that in MONICA [15]. In contrast, smoking was much more prevalent in our cohort; 74% were smokers, consistent with other estimates in Chinese men. Results of the PRC-USA cooperative study showed that the smoking rate for men was 71% in urban Beijing, and 78% in rural Beijing [16]. This compares to 36% of men in the USA in 1984, [17] and 33% in the MONICA cohort. Hence, with the exception of smoking, most risk factors appear less prevalent among Oriental men than Caucasian men.
Magnitude of risk factors
Total cholesterol
The magnitude of the risk of CHD events associated with a 60 mg/dl rise (1.55 mmol/l) in TC in our cohort was similar to that found in a number of caucasian studies, i.e., a RR of ∼1.5–2 (Table 3). In Caucasians, there is an interaction between hypercholesterolemia and smoking; however no interaction could be detected in our Oriental population (data not shown).
Body Mass Index (BMI)
The magnitude of the relative risk of CHD events for each point rise in BMI was 1.12 (multiple regression coefficient: 0.111) in our cohort. Another large Chinese cohort study obtained similar findings: RR was 1.11 for CHD with each point rise in BMI [18]. This is also similar to values obtained for other Caucasian cohorts, e.g., a RR of 1.05 in the Nijmegen Cohort Study [19].
Smoking
The magnitude of the RR for CHD events for each pack of cigarettes smoked per day was ∼2, a figure comparable to that obtained in Caucasian cohorts (Table 3).
Blood pressure
We compared the results of our study with similar studies conducted in Caucasian populations. The RRs in our study were higher compared to the Framingham Heart Study [20] (SBP 1.08–1.17, DBP 1.11–1.34, PP 1.02–1.24 with three age groups for all CHD events), the Physicians’ Health Study (SBP 1.21–1.31, DBP 1.16–1.46, MAP 1.28–1.48, PP 1.23–1.24 with two age groups with cardiovascular disease events), [21] and the Chicago Heart Association Study (SBP 1.23–1.29, DBP 1.17–1.29 MAP 1.23–1.29, PP 1.09–1.20 with three age groups for coronary heart disease mortality; SBP 1.22–1.26 DBP 1.19–1.29, MAP 1.22–1.30, 1.14–1.17 with three age groups for cardiovascular disease mortality) [22]. Chambless et al. [23] compiled the magnitude of the risk factors, derived from regression coefficients, across a number of studies; some of these are listed in Table 3. On average the relative risk of CHD events of ∼3 associated with a 40 mmHg rise in our cohort is somewhat higher than the average RR of ∼2 seen in other Caucasian studies. These results suggest that higher blood pressure has a more deleterious effect on CHD in Oriental subjects than Caucasians. This is consistent with a previous meta-analysis based on three pooled placebo-controlled trials in elderly patients (at least 60 years old) with hypertension [24]. Among these parallel studies, the magnitude of the risk for PP ranged from 0.92 to 1.64. In addition, results of several Oriental cohort studies show that hypertension is the most important risk factor for coronary heart disease and cardiovascular disease in this population [25–30].
Best blood pressure predictor of CHD risk
On pathophysiological grounds, one might expect mean arterial pressure (MAP) and pulse pressure (PP) to be better predictors of cardiovascular disease (CVD) than SBP or DBP. This is because the latter are essentially static measurements, whereas MAP and PP are dynamic [31, 32]. Major determinants of MAP are ventricular ejection and peripheral vascular resistance. Pulse pressure mainly reflects large artery stiffness [33]. Arterial stiffening, caused primarily by ageing and hypertension, increases the amplitude of the arterial pulse wave and pulse wave velocity. This results in an associated increase in systolic and pulse pressure and decreased diastolic pressure. Diastolic blood pressure falls with increased large artery stiffness and rises with increased peripheral arterial resistance [34].
However, methodologically, it is difficulty to compare the predictive power of these four BP indices. Although previous studies have compared the magnitude of the effect per 10 mmHg increment in each index, this is not valid since 10 mmHg represents a larger percentage of the DBP range than the SBP, and an even larger percentage of the MAP and PP ranges. For this reason we calculated the standardised coefficient and Akaike Information Criterion (AIC) for each multivariate model. A lower AIC and higher standardised coefficient indicate a better model.
Our results indicate that SBP was the best predictor of CHD events. This finding is consistent with some previous results using CVD mortality, e.g., Finland Health Study, [35] and the Chicago Heart Association Detection Project [22] but is at variance with other studies [20, 24, 34, 36]. For example, in the Framingham study, PP was individually the most predictive factor for CHD risk [20, 34]. One possible reason for this disagreement with the Framingham data could be the age difference between study populations. The subjects in our study were all male, and most (97%) were below 60 years of age. Most studies showing that PP is a useful and independent predictor for the risk of CVD were in older people since it is in this group that arterial stiffness is most marked, leading to the largest PPs [20, 24, 36, 37]. For example, among 1924 men and women aged 50–79 years and followed for 20 years in the Framingham study, PP was not only a useful predictor of CHD, but also a stronger predictor than SBP or DBP [20]. Similarly, the Physicians’ Health Study suggested that SBP, DBP, and MAP strongly predict CVD among men younger than 60 years, and that SBP, MAP, and PP predict CVD among men over 60 years [21]. This age difference cannot be the only explanation however since another Framingham study reported that SBP was a stronger predictor of 30-year CVD incidence than PP, MAP and DBP in men and women age 65–94 years [38].
The discussion so far has centred on comparisons with other studies in Caucasians. To our knowledge, only one other study has investigated these indices in an Oriental population. The SYST-CHINA trial included 2394 patients who were at least 60 years old with isolated systolic hypertension (defined as SBP 160–219 mmHg and DBP < 95 mmHg). The results showed that PP was an independent predictor of CHD and stroke [24]. This is somewhat consistent with our results in that PP should closely follow SBP in this population since DBP was held below 95 mmHg.
In our study, models with two variables did not improve the fit; this is at odds with some previous results. For example, MRFIT concluded that CVD risk assessment was improved by considering both SBP and DBP [39].
Clinical implications
We also categorised blood pressure into four groups: normotension, isolated systolic hypertension (ISH), isolated diastolic hypertension (IDH), and combined systolic and diastolic hypertension (SDH), with two different definitions of hypertension. Using a cut-off value for hypertension of 140/90 mmHg for systolic and diastolic BP, only SDH was statistically significantly associated with coronary heart disease (see Table 5). However using more stringent criteria (>160 mmHg systolic) indicated that isolated systolic hypertension may also be a risk factor in Orientals.
Comparing the magnitude of these relative risks to the other studies mentioned previously yields some interesting findings. The Finland Health Study [35] found that ISH and SDH (defined using a cut-off value of 140/90 mmHg) were significantly associated with increased cardiovascular mortality risk with the following RRs: ISH 1.78, IDH 1.31, SDH 2.43. These values are all lower than in our study, and again confirm that BP control may be more critical in Orientals. However, this needs to be investigated further.
Caveats
There are several limitations in this study. Firstly, baseline blood pressure was based on a single measurement only; this would cause non-differential bias, decreasing the magnitude of the RRs. Secondly, smoking was self-reported and dose was ascertained only at baseline; again this would tend to bias results towards the null. Third, outcomes were based on self-report with follow-up review of hospital record. This again would tend to miss some cases of CHD and cause a bias towards the null. Fourthly, this population was an occupational cohort, and may not represent the general population, especially with regard to comparisons with other studies, eg. MONICA. However, the prevalence of these classical risk factors were similar to other studies in China. The strengths of this study are the relatively large size of the cohort, the length of follow-up, the small loss during that time, and the documentation of events using hospital records and death certificates.
Conclusions
Our results would indicate that the lower incidence of CHD in Orientals is at least partly due to the lower prevalence of hypertension, hypercholesterolaemia, and obesity. The prevalence of smoking however is much higher in Orientals. The magnitude of the risk associated with these factors is similar to that in Caucasians, except perhaps for a greater risk associated with hypertension. As in Orientals, the most predictive BP index for CHD is SBP, and isolated systolic hypertension is also potentially a risk factor. The PAR/indicates that 42.4% of CHD in Orientals could be avoided if hypertension were controlled (i.e. < 140/90 mmHg).