
Abstract
Background
Overweight and obesity are already on the rise in early childhood years. The relationships between genetic factors, malnutrition and physical inactivity are the underlying mechanisms. In this study, we examine the association between body indices, motor abilities and active (sport) and passive (television/computer) leisure time activities in a cohort of first-grade pupils.
Methods
The study group consisted of 344 children (51.5% male, 48.5% female). They were 6.8 ± 0.4 years old, height was 123.9 ± 4.9 cm, weight 24.8 ± 5.0 kg, body mass index (BMI) 16.1 ± 2.3 kg/m2. After determination of the anthropometric data, a fitness test was performed in order to determine motor abilities. Parents were questioned about their children's leisure time activities, using a standardized questionnaire. Differences between BMI groups were evaluated using multivariate ANCOVA, adjusted for gender and age.
Results
Based on German BMI references, overweight and obesity were found in 12% of the children. They had poorer results with respect to endurance (P<0.001), leg strength (P=0.002), co-ordination and balance (P = 0.045) and spent more leisure time in watching television and at the computer (each P<0.001). No differences were found between their active leisure habits such as club sports.
Discussion
Our examinations with first-grade children show no differences in active leisure habits between obese children and their counterparts, although the former had poorer results in motor abilities, but they spend more time on sedentary leisure habits like audiovisual media. A possible explanation is their fewer regular daily activities.
Introduction
The prevalence of obesity in children and adolescents is increasing in industrial countries [1–3]. Besides a genetic predisposition and a poor diet, physical inactivity is discussed as another reason for the development of obesity and overweight [3]. Several cross-sectional studies have shown a positive correlation between TV watching and obesity in children [4–6], whereas others have failed to find a relationship [7, 8]. Concerning inactivity, no exact definition exists for childhood, and data on children's activity and its correlation with obesity are sparse and also inconsistent, depending on the measurement tool used [9]. The most popular direct instruments for assessing physical activity are questionnaires, observation and monitors such as heart rate monitoring. Some authors found differences between the fitness of obese and non-obese children; others did not [10–12]. It has been suggested that the results of motor ability tests could be regarded as an indirect marker of activity and inactivity [13, 14].
Therefore, we examined the differences in leisure activities and motor abilities between obese, overweight, normal-weight and underweight children in first-grade classes.
Methods
The examinations were carried out from November 2002 to March 2003 in eight randomly selected schools that were taking part in the project called ‘Health promotion and health education in primary school', organized by Ärztekammer Nordrhein (Physicians' Chamber of the North Rhine region, Germany) and AOK Rheinland (national, public health insurance company, Rhineland).
Study group
The group included 344 children (51.5% male, 48.5% female) from a total of 361 children enrolled in the schools (95.3%). The parents of 17 children were not willing to give written consent for their children to take part in the study.
Variables and data assessment
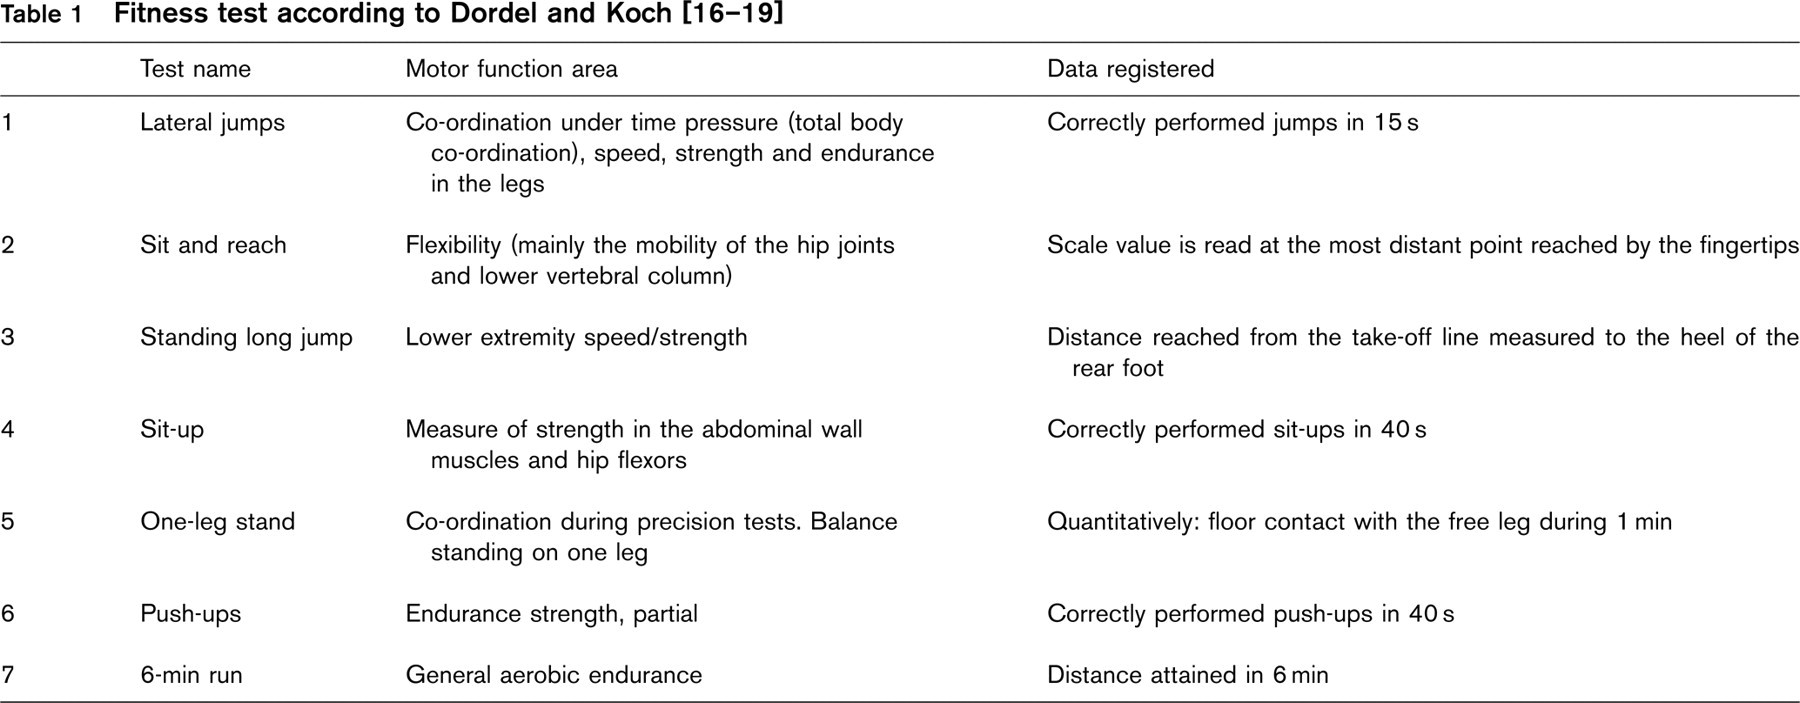
We first registered the anthropometric data of the children. Subsequently, they performed a fitness test according to Dordel and Koch [16], in order to determine the child's motor abilities (Table 1). We asked the parents about the time spent watching television and computer use, using an expert-made standardized questionnaire. Information about organized activities (times per week), regular (times per week) and irregular (times per year) activities, and performed sport disciplines was collected. The activities were summarized and classified as follows: no sport activity, only irregular sport activity, regular (and irregular) sport activity, organized (and irregular sport activity), and organized and regular (and irregular sport) activity. A total of 224 parents (65.1%) completed the questionnaires.
Assessment of anthropometric data
Height and weight were measured. For weight, 500 g were deducted for the light gymnastic clothing the children wore. From these data, we calculated the body mass index (BMI) in kg/m2. The BMI was classified according to the German percentile graphs by Kromeyer-Hauschild et al. [15]. Children with a BMI < 10. percentile were classified as underweight, ≤ 10. to < 90. percentile as normal, ≤ 90. to < 97. percentile as overweight, and ≤ 97. percentile as obese [15].
Performance of motor ability tests
The motor tests used are standardized, validated instruments to obtain a comprehensive picture of the main types of motor stress testing co-ordination, endurance, strength and flexibility (cf. Table 1).
All test assignments were performed for children between 5 and 10 years [16, 17]. For every item, age-and gender-specific reference values are found in the literature. They provide an age- and gender-specific classification of very good, good, normal, moderately disturbed, severely disturbed – adjusted for gender and age [16–19].
Lateral jumping
The children should jump back and forth over a line on a felt-like floor as often as possible. This serves for measuring co-ordination under time pressure (whole-body co-ordination), speed and strength endurance of the leg muscles. Two runs are performed, and correct jumps made in 15 s are counted as raw values [19].
Sit and reach
This exercise is used to determine flexibility. The children sit on the ground and straighten their legs in a right angle against a standardized device. Then they bend their upper body forward, moving their hand as far forward as possible. The legs remain stretched. Zero on a centimetre scale is at the position of the heels. Positive values range beyond the feet in extension of the legs, negative values, in the areas of ‘foot' and ‘leg'. The scale is read at the farthest point the fingertips can touch, this reading being used as a raw value [16].
Standing long jump
This exercise is used to measure take-off power. Taking off with both legs (in parallel positioned, bent legs), the subject should jump as far as possible and touch down with both feet, standing firmly. Swinging with the arms was permitted. Two runs were performed, and the higher measured value was used. The raw value was the distance from the take-off line to the heel of the rear foot [17].
Sit-ups
Sit-ups can be used to test the strength of the muscles of the abdomen and of the hip flexor. The subject lies in a dorsal position on a mat. The feet are kept apart as wide as the hips and set up. The feet are held down by another child so that they cannot get off the ground. The subject raises his/her chest until the elbows touch the knees, then the chest is lowered until the shoulder blades just touch the ground. The subjects should do as many sit-ups as possible in 40s (= raw values) [17].
One-leg stand
This exercise tests the co-ordination for precision tasks and the balance on standing. The children try to stand on a small rope barefooted on either leg for 1 min. The ground contacts with the free leg during the minute are counted as raw values. If the number of contacts exceeds 15 in 30 s, the test will be discontinued [17].
Push-ups
This test is used to measure the muscles of the arms and trunk. The subject lies in prone position and initially keeps his/her hands on his/her buttocks. The hands are moved from the back and put down below the shoulders. Then the subject pushes him/herself up from the ground until the arms are stretched. One hand is now taken off the ground and touches the other hand. During this procedure, only the hands and toes are kept in contact with the ground. Trunk and legs are stretched. The arms are then bent again until the body is back in prone position. The subject returns to his/her initial prone position with his/her hands on the buttocks (clap his/her hand behind his/her back). The correctly performed push-ups in 40 s are counted as raw data [17].
Six-minute run
The 6-min run was chosen to analyse endurance performance. It is valid for school children and correlates with results of treadmill testing [18]. The children ran a distance of 54 m in small groups (up to eight children) for 6 min. The rounds were counted and the exact distance covered was determined. The performance was then evaluated according to Beck and Bös, depending on the distance run (in metres) [18].
Statistical analysis
First, descriptive statistics served to determine the mean values (x), standard deviations (s) as well as the minimal (min) and maximal (max) values. Differences between boys and girls were analysed using the t-test.
A multi-factorial analysis of covariances (ANCOVA) was performed to evaluate differences in the target variables (motor abilities, TV and PC time) in the BMI categories, adjusted for age and gender. As a post-hoc test, the Student–Newman–Keuls test was used. Correlations between two categorical variables each (e.g. between weight classes and sport activity) were examined using the χ2-test. A result was considered significant if P < 0.05. All analyses were performed using SPSS 11.0.
Results
Anthropometric data
The anthropometric data of the 344 children are listed in Table 2. Boys were significantly older (P = 0.032) and taller (P = 0.006) than the girls. Body weight showed only a small difference (P = 0.060), and BMI demonstrated no difference (P = 0.486).
Based on the German age- and gender-specific BMI reference values [15], 6.5% of the children were obese, 5.5% overweight, 77.2% normal weight, and 10.8% underweight.
Results of the tests of motor ability
The test results are shown in Table 3. Differences between boys and girls were analysed using the t-test. Differences between the BMI classes after adjustment for gender and age are shown in Table 4. Within the post-hoc test, significant differences were found between the obese/overweight and normal/underweight children in the 6-min run, between the obese and the normal/underweight children in the standing long jump, and the obese and underweight children in the one-leg stand (each P < 0.05).
The anthropometric data of the children

s, standard deviation; n.s., not significant.
Results of the fitness test of the children
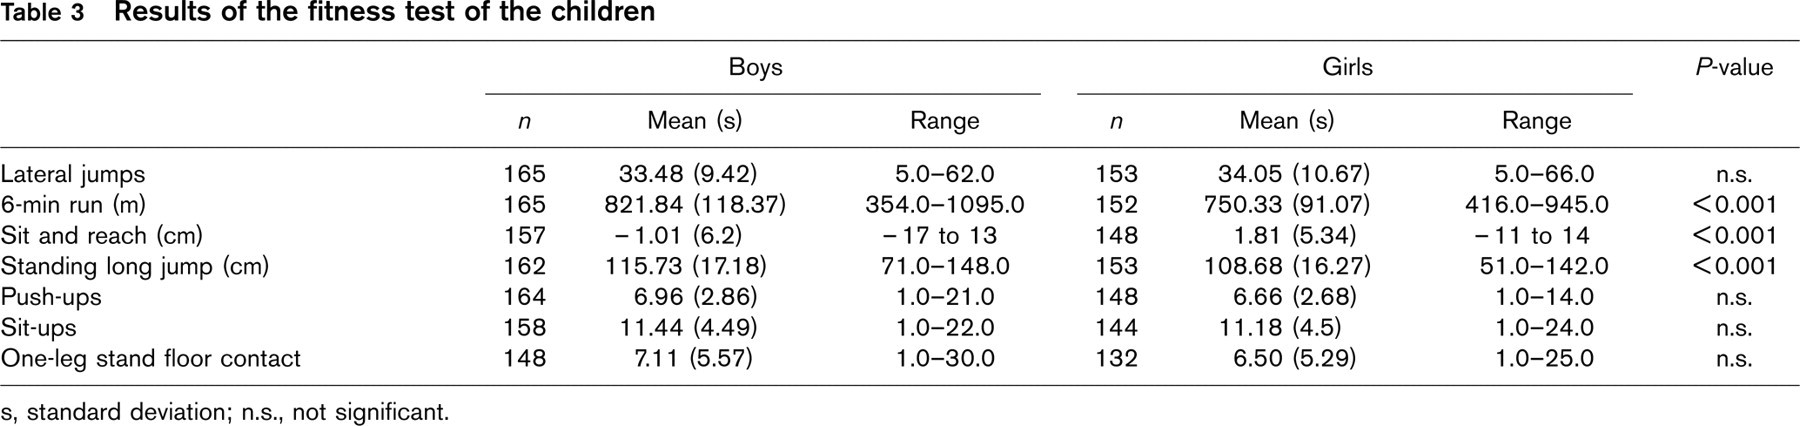
s, standard deviation; n.s., not significant.
Results of the fitness test associated with the body mass index classifications [15], P after adjustment for gender and age
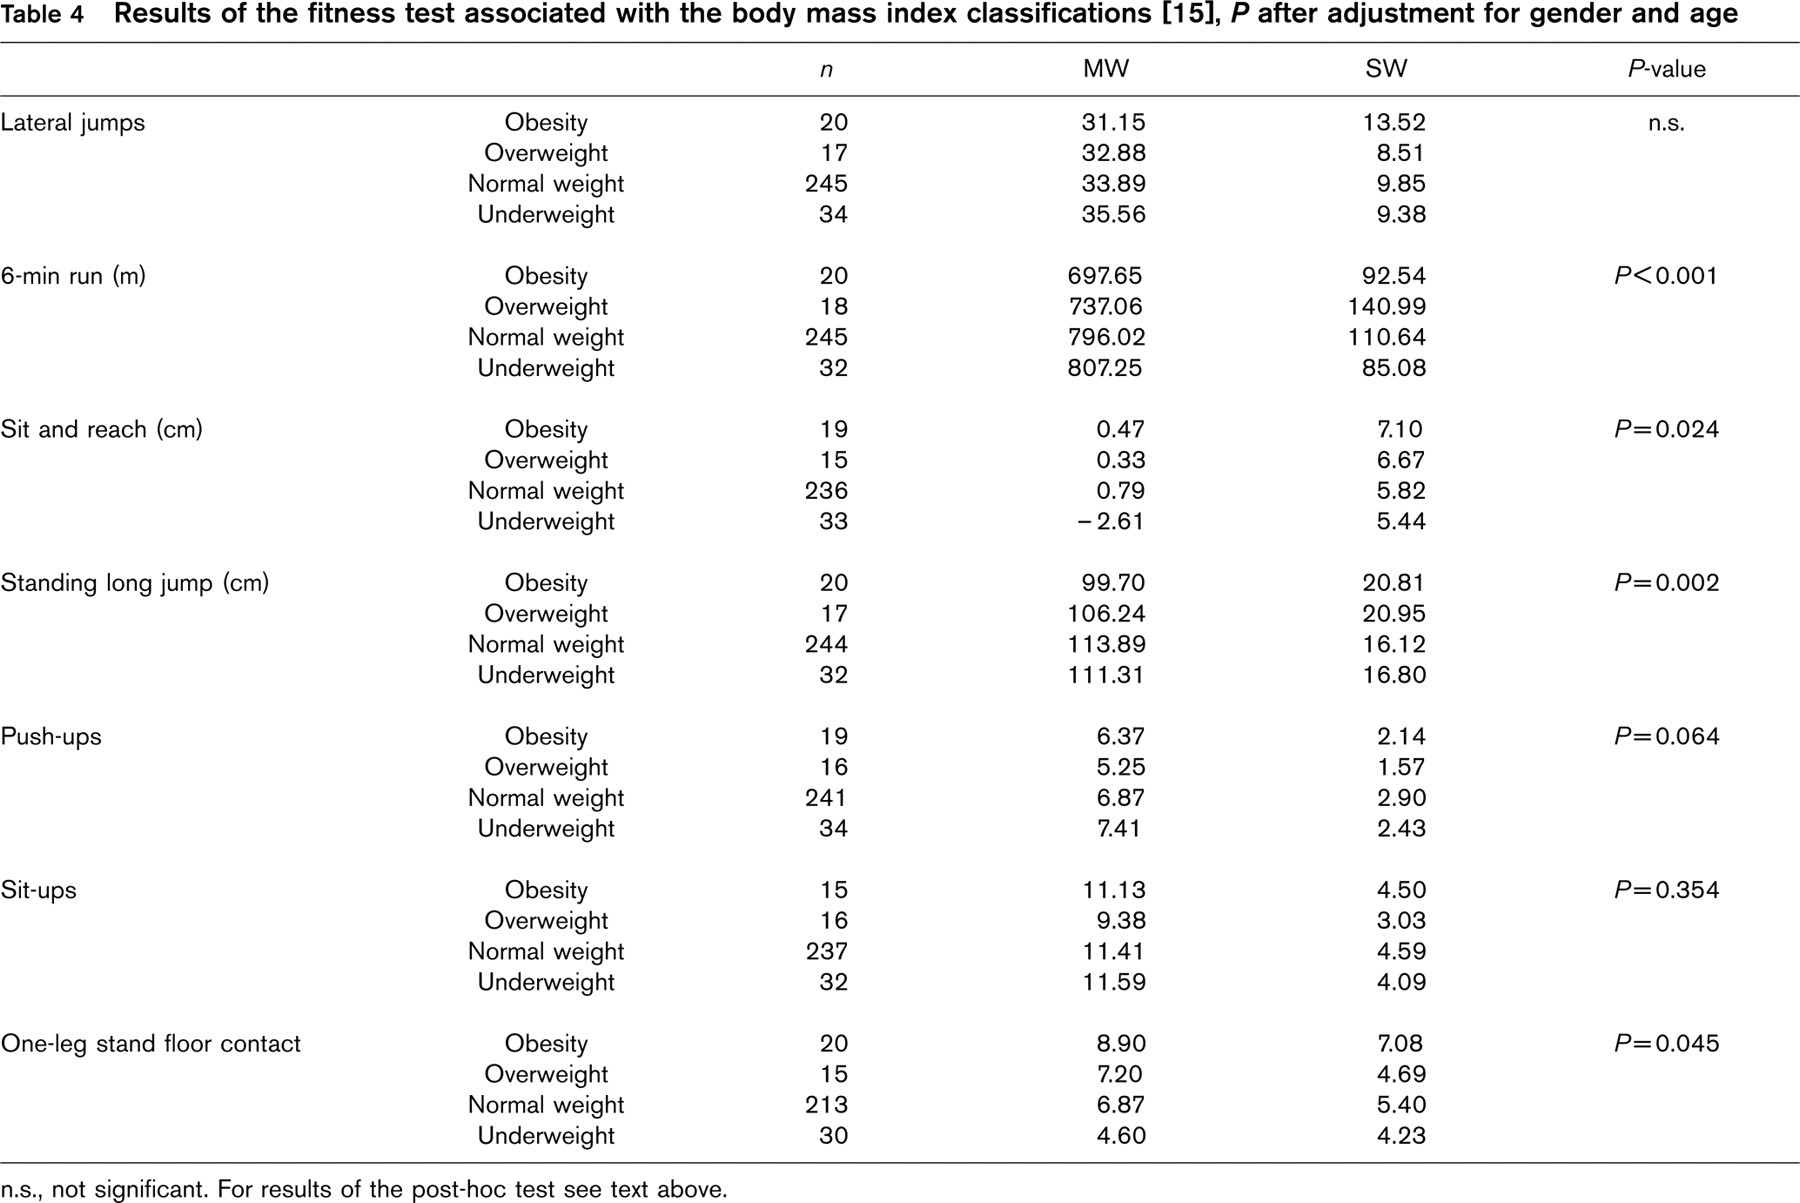
n.s., not significant. For results of the post-hoc test see text above.
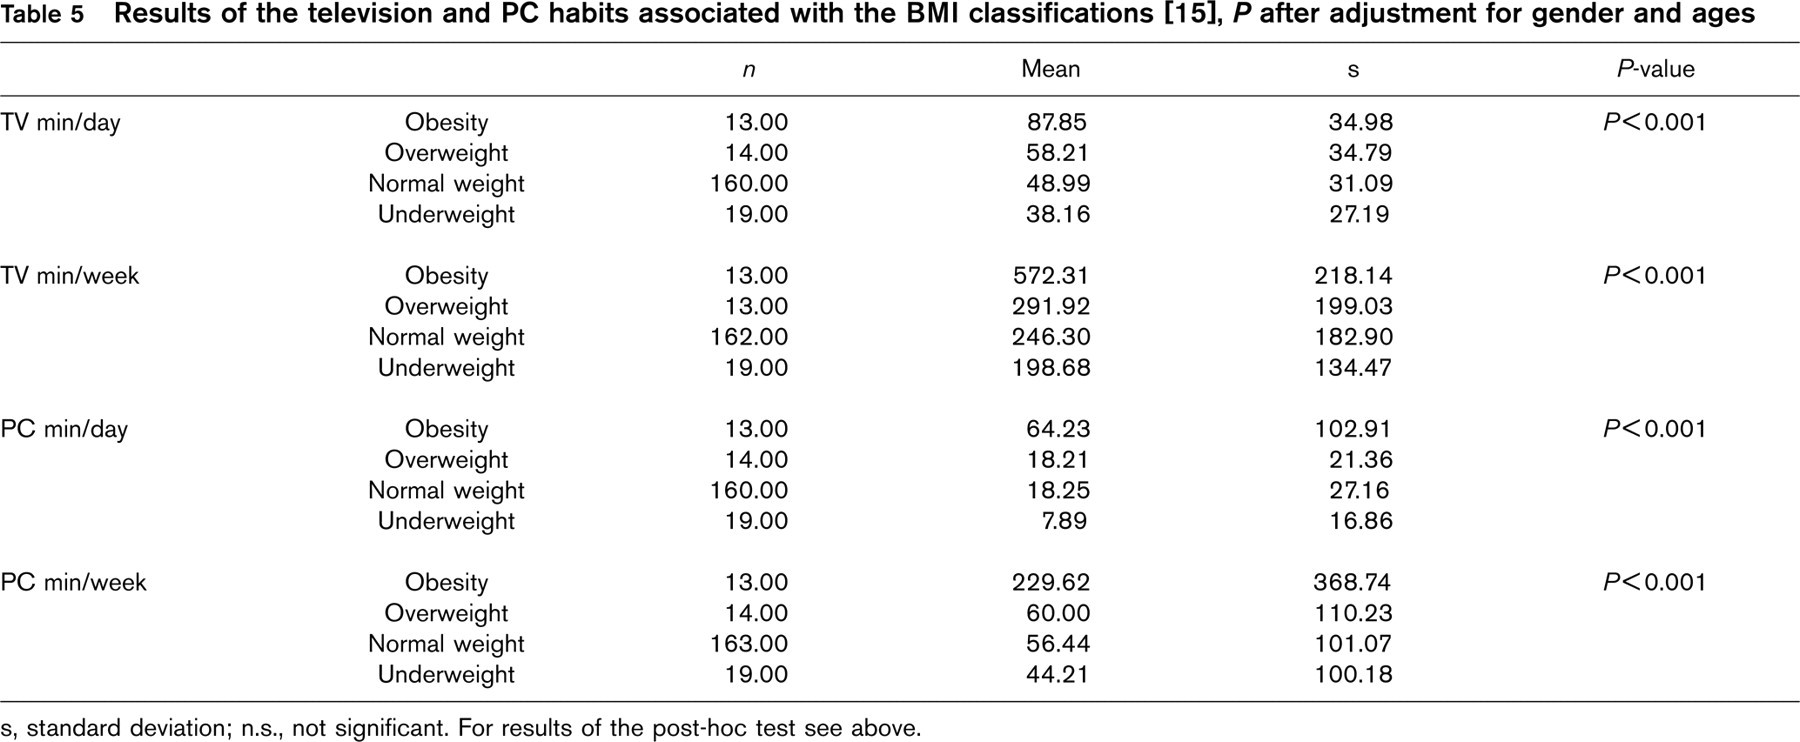
Television (TV) watching
The mean value of time spent watching TV was 50.11 ± 32.43 min/day (0 to 200 min) and 257.15 ± 197.52 min/week (0 to 840), respectively. There were no differences between the genders (P = 0.833 and P = 0.944, respectively). Adjusted for age and gender, the overweight children watched TV significantly longer per day and per week (P < 0.001 each; Table 5). In the post-hoc test, significant differences were found between the obese and over-/normal/underweight children in min/ day and min/week (P < 0.05 each).
Computer (PC)
The children's mean PC time was 19.61 ± 36.42 min/day (0 to 360) and 64.94 ± 135.94 min/week (0 to 1200). Boys spent more time at the computer (P = 0.006 and P = 0.001, respectively). Overweight children spent the longest time at their PC, adjusted for gender and age (P < 0.001 each; Table 5). The post-hoc test showed significant differences between the obese and over-/normal/underweight children in min/day and min/week (P < 0.05 each).
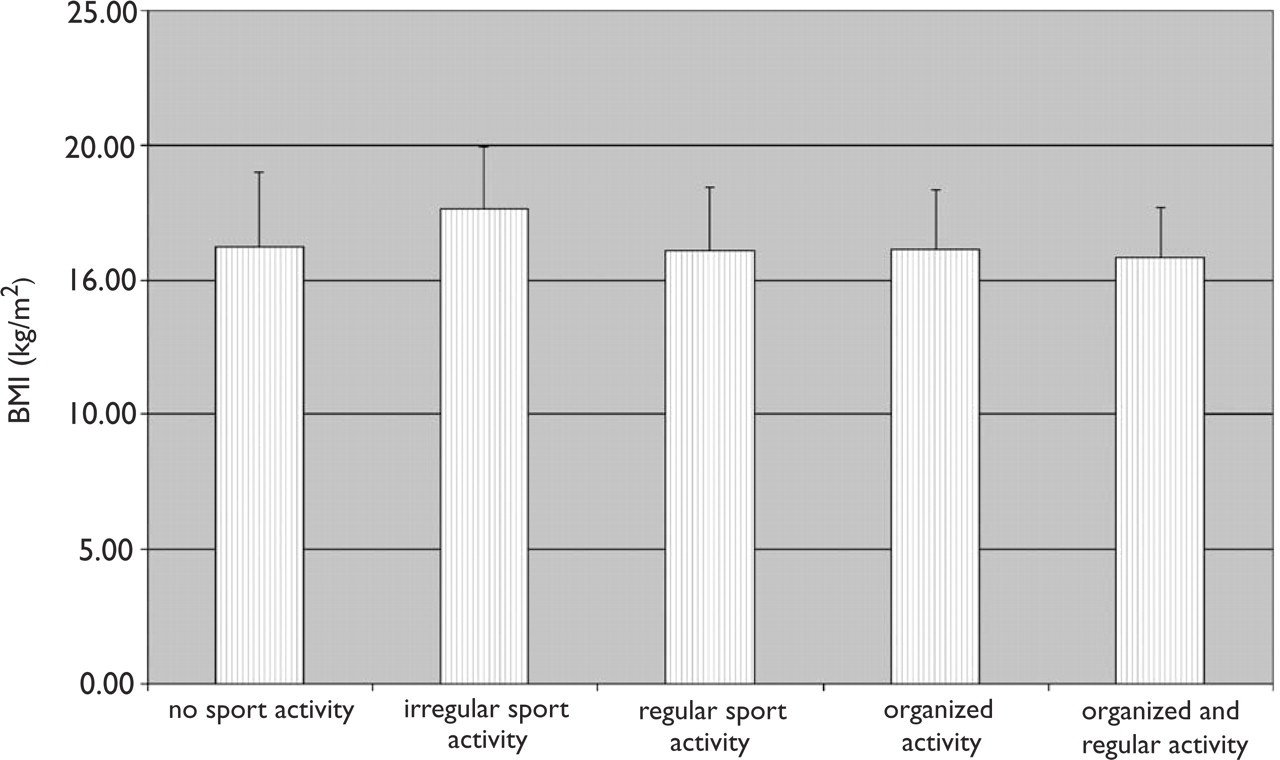
Body mass index (BMI) within the different exercise classes. There were no significant differences.
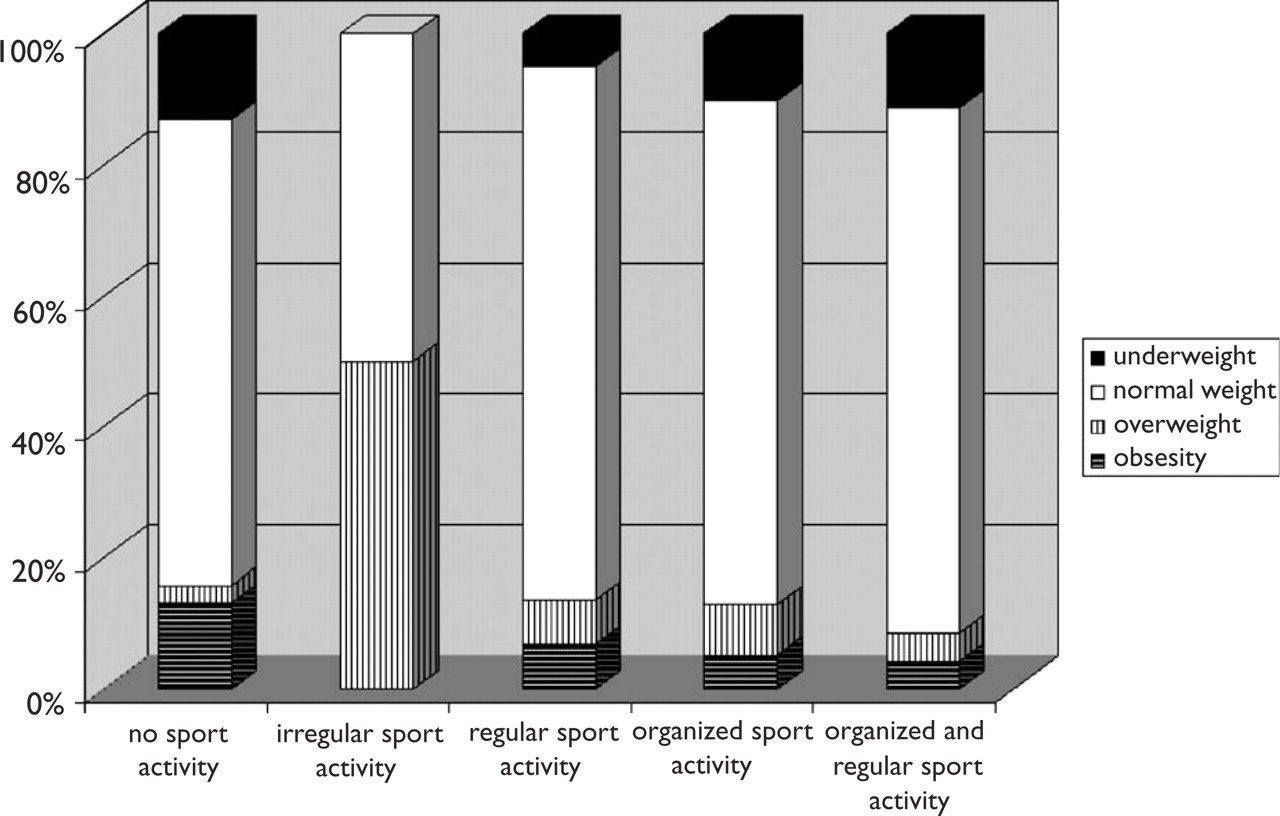
Body mass index classifications and exercise classification. With a P = 0.058 a trend of more overweight and obese children in the inactive classes was observed.
Active leisure behaviour
The parents of 39 children (17.5%) reported that their children were active in organized sports. Sixty-three (28.3%) children were regularly physically active outside a club. Seventy-five (33.6%) children did both. Four (1.8%) of the children were only irregularly active, and 42 (18.8%) were complete inactive. There were no differences between boys and girls (P = 0.438), neither with respect to the anthropometric data, in particular BMI (Fig. 1), the results of the motor tests and the time spent with audiovisual media within the exercise classes (P > 0.05 each). However, there was a tendency that in the group of inactive children more obese children were found and within the active classes, more normal-weight children (P = 0.058, cf. Fig. 2). There were no differences between TV and PC time between the exercise classes (each P > 0.05).
Results of the television and PC habits associated with the BMI classifications [15], P after adjustment for gender and ages
s, standard deviation; n.s., not significant. For results of the post-hoc test see above.
Discussion
Overweight and obesity are increasing in children [20]. Environmental changes and an increased use of audiovisual media, especially of television and personal computer, are often assumed to be responsible. However, the discussion remains controversial [6, 8, 21]. To elucidate these complex associations, we used different methodological tools including the measurement of anthropometric data, motor abilities and a standardized questionnaire about leisure habits within a representative population of first-grade children.
In our study 5.5% overweight and 6.5% obese children were found in accordance with other German data [22]. These children demonstrate deficits in important main forms of motor activity, in particular endurance and leg strength, although there was only a small tendency for obese children to be active in their leisure habits. On the other hand, these cross-sectional data could not answer one very important question: Do the children do less sports because of their increased body weight and then develop the motor deficits or do primary deficits lead to decreased motor activity and then overweight and a preference for sedentary activity? The analyses of the sedentary behaviour may give some elucidation. The time spent watching television was more than 30% higher and the use of video games and PC was even three times higher in obese children than that in the other children, whereas within the exercise classes no significant differences between body weight and BMI were found. There was only a small difference for more obese and overweight children within the inactive classes. This could cautiously be interpreted as suggesting that involvement in fewer daily activities plays a greater role at this early age than being active in organized exercise or similar active habits among obese children. These findings are in accordance with another cohort of the CHILT-project [13]. To our knowledge no other data have been published examining these complex associations.
Therefore, we can support the demand for less television watching and computer use [6, 21] and underline the importance not only of active habits, but also of an increase in active daily behaviour in accordance with the recommendations which have recently been published by the American Heart Association [20]. In addition, longitudinal studies and controlled intervention programmes should evaluate the effect.
Footnotes
Acknowledgements
Special thanks go to all the pupils who conscientiously took part in the study and to the teachers who gave us the necessary time and space to carry out the study. In addition, we would like to thank the parents, for their interest and additional help. Our personal thanks also go to all the assistants. Without their zealousness in carrying out all the pre-study preparations and post-study evaluations, this assessment would not have been possible. Last but not least, we would like to thank Dr McCabe and Karin Thiele for their critical look at this paper.