
Abstract
Objective
With the implicit purpose of identifying relevant intervention targets, the aim of the study was to test if lifestyle factors associated with obesity are unevenly distributed across social groups, and whether an uneven distribution of such factors may contribute to the explanation of social differences in obesity.
Design
Cross-sectional study of 3290 men aged 53-75 years (mean = 63) carried out in 1985-1986 using in addition, data from a previous baseline established in 1970-1971. Information about lifestyle factors was obtained from a questionnaire validated during an interview. Potential risk factors were smoking history, alcohol consumption, leisure time physical activity (LTPA), and from the 1985-1986 study only: consumption of tea and coffee, use of sugar in tea or coffee, and avoidance of fat in foods. The clinical examination included measurements of height and weight. Obesity was defined as a body mass index ≥30 (BMI = kg/m2). Based on information about education and job profile the men were subdivided into five social classes.
Results
Overall, 291 men (8.8%) were obese. The lower the social class the higher the proportion of obese men: in social classes I and II, 4.5% (of 953), social class III, 9.1% (of 636), social class IV, 11.1% (of 1353), and social class V, 11.6% (of 346), P< 0.001 (trend test). Leisure time physical activity, alcohol consumption, smoking habits, use of sugar in hot beverages, and consumption of coffee and tea, were all significantly associated with obesity, either positively or negatively, and even significantly associated with social class. Based on these lifestyle factors it was possible to discriminate subgroups with highly different prevalences of obesity. Despite this, adjustment for identified obesity covariates in a multiple logistic regression analysis did in no way explain the association of social class with obesity.
Conclusion
Lifestyle factors in concert strongly associated with obesity are unevenly distributed across social classes, yet incapable of explaining the higher prevalence of obesity in lower social classes.
Introduction
In industrialized countries obesity is an increasing problem on the verge of reaching epidemic proportions [1, 2]. Obesity is a strong risk factor for such condition as adult onset diabetes mellitus and cardiovascular disease [3], the condition resulting basically from a complex interplay of genetic factors, environmental factors, and lifestyle factors [4, 5].
In addition to being a health problem per se, obesity is a social problem with numerous epidemiological studies finding a clustering of obesity in the lower social classes [6]. In 1996 Stunkard, in a review of socio-economic status and obesity, stated that ‘studies on the social determinants of this disorder are desperately needed’ [6]. This appears still to be the case. Many factors, which may have an influence on weight are unevenly distributed across social classes, and may accordingly contribute differently to the risk of becoming obese or maintaining obesity.
With the implicit purpose of identifying relevant intervention targets, the aim of the study was to test if lifestyle factors associated with obesity are unevenly distributed across social groups, and whether an uneven distribution of such factors may contribute to the explanation of social differences in obesity.
Subjects and methods
The Copenhagen Male Study (CMS) was set up in 1970–1971 as a prospective cardiovascular cohort study of 5249 men with a mean age of 48 years (range 40–59). The examination comprised a short interview based on a previously completed questionnaire from which information on leisure time physical activity (LTPA) levels, total alcohol consumption, and smoking was used in addition to some objective measurements, including height and weight [7, 8]. With respect to LTPA the men answered the following question: ‘Which description most precisely covers your pattern of physical activity in leisure time? (1) You are mainly sedentary e.g., you read, watch television, go to the pictures. In general you spend most of your leisure time performing sedentary tasks. (2) You go for a walk, use your bicycle a little or perform physical activity for at least 4 h/week, e.g., light gardening, leisure time building activity, table tennis and bowling. (3) You are an active athlete, run, play tennis or badminton for at least 3 h/week. If you frequently perform heavy gardening, you also belong to this group. (4) You take part in competitive sports, swim, play European football, handball or run long distances regularly i.e., several times/week’. For analytical purposes LTPA was subdivided into two groups: the sedentary group (category 1) versus the others.
According to the system of Svalastoga [9], later adjusted by Hansen [10], the men were subdivided into five social classes based on education and job profile. Typical jobs in the study cohort were, in social class I: officer, civil engineer, office executive, head of department; social class II: head clerk, engineer, non-academic architect; social class III: engine driver, train guard; social class IV: machine fitter in a telephone company, station foreman; social class V: unskilled labourer, mechanic, driver. This initial classification has been used throughout the study since, in the 1985–1986 re-examination, almost half of those participating were no longer work active.
In 1985–1986 a new baseline was established. Participants from the 1970–1971 study were traced by means of the Danish Central Population Register. Between June 1985 and June 1986, all survivors (except 34 emigrants) from the original cohort were invited to take part in this study. A total of 3387 (75%) agreed and gave informed consent; their mean age was 63 years (range 53–74).
The 1985–1986 study took place at the Glostrup Population Studies, Glostrup Hospital, (University of Copenhagen). Each subject was interviewed about a previously completed questionnaire and examined, with measurements of height and weight.
Total weekly consumption of alcohol was calculated from questionnaire items about average alcohol consumption on weekdays and at weekends. Intakes of beer, wine and spirits were reported separately. One drink corresponded to 10–12 g ethanol [11]. The men classified themselves as never smokers, previous smokers, or current smokers. Current tobacco consumption was calculated from information about the number of cigarettes, cheroots, cigars, or the weight of pipe tobacco smoked daily: one cigarette was taken as equivalent to 1 g tobacco, one cheroot as 3g tobacco, and one cigar as 4 g tobacco. As previously estimated by means of serum cotinine, the validity of tobacco reporting was high [12]. As regards leisure-time physical activity, the men classified themselves as belonging to one of four categories from definitely sedentary to very active, namely, performing vigorous activity for at least 4 h per week [13]. Dietary factors were crudely measured based on some simple questions: (1) Do you try to avoid fat food? (2) Do you take sugar in your coffee? (3) Do you take sugar in your tea? Also the number of cups of daily consumption of coffee and tea was asked for.
A total of 342 men reported a history of acute myocardial infarction (AMI), angina pectoris, stroke or intermittent claudication. Whether these men were excluded from the analyses or not had no substantial influence on the results presented or the interpretation of data. Ninety-seven men, 2.8%, were excluded due to missing values; 3290 men were eligible for study.
Each participant was informed that all personal data were confidential, and gave written consent about participation. The ethics committee for medical research in the County of Copenhagen approved the study.
Statistics
Basic analyses comprising Student's t-test, chi-squared test, Kendall's tau-b test for trend, test for trend in analysis of variance, and the regression analyses were performed with the SPSS statistical software for Windows [14, 15]. Odds ratios were calculated by taking the natural loge raised to the regression coefficient for the variable of interest in a multiple logistic regression model with stepwise backward elimination of variables and the maximum likelihood ratio method. In the multivariate analyses we used the program default allowing variables with P values ≤0.10 to remain in the adjusted model.
Results
Table 1 shows the association of obesity [body mass index (BMI) ≥30] with social class, lifestyle and other factors among all men. In accordance with an overall higher prevalence of obesity in men in low social classes, the proportion of men in social class I or II was much lower in the obesity group (14.8%), than in the non-obese group (30.4%). Statistically strong associations were found between obesity in 1985–1986 and LTPA in 1970–1971, alcohol consumption in 1970–1971, LTPA in 1985–1986, smoking status in 1985–1986, alcohol consumption 1985–1986, and use of sugar in hot beverages. Smoking and use of sugar in hot beverages were both associated with a lower prevalence of obesity; alcohol consumption, low physical activity and low social class with a higher prevalence of obesity.
Table 2 shows the association of social class with obesity, lifestyle and other covariates. In social classes I and II, 4.5% of the men were obese with a gradual increase in the proportion of obese men with lower class. Low social class was associated with a more sedentary lifestyle, more smoking, and a higher alcohol consumption in 1970–1971 as well as in 1985–1986; also, in low social classes a higher proportion of men reported using sugar in hot beverages in 1985–1986, and the lower social classes had a higher consumption of coffee. No associations with social class were found with respect to avoidance of fat and age distribution.
Table 3 shows the result of a multiple logistic regression analysis including age and lifestyle factors. After adjustment eight factors remained in the model with the strongest statistical association found for a low level of leisure time physical activity (from completely sedentary to an activity level of maximum 4 h of moderate activity per week) compared to those with a higher activity level, followed by alcohol consumption in 1970–1971.
Social class, lifestyle and other characteristics according to obesity 1985–1986 [body mass index (BMI) ≥30]. Values presented are mean (SD) or frequency in percent
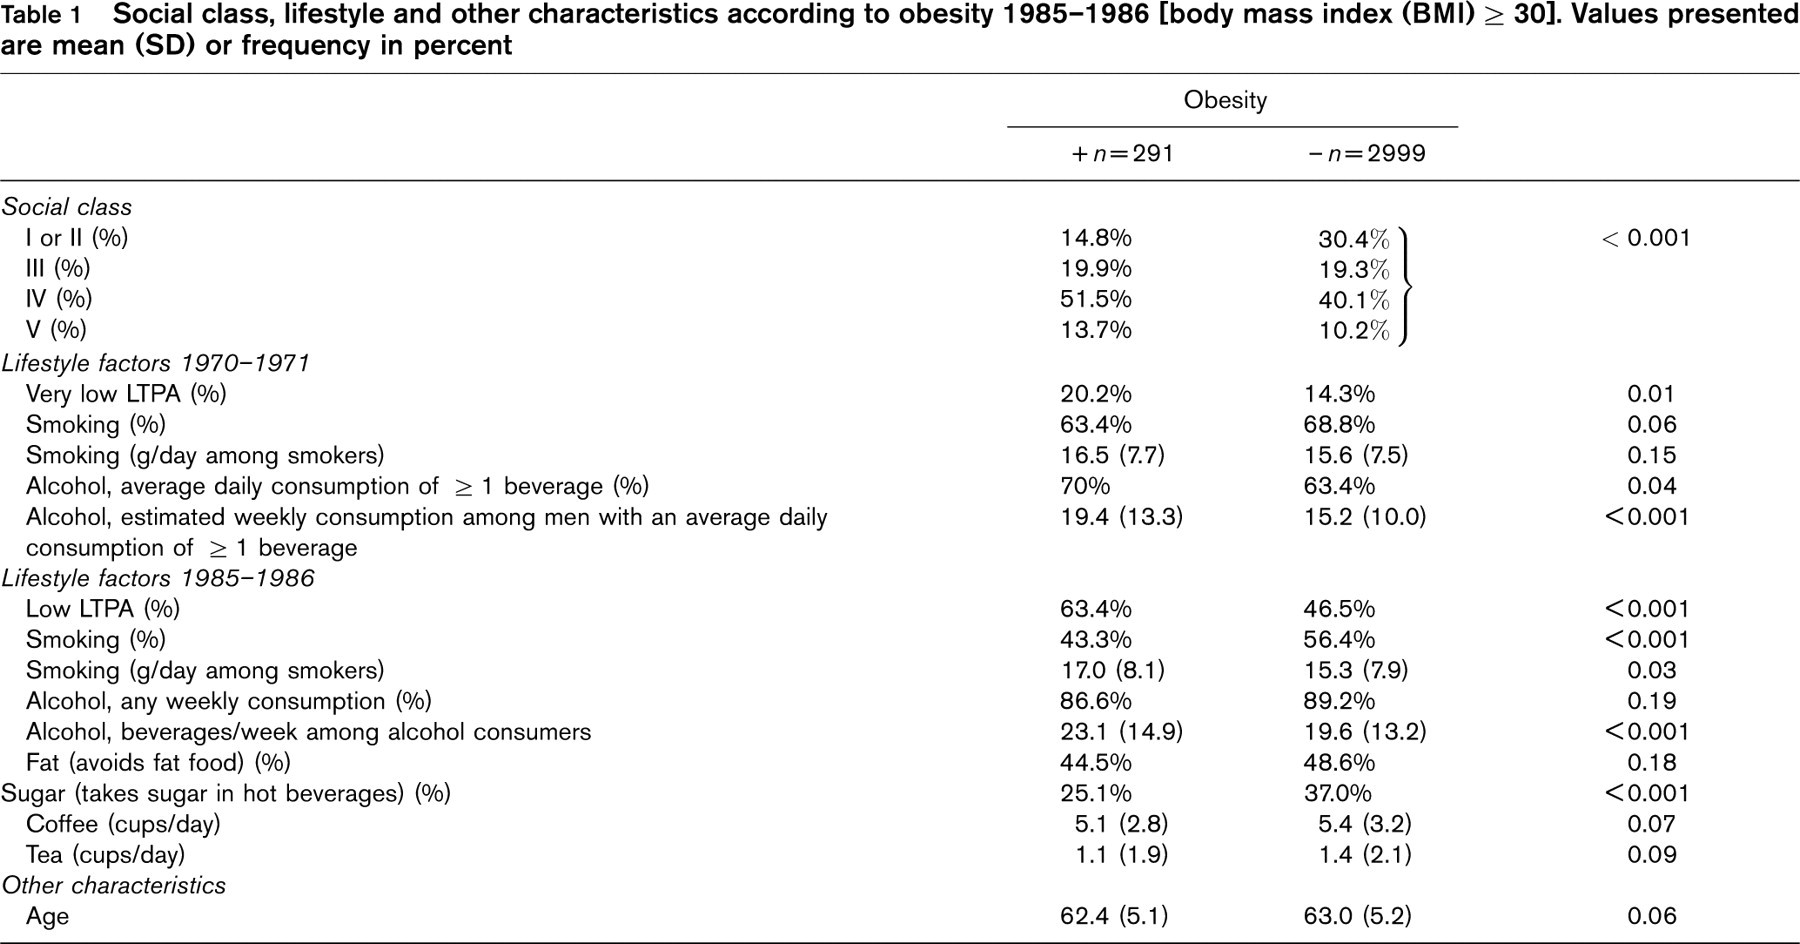
P values of Student's t-test or chi-squared test where appropriate. LTPA, leisure time physical activity.
Table 4 shows odds ratios for obesity in the different social groups referencing social groups I and II. Adjustment for an uneven social distribution of various obesity covariates as identified in Table 3 had little influence on the social gradient. In the full model, adjusting for all the factors, the gradient had even become slightly steeper.
Addressing different social classes
Based on lifestyle factors (except smoking) associated with obesity after adjustment in a multiple logistic regression analysis, as presented in Table 3, we constructed four separate simple indices by summing up lifestyle risk factors.
Risk factor clustering in non-smokers and obesity prevalence according to social class
Figure 1 illustrates the relevance of obesity covariates in all social groups with a strong positive gradient for all groups.
Risk factor clustering in current smokers and obesity prevalence according to social class
Figure 2 illustrates a corresponding association between clustering of obesity covariates and obesity prevalence among smokers. In agreement with the overall lower prevalence of obesity among current smokers, the prevalence of obesity was lower in most subgroups when compared to the non-smoking equivalents. Of the 16 subgroups only one had an obesity prevalence higher than 15% as compared with five of the 16 groups among non-smokers exceeding a prevalence of 15%.
Obesity 1985–1986 [body mass index (BMI) ≥30], lifestyle and other characteristics according to social class. Values presented are mean (SD) or frequency in percent
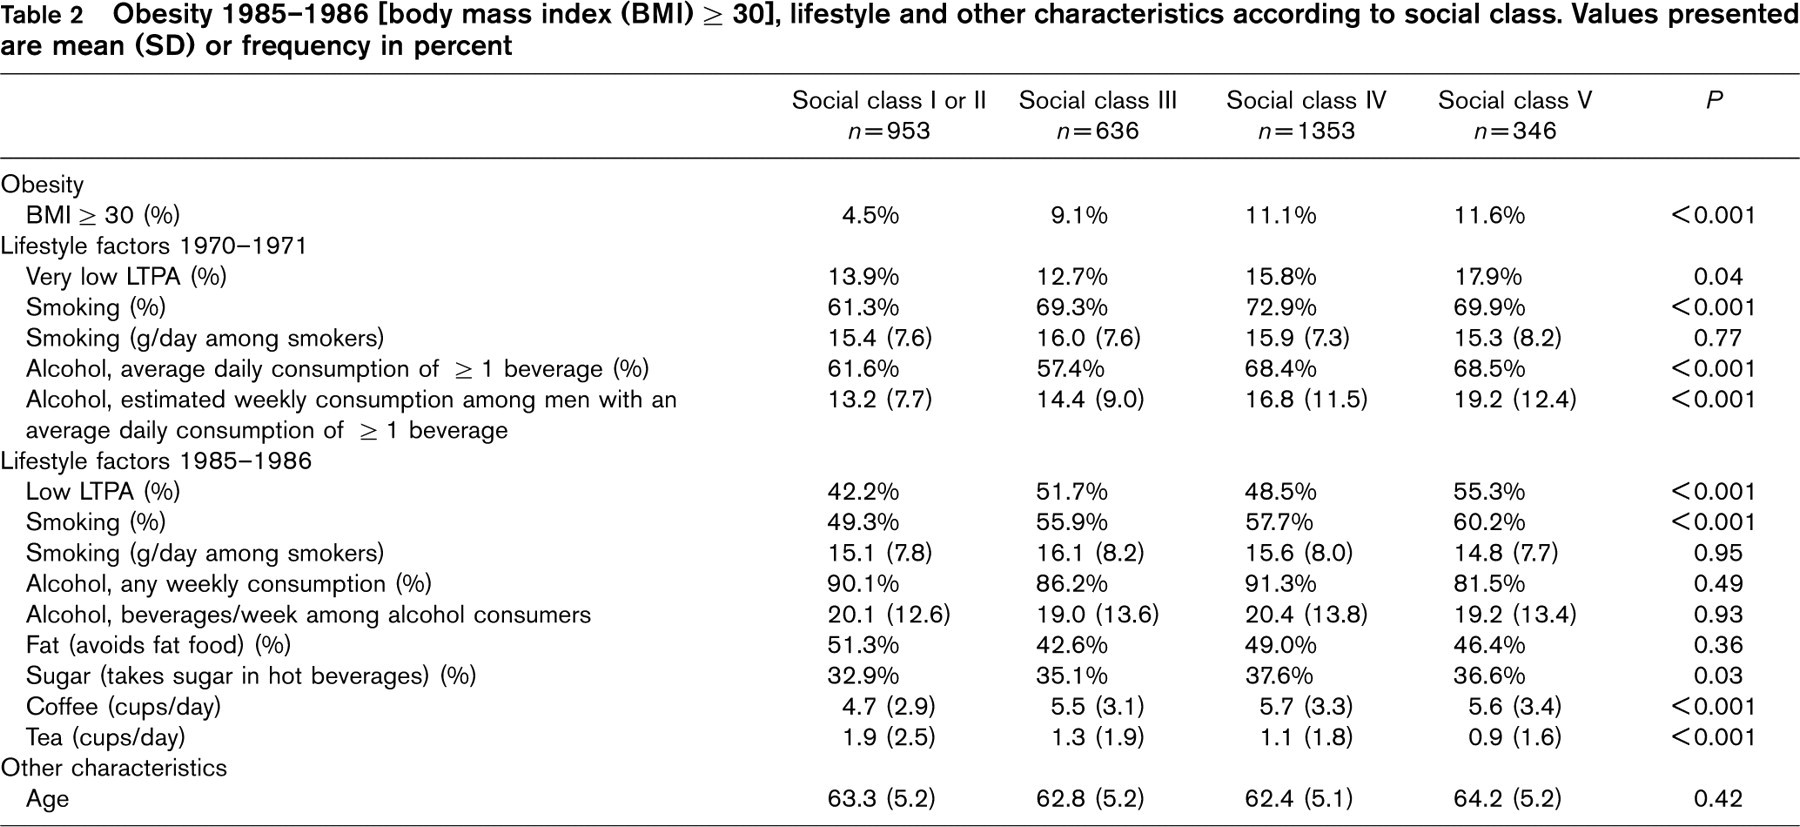
P values of tests for trend: Kendall's tau-b for categorical variables, or test for linearity in analysis of variance. LTPA, leisure time physical activity.
Analysis of all men. Lifestyle characteristics according to obesity 1985–1986 [body mass index (BMI)≥30] versus less. Multiple logistic regression analyses using stepwise backward elimination and the maximum likelihood ratio method. Variables are presented according to statistical strength of association with obesity after multivariate adjustment. Odds ratio (OR) with 95% confidence limits are presented for variables in the final adjusted model (P<0.10)
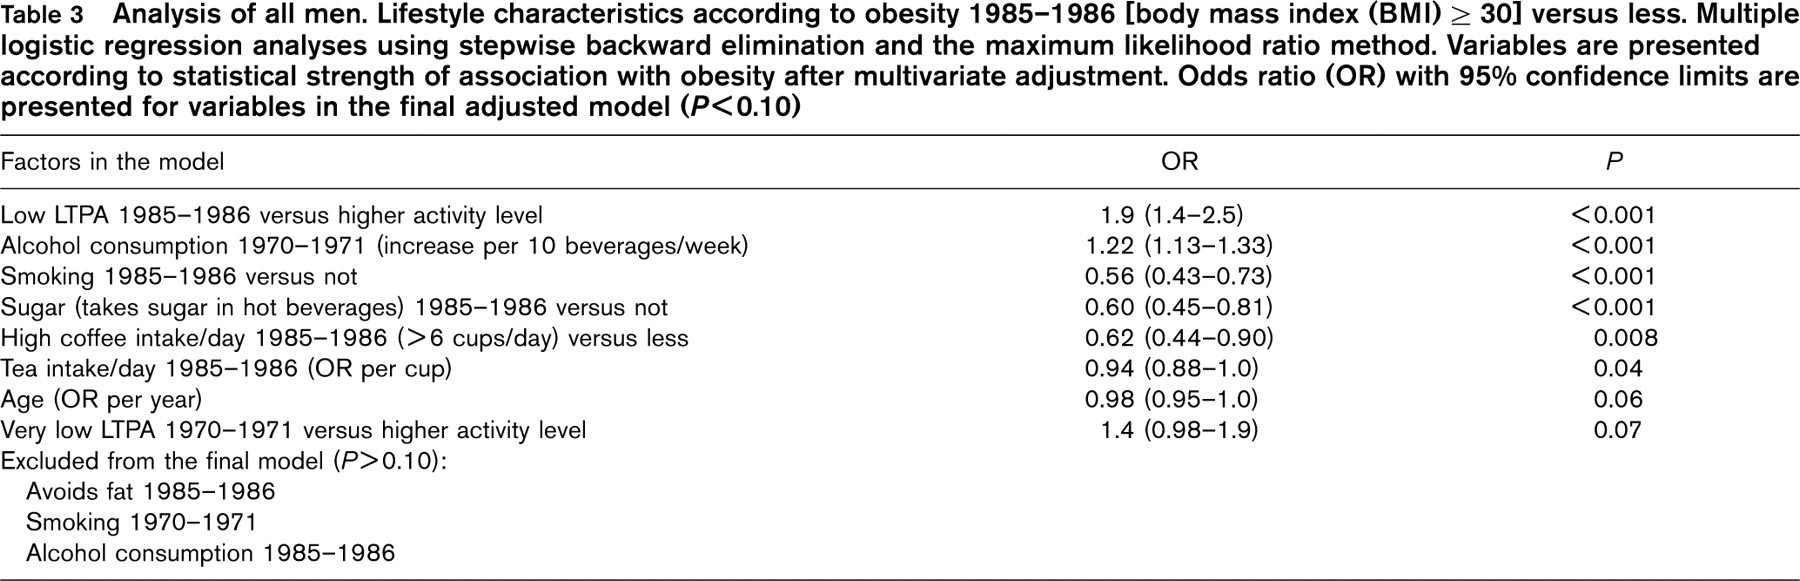
LTPA, leisure time physical activity.
Odds ratios (95% confidence limits) for obesity according to social class following different adjustment criteria. Logistic regression analyses with forced entry of variables
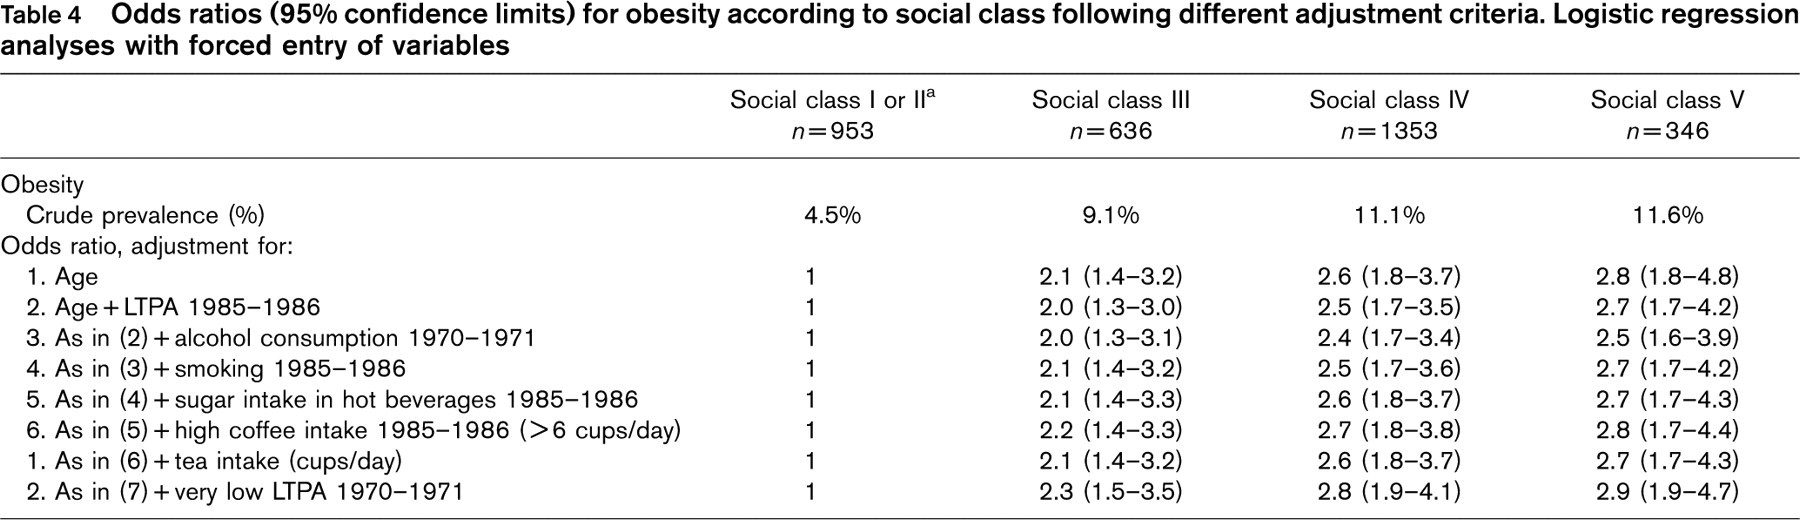
a Reference group. LTPA, leisure time physical activity.
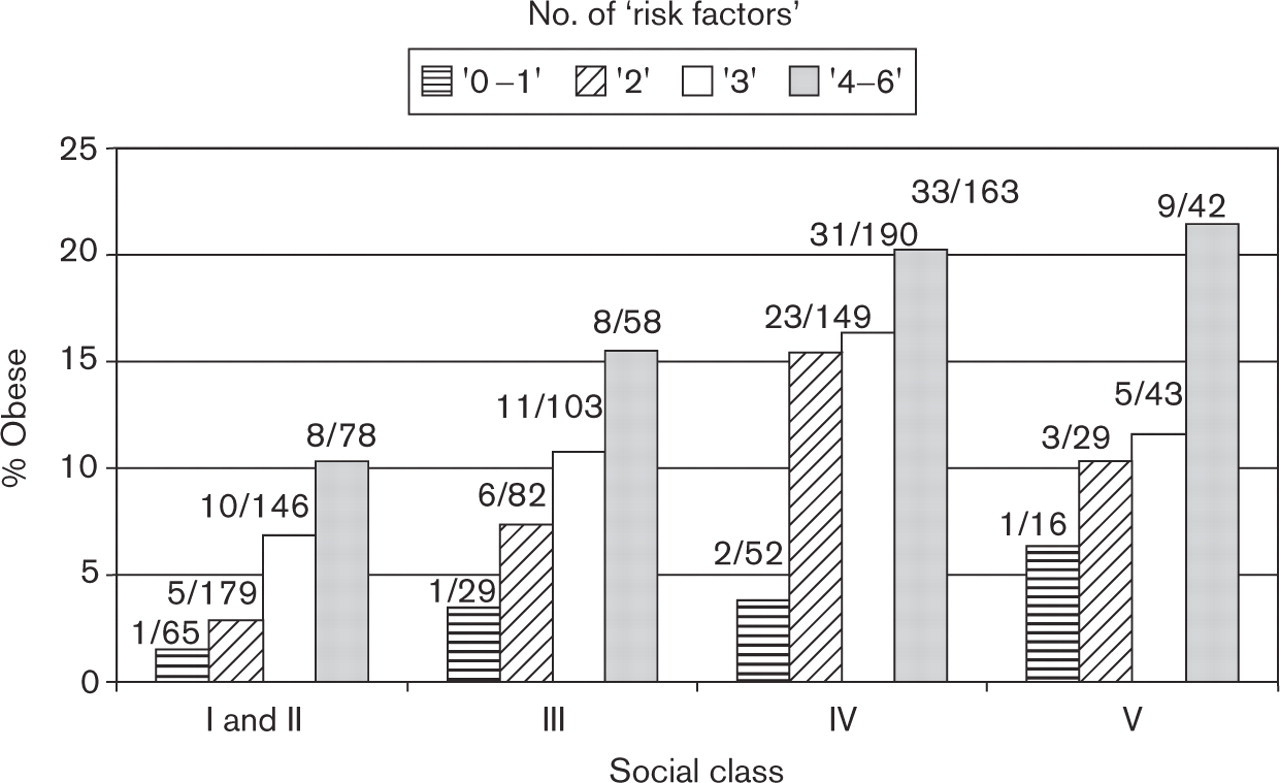
Current non-smokers only. Obesity (body mass index ≥30) according to number of non-smoking-related factors associated with increased prevalence of obesity in Table 3: low leisure time physical activity (LTPA) 1985–1986, relatively high alcoholic consumption 1970–1971, no sugar intake in hot beverages 1985–1986, relatively low coffee intake 1985–1986, no tea intake 1985–1986 and very low LTPA 1970–1971.
Additional analyses
A significantly higher proportion of men who reported to avoid fat also reported avoiding sugar intake in hot beverages, 40 versus 30%, P<0.001 (not shown in table). To gather more circumstantial evidence for a possible weight-lowering or weight-controlling effect of sugar intake in hot beverages, we took a closer look at the group of men within the BMI range 20–25 in 1970–1971, that is the so-called normal weight men. This group encompassed more than 1500 men, and, it seems unlikely that many of these men should modify their use of sugar in hot beverages as part of a weight control program. Thus, we subdivided the BMI in the 1985–1986 cohort into five BMI subcategories: (1) up to 22; (2) > 22–24; (3) > 24–26; (4) > 26–28 and (5) > 28. Among normal weight men in 1970–1971 within these groups the proportion of those taking sugar in their hot beverages in 1985–1986 gradually decreased: from BMI group 1 to 5 proportions were 46, 42, 38, 38 and 28%, respectively, P = 0.004 (Kendall's tau-b trend test).
Discussion
Leisure time physical activity, alcohol consumption, smoking habits, use of sugar in hot beverages, and consumption of coffee and tea, were all significantly associated with obesity, either positively or negatively. In support of the hypothesis, all of these factors were significantly associated with social class, either positively or negatively. Adjustment for the uneven social distribution of these factors did not explain the association of social class with obesity.
In cross-sectional studies with retrospective data it is necessary to consider potential bias, in the present study in particular bias related to selection. Selection bias is a potential source of bias, which may be attributed to differences in characteristics of study responders and non-responders. Such selection could invalidate results of descriptive epidemiological studies, assuming the aim was to survey in case obesity prevalence with the purpose of generalizing the results. However, some selection is present in all studies whether cross-sectional, cohort or case–control, and in analytical epidemiology aiming at disclosing risk factors, this is not crucial assuming a sufficient confounder control is applied.
Low social class is a well-known risk factor for obesity in industrialized, westernized countries [6]. In this study, too, lower social classes had a two- to three-fold higher prevalence of obesity compared with social classes I and II. Although the lifestyle covariates of obesity identified in this study were able to discriminate strongly between groups with a high and groups with a low prevalence of obesity, they did not explain the social obesity gradient. An explanation for this could be social differences in dietary habits [16], or some other still unidentified lifestyle factors.
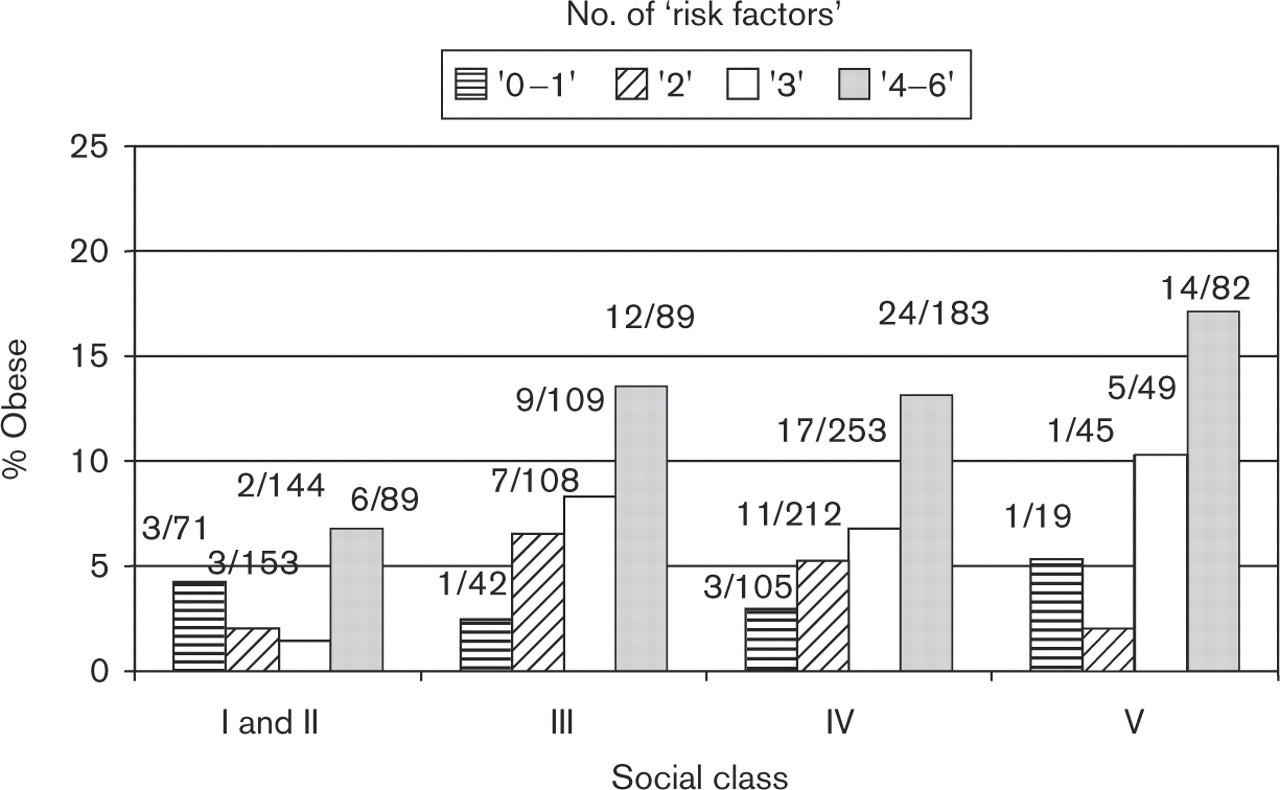
Current smokers only. Obesity (body mass index ≥30) according to number of smoking-related factors associated with increased prevalence of obesity in Table 3: low leisure time physical activity (LTPA) 1985–1986, relatively high alcoholic consumption 1970–1971, no sugar intake in hot beverages 1985–1986, relatively low coffee intake 1985–1986, no tea intake 1985–1986 and very low LTPA 1970–1971.
A low LTPA is generally recognized as a risk factor for obesity, and overall in this study, the risk factor most strongly associated with obesity [4]. Moreover, low LTPA was the only factor associated with obesity in all social groups after multivariable adjustment.
Also a positive relationship of alcohol consumption and an inverse association of smoking with increased weight are well-known associations [4]. However, only in the lower social classes, IV and V, did the associations of smoking with obesity reach statistical significance.
Interestingly, sugar intake in hot beverages was the strongest covariate in social classes I and II, and remained in the final adjusted model even in social classes III and IV (not shown).
With respect to coffee intake and obesity we have not been able to find epidemiological studies specifically addressing this issue. However, several experimental studies in humans and animals have shown an increase in metabolic rate after caffeine administration [17, 18]. In our study the data indicated a threshold value of more than six cups of coffee per day for coffee intake to be associated with a reduced prevalence of obesity.
With the exception of sugar use in hot beverages, all the other covariates of obesity identified in this study have previously been shown to influence body weight, and this influence has been explained via well-known metabolic mechanisms. Although sugar intake in hot beverages has not been addressed specifically in epidemiological studies total sucrose consumption has been related to weight and obesity. Thus, the comprehensive epidemiological Scottish study of more than 11 000 men and women showed a clear and graded inverse correlation between total sugar consumption and prevalence of obesity among men within the lowest quintile of sugar intake 18% were obese as compared with only 5% within the upper quintile [19]. The biological mechanisms explaining the inverse association between sugar intake and obesity observed in our and other epidemiological studies, if causal, are not readily at hand. However, glucose intake stimulates secretion of glucagon-like peptide 1 (GLP-1) which is produced in enteroendocrine L cells of the small and large intestines. Its major physiological effect lies in a strongly glucose-dependent stimulation of insulin secretion from pancreatic β-cells, and it has been shown that GLP-1 is associated with decreased caloric intake in experimental animals [20]. Accordingly, satiety after the intake of even small amounts of sucrose several times a day may be part of the explanation [21, 22]. For many years people with weight problems have been advised to cut down on their sugar intake and to avoid fat, particularly saturated fatty acids, namely, animal fat. Despite this only a weak association was found between avoidance of fat and obesity. Yet, self-assessed avoidance of fat seemed to be a marker of weight consciousness, the implications of which are addressed in the additional analyses section. Even this observation makes it less likely that the association between sugar use in hot beverages and obesity can simply be ascribed to a weight control effort.
As mentioned, the inverse association between social class and obesity is in accordance with findings in other European and westernized societies. In other less industrialized societies the association between social class and obesity is in general in the opposite direction. So far, the covariates of obesity in different social classes have not been analyzed in other studies. The findings presented in this study suggest different primary targets for intervention among different social classes with the exception of physical activity being highly relevant for all groups. In this context smoking protects against obesity in the lower social classes. However, no one would recommend tobacco smoking for weight reduction considering its harmful health effects. So, with respect to middle-aged and elderly men from lower social classes, reducing alcohol consumption and increasing LTPA appear to be the major targets for obesity prevention identified in this study—at least if our findings can be generalized.
Lifestyle factors are to some extent surrogate measures of adverse or beneficial dietary habits [16, 23]. However, considering the limited information on dietary habits in CMS, it is interesting that the covariates of obesity identified in this study, were able to discriminate groups with highly different prevalences of obesity. Furthermore, assuming the obesity covariates were reflecting dietary habits these factors should have been capable of explaining an at least easily observable part of social differences in obesity. They were not.
To sum up, although the identified risk covariates of obesity may to some extent reflect adverse dietary habits, it is striking that these factors were able to discriminate groups of middle-aged and elderly men with highly different prevalences of obesity, that they did not explain social differences in obesity, and that different obesity risk factors seemed to be important in different social groups. The finding that basically non-dietary factors are strongly associated with obesity risk may have both public health and clinical implications.
Footnotes
Acknowledgements
This study received grants from The King Christian X's Foundation, The Danish Medical Research Council, The Danish Heart Foundation and The Else & Mogens Wedell-Wedellsborg Foundation.