
Abstract
Background
Overestimation of risk by Framingham risk functions not only in southern but also in northern European populations including Germany, has led to the development of the SCORE risk estimation model.
Design
Data of the German National Health Interview and Examination Survey 1998 was used to determine whether SCORE leads to lower estimates of the 10-year absolute risk of fatal cardiovascular disease and fatal coronary heart disease than a Framingham model. Predicted numbers of events were compared with approximations based on national mortality statistics.
Methods
Inclusion criteria followed the recommendations for the use of SCORE: age 30 to 69 years, no previous history of cardiovascular disease and no markedly raised levels of single risk factors (leaving 1811 men and 1955 women for analysis).
Results
The SCORE model for high-risk regions (SCORE-HIGH, which is recommended for Germany pending calibration with national data) predicted the highest number of events, followed by the estimations with mortality statistics, the Framingham model and SCORE-LOW (87 fatal cardiovascular disease events versus 77, 62 and 47; fatal coronary heart disease events 62 versus 46, 46 and 30). Agreement on high-risk status, defined as the 10-year risk of fatal cardiovascular disease of 5% or higher now or if extrapolated to age 60, was moderate for both men and women (≤ 0.52 and 0.42 for Framingham and SCORE-HIGH).
Conclusions
Our results suggest that SCORE-HIGH may overestimate absolute risk of fatal coronary heart disease and cardiovascular disease in Germany and may need calibration. Furthermore, the limitations of current risk prediction tools emphasize the ongoing need for comprehensive, high-quality and timely European cohort data.
Introduction
Cardiovascular risk assessment has become an important tool in the primary prevention of cardiovascular disease (CVD) and has led to a paradigm shift in the clinical management of risk factors, in particular in the management of elevated blood pressure and lipids [1,2]. The first and internationally most widely used risk prediction tools were developed with data from the Framingham Heart Study [3–6]. They have been included in numerous prevention guidelines, including those issued by the Second Joint Task Force of European and other Societies on Coronary Prevention 1998 [7]. When predicted risks have been compared with observed risks in European populations, however, Framingham is found to have overestimated coronary heart disease (CHD) and CVD risk in low-risk southern European populations by at least a factor of two [8–11]. In northern European populations, older studies seemed to suggest quite close agreement of CHD events as predicted by Framingham functions [12–14]. More recently, however, validation studies have shown overestimation of risk by Framingham in cohort study participants in the UK [15] and Denmark [16], as well as in clinical trial populations from Scandinavia, The Netherlands and the UK [11].
In Germany, the only Framingham model that has been evaluated so far is that of Anderson [4,17]. The application of this model for prediction of absolute risk of myocardial infarction (MI) and CHD death to the German Monica and PROCAM cohorts showed a rather satisfactory ability to separate high from low-risk individuals (area under the curve ranging from 0.73 to 0.88 in the ROC analyses) [18]. Absolute risk, however, was considerably overestimated: the ratio of predicted over observed risk was between two and three depending on the age group and remained at least at 1.5, even after taking into account methodological differences in outcome ascertainment between Framingham and the German cohorts.
Alternatively, the PROCAM model, which is based on an occupational cohort from Münster in Germany [19], has been praised for including risk factors like low-density lipoprotein (LDL) cholesterol, triglycerides, and a family history of premature CHD. The PROCAM model, however, was developed only for men and the only external validation study so far shows overestimation of risk both in a low-risk population in France and a high-risk population in Belfast [9].
Therefore, the new SCORE model presented in 2003 and recommended in the guidelines of the Third Joint Task Force of European and other Societies on Cardiovascular Disease Prevention in Clinical Practice [20,21] represents an interesting new option for Germany.
Since the Framingham model by Anderson has been shown to considerably overestimate coronary risk in Germany, our primary study question was whether in a representative sample of the general population in Germany, the SCORE model predicted less cardiovascular events than the Framingham model of Anderson. This comparison is possible for the 10-year risk of fatal CHD and the 10-year risk of fatal CVD, since both SCORE and the Framingham Anderson model can estimate these two endpoints [4,17,21]. For comparison, we calculated the expected 10-year probability of CVD death using national mortality statistics. Furthermore, we examined the agreement on the ordering of risk by the two models by comparing equidistant risk deciles and the allocation to a high and a low-risk group according to the definition of the Third Joint Task Force of European and other Societies on Cardiovascular Disease Prevention.
Methods
Study sample and risk factor measurements
The study population consisted of participants in the German National Health Interview and Examination Survey (NHIES) 1998. The design, instruments, physical examination and laboratory measures of the NHIES 1998 have previously been described in detail [22–25]. The survey comprised a nationally representative sample of the residential population in Germany (n = 7124) obtained by a stratified random sampling method based on official registers of local residents aged 18-79 years. The response rate was 61.4% and an additional 16.0% completed a short questionnaire. For the age range 30-69 years, which is relevant for this study, the response rate was 63.5% plus 14.8% with short questionnaires. Participants completed a detailed questionnaire and underwent a standardized and computer-assisted interview, taken in person by a study physician. Any medicines taken during the previous 7 days were recorded, and the indications for them were coded as International Classification of Diseases (ICD)-9 diagnoses. Additionally, a set of standardized physical examinations and laboratory measurements were performed in a central laboratory.
Starting from this representative sample of the residential population in Germany, inclusion criteria were derived from the instructions for the use of the two models: age 30-69 years, complete data for the risk factors needed for risk estimation and absence of a history of CVD. CVD was defined as a history of, or current medication for myocardial infarction, angina pectoris, CHD, stroke, transient ischaemic attack or peripheral arterial disease, as reported in the medical interview. Participants with a total cholesterol of 320 mg/dl or higher, LDL cholesterol of 240 mg dl or higher, blood pressure 180 110 mmHg or higher or diabetes with microalbuminuria were excluded from the risk prediction sample, because, according to the European guidelines, they can be assumed to be already at high risk. This left a total of 3766 participants (1811 men and 1955 women) to be included in the analysis (Fig. 1).
Diabetes was defined as a history of diabetes or current treatment with oral antidiabetics or insulin. Because of the difference between the definitions of smoking in Framingham and SCORE, we used ‘current daily smoking or quit within past year' for Framingham-based calculations and ‘current daily smoking' for calculations with SCORE. Upper arm blood pressure was measured in the sitting position with a mercury sphygmomanometer in accordance with a standardized protocol. Three measurements were taken at 3-min intervals after a non-strenuous part of the examination and an additional 3-min rest. The second and third measurements were averaged [25,26]. Fasting time was recorded. Blood drawing, urine sampling and all laboratory tests also followed a standard protocol. Total and high-density lipoprotein (HDL) cholesterol and triglycerides were measured using commercially available enzymatic methods (CHOD-PAP, direct measurement after blocking of LDL, VLDL and chylomicrons by antibodies, and GPO-PAP). LDL cholesterol was calculated using the Friedewald formula in participants with triglycerides under 4.7 mmol/l. Triglycerides and LDL measurements may have been overestimated in some participants due to insufficient fasting time, but they were only used to conservatively exclude participants with markedly raised levels of LDL from the study sample, and were not used for risk estimation or additional analyses.
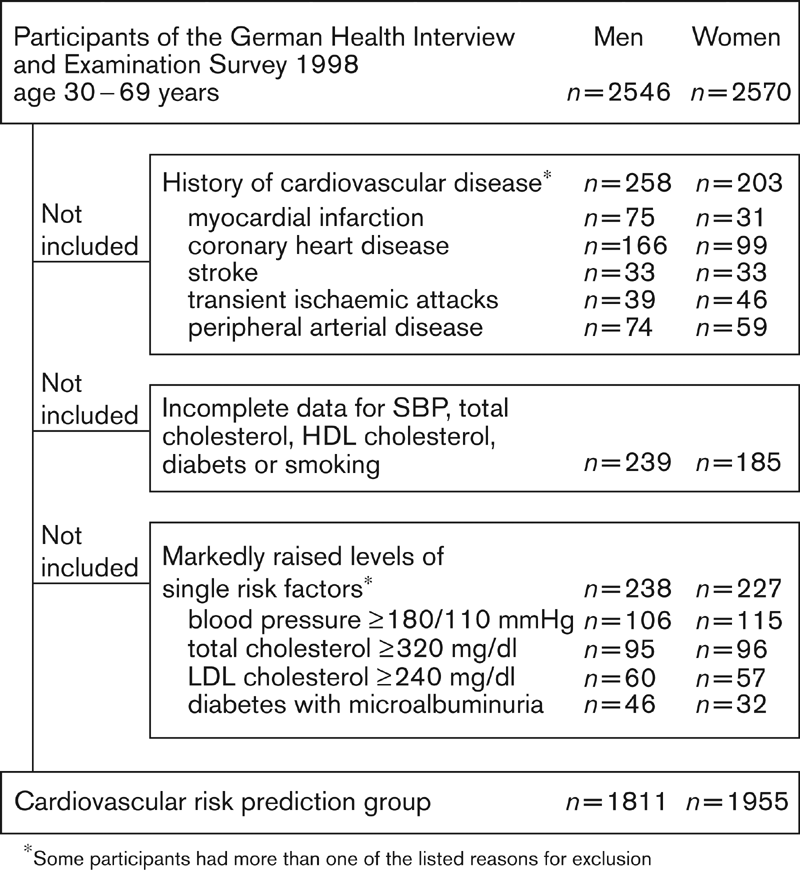
Flow diagram of the selection of the study sample from participants in the German Health Interview and Examination Survey 1998. SBP, systolic blood pressure; HDL, high-density lipoprotein; LDL, low-density lipoprotein.
Prediction models
We used the SCORE risk estimation function [21] and the Framingham equation by Anderson [17] to calculate the 10-year risk of fatal CHD and the 10-year risk of fatal CVD.
The SCORE model is based on pooled data from 12 European cohort studies and disposes of a much larger dataset than Framingham, at the cost of being able to estimate only risk of fatal CHD and fatal CVD. Nevertheless, a comparison of risk estimates based on SCORE and Framingham-Anderson is possible since the Framingham-Anderson model, which is best known for estimation of combined fatal and non-fatal CHD and CVD risk, is also able to estimate the risk of fatal CHD and fatal CVD [4,17]. The SCORE project has defined cardiovascular mortality as ICD-9 codes, probably largely based on death certificates. In the Framingham study on the other hand, while morbidity follow-up has been quite sophisticated and therefore difficult to reproduce, the best available information on the cause of death was also death certificates in more than 50% of cases [27,28].
Both models use information on age, sex, systolic blood pressure and dichotomized smoking. The Framingham model in addition includes the ratio of total and HDL cholesterol and dichotomized diabetes, while SCORE uses total cholesterol. Following the instructions for the use of the SCORE risk charts [29], we multiplied the SCORE risk estimates by two in diabetic men and by four in diabetic women.
Analysis
Coefficients with four and five decimal places were obtained from the authors of the SCORE model to enable greater precision (A. Fitzgerald, personal communication). Different coefficients have been published for risk estimation in high-risk and low-risk regions of Europe with SCORE and are denominated as SCORE-HIGH and SCORE-LOWin this paper. Germany is counted as one of the high-risk regions, but for comparison we also report risk estimates obtained with SCORE-LOW.
Sampling weights were used to ensure that the distribution of the survey participants was nationally representative with regard to age, sex, community size and east/west distribution [23]. Risk estimates for pairs of risk functions (Framingham and SCORE-HIGH, and Framingham and SCORE-LOW) were plotted on scattergrams, and agreement was evaluated with Bland-Altman plots of the mean of the two estimates for each subject against their difference [30]. In the case of perfect agreement, points lie along a horizontal line at y = 0 (null difference) in the Bland-Altman plot.
Agreement between two models in ordering risk was assessed by comparing the allocation of participants to equidistant risk deciles and to a high or low-risk group. The agreement was evaluated with κ statistics. A κ value of 0.0 is interpreted as evidence that the agreement is no better than chance alone, while a κ value of between 0.81 and 1.00 demonstrates excellent agreement. Values below or equal to 0.20, 0.21-0.40, 0.41-0.60, and 0.61-0.80 are interpreted as showing poor, fair, moderate and good agreement, respectively [31].
To calculate the expected number of fatal CHD and CVD events, we used the 1998 German mortality statistics [32], which are coded in ICD-10 (see Appendix).
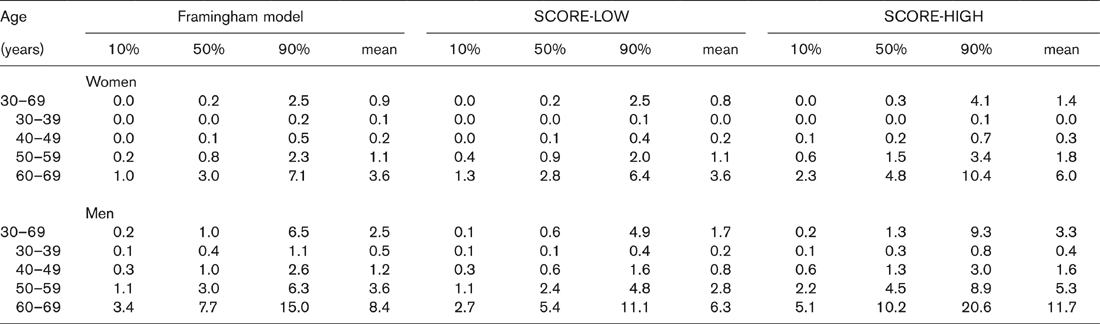
Estimated 10-year risk of fatal cardiovascular disease (%) in 1955 female and 1811 male participants of the German National Health Interview and Examination Survey 1998
Results
The 1955 women included in the analysis had a mean age ± SD of 46.1 ± 10.9 years, systolic blood pressure of 130.9 ± 18.2 mmHg, total cholesterol of 228.5 ± 39.3 mg/ dl and HDL cholesterol of 66.0 ± 18.1 mg/dl. Diabetes was present in 1.6% of women, 23.7% were current daily smokers and 29.0% either smoked daily or had quit within the past year. The 1811 men included in the analysis had a mean age ± SD of 45.5 ± 10.9 years, systolic blood pressure of 134.2 ± 15.5 mmHg, total cholesterol of 231.5 ± 37.9 mg/dl and HDL cholesterol of 51.3 ± 15.3 mg dl. Diabetes was present in 1.3% of men, 30.5% were current daily smokers and 36.7% either smoked daily or had quit within the past year. Of note, since participants with a history of cardiovascular disease were not included in the analysis, risk factor levels in the analysis group are considerably lower than in the overall NHIES sample (e.g. in unselected NHIES participants aged 30-69 years, diabetes was present in 4.3% of women and 5% of men).
Framingham and SCORE-based estimates were compared with regard to the level of estimated risk in the sample; the agreement of pairs of Framingham and SCORE risk estimates; ordering of risk into risk deciles; and agreement of allocation to a high or a low-risk group according to different risk-group definitions.
In most age groups and for men and women, mean SCORE-HIGH estimates were highest for both fatal CHD and fatal CVD, followed by Framingham and then SCORE-LOW (Table 1). SCORE-HIGH predicted 1.3 times more CHD events and 1.4 times more CVD events in our study sample than Framingham. The expected number of fatal CVD events in our sample based on the approximations with national mortality data were in-between SCORE-HIGH and Framingham (Fig. 2). Since there are only a few diabetics in the study sample, these results are robust to multiplication of the SCORE estimates by two and four in diabetic men and women (87 estimated events with the multiplication, 84 estimated events without the multiplication, which is still higher than the 77 events according to national mortality statistics).
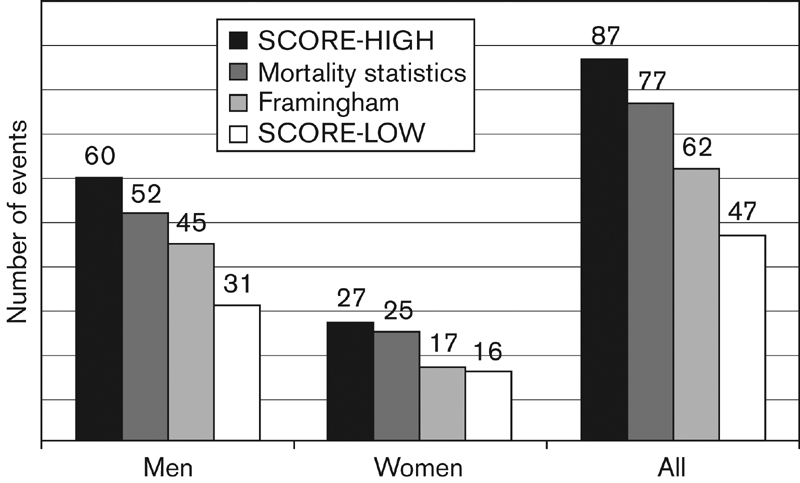
Number of fatal cardiovascular disease events within 10 years of the German National Health Interview and Examination Survey 1998, estimated with the Framingham prediction function and the SCORE model for high and low-risk regions in Europe. Estimated coronary heart disease events were 62 with SCORE-HIGH, 46 both with mortality statistics and Framingham and 30 with SCORE-LOW.
Agreement between pairs of SCORE-HIGH and Framingham fatal CVD risk estimates, as shown in the scattergrams and the Bland-Altman plots of the mean of the two estimates for each subject against their difference, was modest for both men and women (Fig. 3). Bland-Altman plots similar to Fig. 3 were obtained for the agreement of estimates of risk of fatal CHD and for the agreement of SCORE-LOW and Framingham both for CHD and CVD.
Framingham and SCORE-HIGH ordered 77% of men and 81% of women into the same risk decile of fatal CVD risk (equidistant deciles, ≤ 0.56 for men and 0.44 for women), and 96% of men and 93% of women into the same or adjacent risk deciles.
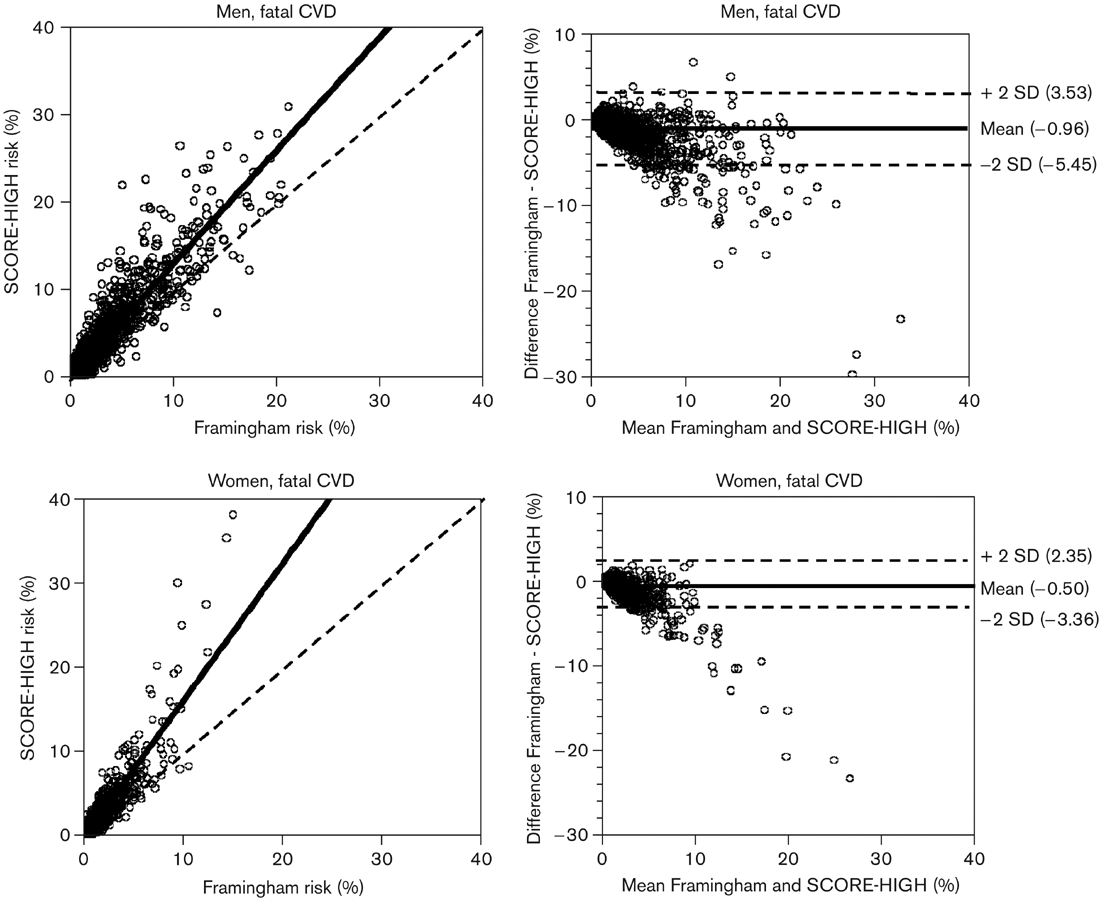
Scattergrams and Bland-Altman plots of cardiovascular disease risk in 1955 female and 1811 male participants of the German National Health Interview and Examination Survey 1998, estimated with the Framingham prediction function and the SCORE model for high-risk regions in Europe (SCORE-HIGH). CVD, cardiovascular disease.
When high-risk was defined according to the 2003 European guidelines on cardiovascular disease prevention [20], as the 10-year risk of fatal CVD of 5% or higher either now or if extrapolated to age 60 years, there was agreement in risk-group allocation between Framingham and SCORE-HIGH in 92.9% of women and 70.2% of men, with κ values of 0.52 and 0.42 (Table 2). Framingham and SCORE-LOWallocated 97.2% of women and 76.9% of men to the same risk group (≤ 0.64 and 0.52). Modifying the risk-group definition, by leaving out the extrapolation to age 60 years, improved agreement in risk-group allocation for men between Framingham and both SCORE variants to over 90% (Table 2).
Discussion
We have used the new SCORE prediction function for fatal CHD and CVD events in high-risk regions of Europe (SCORE-HIGH), which is recommended for Germany pending calibration of the SCORE model with national data, on a representative sample of men and women residing in Germany. In doing so, we found that SCORE-HIGH estimated for both fatal CHD and fatal CVD a higher level of risk than found when using the Framingham model of Anderson or national mortality statistics. It seems compelling to conclude that SCORE-HIGH overestimates risk in Germany, but a number of possible sources of bias have to be examined.
Let us first examine the predictive accuracy of the Framingham model. Framingham-based risk functions have been shown to overestimate risk not only in southern [8–11] but also in northern European populations [11,15,16] including two cohorts from Germany [18] in which risk was overestimated by at least 50%. The German validation study has evaluated predictive accuracy of combined fatal and non-fatal coronary endpoints, and does not report predictive accuracy for fatal end-points alone. It is, however, very likely that overestimation occurs for both fatal and non-fatal events. This is supported by two studies from Denmark and the UK which have both found overestimation of fatal CHD by the Framingham-Anderson model (by 47% in the British regional heart study [15] and by 9% in the Glostrup cohort in Denmark [16]).
Agreement of risk-group allocation using the Framingham model and the SCORE model for high-risk regions (SCORE-HIGH) and low-risk regions (SCORE-LOW)
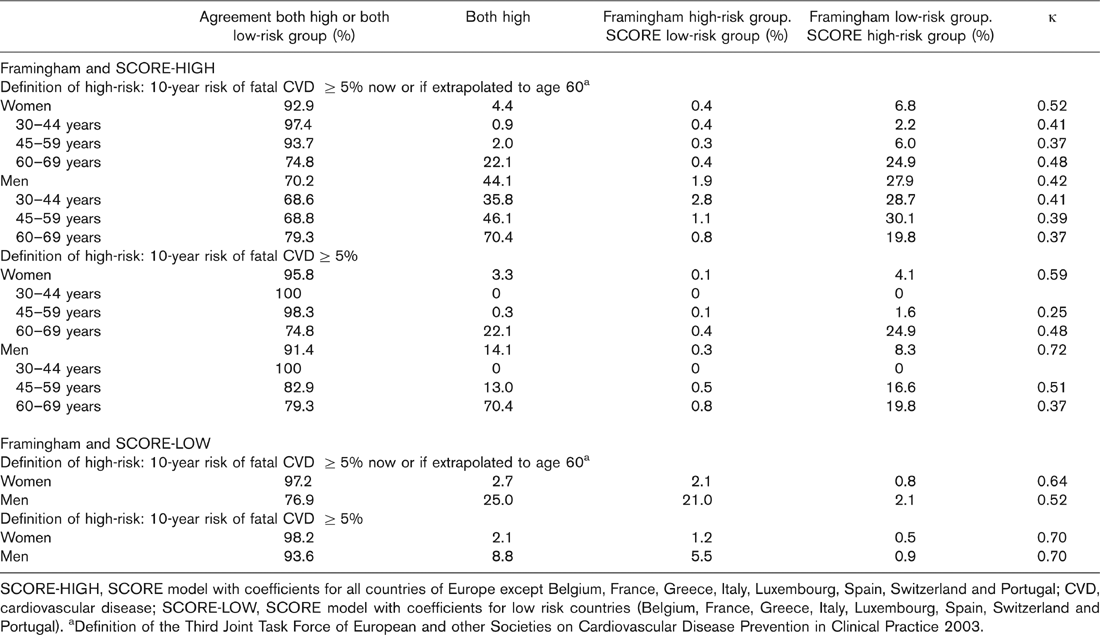
SCORE-HIGH, SCORE model with coefficients for all countries of Europe except Belgium, France, Greece, Italy, Luxembourg, Spain, Switzerland and Portugal; CVD, cardiovascular disease; SCORE-LOW, SCORE model with coefficients for low risk countries (Belgium, France, Greece, Italy, Luxembourg, Spain, Switzerland and Portugal). aDefinition of the Third Joint Task Force of European and other Societies on Cardiovascular Disease Prevention in Clinical Practice 2003.
But can the results of the German validation study of the Framingham Anderson model be generalized to our general population sample? Both the MONICA Augsburg and the PROCAM cohort are not representative of the general population in Germany: PROCAM is an occupational cohort [19], and like other occupational cohorts is likely to have lower cardiovascular risk than the general population [33], and MONICA Augsburg is situated in Bavaria, which has a lower cardiovascular mortality rate than other parts of Germany [34–36]. Nevertheless, it seems unlikely that the 50% overestimation of risk by Framingham in PROCAM and MONICA Augsburg was entirely due to this selection bias, especially since the overall evidence points towards overestimation of risk by Framingham both in low-risk and in high-risk European populations.
In the NHIES sample on the other hand, the impact of selection bias also needs to be considered. There were rather small differences in response by age and sex-group (ranging from 60.6 to 65.5%) and they were compensated by the sample weights. Nevertheless, there may have been selection bias towards lower cardiovascular risk since short questionnaires showed slightly less smokers among responders (26.6 versus 28.0%) and more men and women with good or very good self-rated health (66.3 versus 62.3%) [23]. This, however, only strengthens the assumption that Framingham overestimates risk in our study sample. In addition, disagreement between the two models occurred at all levels of predicted risk and therefore selection bias in the survey sample is unlikely to explain our results.
The next important question is whether a comparison with national mortality statistics is appropriate. There is, on the one hand, some concern over the validity of national mortality statistics [37–40], as suggested by lower official CHD mortality in most countries than the CHD mortality found in the MONICA study [41]. The German MONICA sample points, however, were not among the MONICA centres with the highest discrepancies. Furthermore, it is not clear whether the finding of underestimation of CHD deaths in routine mortality statistics can be automatically extended to cardiovascular mortality as defined in the SCORE project. A recent large study on the validity of national mortality statistics in Germany for example, showed underestimation of coronary heart disease and cerebrovascular disease, but overestimation of mortality from the overall group of diseases of the circulatory system [42].
More importantly, however, national mortality statistics reflect the CVD mortality of the entire population and a direct comparison with our study sample seems inappropriate since mortality statistics include individuals who have a history of CVD; asymptomatic individuals with markedly elevated risk factors; and institutionalized individuals, who have an increased mortality risk but whom we excluded from our sample. Therefore, we would expect an accurate model to predict a lower CVD mortality risk in our study sample than national mortality statistics [42]. Contrary to our expectations, however, SCORE-HIGH predicted even more fatal CVD and CHD events than national mortality statistics (87 versus 77, and 61 versus 51), suggesting overestimation of risk by SCORE-HIGH. Both Framingham and SCORE-LOW estimates are lower than the expected risk from national mortality statistics, but this difference cannot be interpreted in terms of the accuracy of either.
The predicted overall level of risk, however, is not the only measure of model performance of interest, especially since the SCORE model has been primarily presented as a tool for risk stratification, and not as a tool for mortality prognoses or economic evaluations. In fact, risk prediction functions have been shown to have variable predictive accuracy across the range of possible predicted risks [14,21]. Overall discriminative performance, as well as discriminative performance and accurate estimation of the level of risk in a more narrow range of risk judged relevant for clinical decisions, is therefore more important in the context of a prevention guideline than predictive accuracy over the whole range of possible predicted risks.
In our sample, there was a moderate agreement between Framingham and SCORE-HIGH of risk ordered into risk deciles (≤ 0.56 for men and 0.44 for women) and we have found that most men and women who were not ordered into the same risk decile were at least ordered into adjacent risk deciles. Of note, this is the agreement of two models which in their respective derivation cohorts had good but not perfect discriminative ability (ROC analyses with c-statistic values of 0.81 for SCORE-HIGH, 0.74 for SCORE-LOW [21] and ranging from 0.78 to 0.83 for Framingham functions) [5,43]. An area under the curve c-statistic of 0.5 signifies discrimination no better than chance, while an area of 1.0 indicates perfect classification. Moreover, as one would expect, discriminative ability in external populations was somewhat lower for both SCORE and Framingham [9,11,16,18,21].
On the other hand, for the guidance of treatment decisions, disagreement is more pertinent when it occurs near the cut-off point chosen to define ‘high risk'. Here too, we have found only moderate agreement between SCORE and Framingham. This will not per se pose a problem in clinical practice, since the Framingham-Anderson model for prediction of CVD death, unlike the variants for CHD and total CVD prediction, is not recommended by guidelines or expert committees and in particular there are no easy to use charts or scores available which implemented this model. Models can only be compared, however, if they predict the same endpoints; and a comparison of SCORE, which is not only a new model but also has been immediately included in the new European guidelines, with a model on which we have some prior knowledge, seems useful.
The sensitivity of agreement on the high-risk status to extrapolation to age 60 years also deserves consideration. More and more guidelines advocate extrapolation to age 60 years as a tool of risk communication for young adults who still have a low absolute risk but already an unhealthy risk profile [6,7,20]. If treatment decisions are based on such extrapolations, more emphasis should be laid specifically on the accuracy and discriminative ability of models above age 60.
The predictive accuracy of the SCORE model will be best evaluated by comparing expected with observed events. It will be harder, however, to conduct such external validations studies with SCORE than with previous cardiovascular risk estimation models since in order to validate fatal events larger cohorts with longer follow-up times are required. Additionally, a number of suitable cohort studies have already been included in the SCORE project.
In clinical practice, a difficult balance has to be struck between meticulous risk estimation on the one hand and awareness of the inherent imprecision of currently available estimation tools on the other. National or regional calibration of currently existing prediction models may reduce this imprecision, but should be accompanied by external validation in unselected general population samples and, preferably, by a comparison with the predictive accuracy of other commonly used cardiovascular risk prediction tools.
In addition, because of limited accuracy and considerable disagreement between currently available prediction models, there is an ongoing need for comprehensive, high-quality and timely regional European cohort data.
Footnotes
Acknowledgements
The authors gratefully acknowledge Dr Hildtraud Knopf for providing data on drug use for specific indications, Professor Hans-Werner Hense for valuable comments and Tony Fitzgerald for initial methodological discussions.