
Abstract
Background and purpose
Survey data quality is a combination of the representativeness of the sample, the accuracy and precision of measurements, data processing and management with several subcomponents in each. The purpose of this paper is to show how, in the final risk factor surveys of the WHO MONICA Project, information on data quality were obtained, quantified, and used in the analysis.
Methods and results
In the WHO MONICA (Multinational MONItoring of trends and determinants in CArdiovascular disease) Project, the information about the data quality components was documented in retrospective quality assessment reports. On the basis of the documented information and the survey data, the quality of each data component was assessed and summarized using quality scores. The quality scores were used in sensitivity testing of the results both by excluding populations with low quality scores and by weighting the data by its quality scores.
Conclusions
Detailed documentation of all survey procedures with standardized protocols, training, and quality control are steps towards optimizing data quality. Quantifying data quality is a further step. Methods used in the WHO MONICA Project could be adopted to improve quality in other health surveys.
Introduction
Biemer and Lyberg [1] have defined survey data quality as a function of the amount of error in the data. The total survey error can be divided into sampling and non-sampling errors. Sampling error is related to the coverage of the sample and non-sampling error to the errors in specification, sampling frame, non-response, measurement, and the processing of data.
Specification error occurs when the data collection method does not supply proper data on the concept of interest [1]. For example, the concept of interest being the prevalence of aspirin use for the prevention of heart disease, and the question used to obtain this information ‘Are you taking aspirin regularly?’ produces specification error because the purpose of aspirin use is not specified to limit the question to the prevention of heart disease.
Sampling frame error comes from the use of an inaccurate sampling frame that includes foreign elements, excludes elements of the target population or duplicates some elements unintentionally [1]. For example, a sampling frame based on houses may include buildings that have been destroyed or exclude new ones that have been erected since the frame was established.
Non-response error arises when individuals do not participate in the survey at all or when they participate in the survey but leave some questions unanswered, give incomplete answers to the open questions or do not take part in the physical examinations [1].
Measurement error is related to the actual collection of data from respondents. Respondents may either intentionally or as a result of the difficulty of the question give wrong information. For example, a woman may report incorrectly that she is not smoking regularly because of the social non-acceptance of female smoking. In the case of physical measurements, the device used may not be properly calibrated and may therefore give erroneous results or the staff member using the device is not properly trained and measurement error arises through the faulty use of the device.
Processing error is related to the final stage of data collection when data are keyed in, coded and edited [1]. A typical processing error happens when paper questionnaires are transcribed into an electronic format and the data coder accidentally hits the wrong key and therefore records the wrong answer.
Data quality is important in every survey because it may affect the validity and reliability of the results.
The WHO MONICA (Multinational MONItoring of trends and determinants in CArdiovascular disease) Project was a multinational collaboration of over 30 populations [2]. Survey data quality was recognized to be important for the reliable interpretation of the results. In MONICA, standardized protocol, training, and quality control were adopted to ensure the highest quality of the results. Quality control also included a retrospective assessment of the quality achieved. Part of the quality assessment was a quality score.
This paper describes the method developed in the WHO MONICA Project to quantify the data quality, and ways to use this information in the analysis. Furthermore, the potential effects of the data quality on the cross-sectional results are explored.
WHO MONICA Project
In the WHO MONICA Project, surveys in 38 populations were carried out [2]. These surveys measured the classical cardiovascular disease risk factors. The surveys covered target populations aged 35–64 years. In this study, data from the final risk factor survey were used.
In MONICA, an extensive amount of work was put into the documentation of the survey procedures used and evaluation of the data quality. The local survey organizers filled in detailed survey procedure questionnaires, describing the sampling frame(s), sampling methods, measurement devices and procedures, and the training of the personnel. Furthermore, the original and English translations of the locally used questionnaires were collected for the assessment of comparability with the recommended questions. The WHO Lipid Reference Centre in Prague conducted the external quality control of the lipid laboratories.
MONICA had a standardized protocol for collecting the risk factor survey data [3], and the data went through systematic error checking and detailed retrospective quality control. The results of this quality control and the documentation of the procedures used are reported in a series of MONICA quality assessment reports, which are published on the Internet at http://www.ktl.fi/publications/monica/index.html.
Quality scores
In the quality assessment reports, the age of the participants, the survey period, sampling frames, and each of the risk factors was assessed separately for data quality. This quality checking included a detailed review and documentation of data collection methods and the availability and coding practices of data obtained. On the basis of this retrospective review, each data item was rated using a quality score.
The quality scores were assessed separately for each population and survey. Generally, the quality scores got values from zero to two. The quality score zero meant that there was major concern about the data quality, score one that there was some concern, and score two that there was no concern about the data quality.
Quality scores were not sex specific. As the same measurement protocols, questionnaires and equipment were used and same measurers did the measurements for men and women within a population, the data quality was considered to be the same.
It is often difficult to determine the true quality of data, but there are indicators in which potential problems should be reflected. The quality scores used these indicators to quantify different quality components of the data items based on predefined criteria. Detailed descriptions of quality scores for different data items are available in the relevant quality assessment reports (http://www.ktl.fi/publications/monica/index.html).
Sampling frames and eligibility
From sampling frames, the type and time from the last update and the number of individuals who were ineligible for the sample or could not be contacted was documented. The quality score for the sampling frame was calculated on the basis of the proportion of ineligibles and the proportion of individuals who could not be contacted [4].
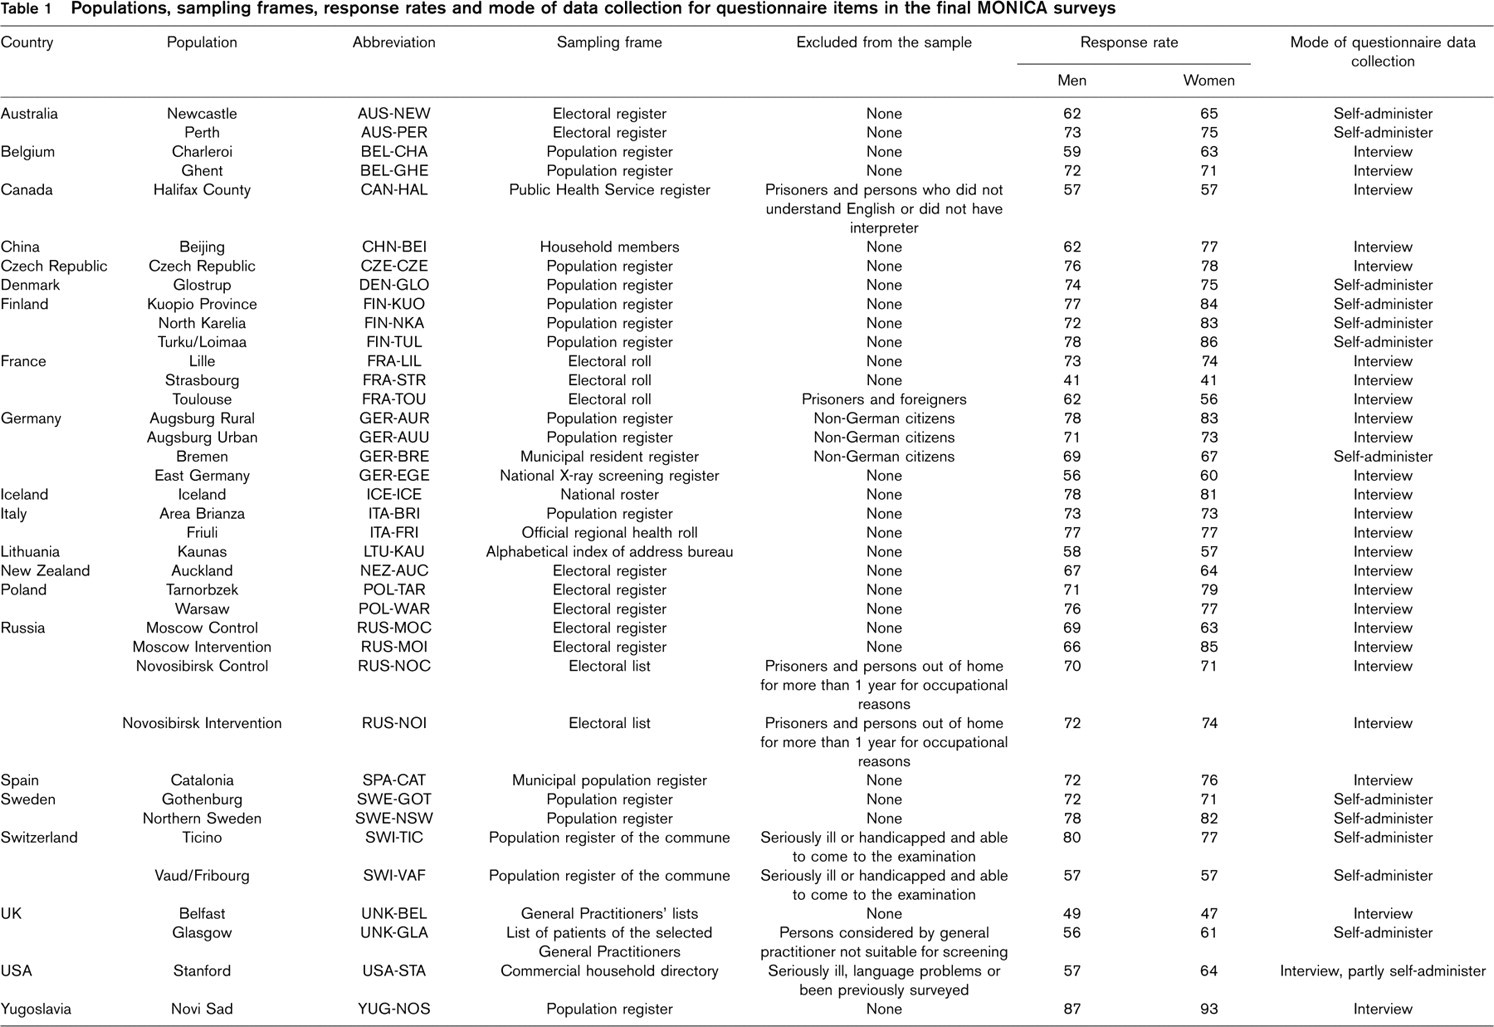
Several different sampling frames were used as a result of varying availability in different countries (Table 1). The most commonly used sampling frames were population registers (national and local) and electoral registers. Moreover, different kinds of lists from healthcare professionals and household lists were used as sampling frames [4].
The MONICA definition of ineligibility for the survey was ‘The individuals selected in the original sample who died or moved out of the reporting unit area before the survey examination are called non-eligibles’ [5]. In most populations, this definition was used. However, departures from the protocol occurred in 11 populations (Table 1). The definition of ineligibility varied from prisoners, seriously ill or handicapped individuals to non-citizens and individuals who could not cope with the language [4].
The majority (20 out of 38) of the sampling frames received a quality score of two and most of the others (15 out of 38) received a quality score of one. A quality score of two was mainly assigned to population registers and few electoral registers in countries where registration to vote is compulsory [4]. The main reason for not getting a good quality score was a high proportion of ineligible individuals in the sample, indicating that the sampling frame was not up to date.
Response rate
For each individual selected for the original sample, information about the eligibility was recorded as well as the participation status. For non-respondents the reason for non-response was recorded in categories: not possible to contact, temporarily away, medical reason, not interested and other refusal [4].
In MONICA, two different response rates were calculated [4]. The commonly used response rate was the number of respondents divided by the number of eligible individuals in the selected sample (reported in Table 1). The other response rate adjusted for the proportion of non-respondents that could not be contacted, was defined as

In populations in which the proportion of individuals who could not be contacted among non-respondents was low, the two response rates were equal or differed only by one or two percentage points. The difference between two response rates was much bigger (over 10 percentage points) in a few populations in which the proportion of individuals who could not be contacted was approximately 50% [4].
Response rates in most populations were higher in women than in men. In men, the response rates varied from 41 to 87% and were above 70% in 21 populations. In women, the response rates varied from 41 to 93% and were above 70% in 24 populations (Table 1).
Questionnaire items
The MONICA Manual [5] specified the set of questions to be used in the surveys. This set formed the core survey data, which was expected to be available from each MONICA population and survey. Local survey organizers made the final decision about the locally used questions, often to compromise between MONICA requirements and continuity with earlier surveys in the country. Therefore, in some cases the locally used questions differed from those recommended in the MONICA Manual, and in all cases the locally used questionnaire included many additional questions. All the deviations of the local questions from the recommended ones were documented and the coding practices for each question were examined [6].
For the questionnaire items, the quality score in general has two components: the comparability of locally used questions with the questions recommended to be used in MONICA, and the availability of data for each question, which could be different from the overall response rate.
For example, the quality score for the questionnaire item on awareness of high cholesterol was derived from the components of comparability of the questionnaire and the availability of data in respondents [7]. The comparability of the questionnaire was rated as two if the local question was same as the MONICA question, one if the local question differed from the MONICA question but data could be extracted without significant difference, and zero if the local questionnaire did not have the question or it differed significantly from the MONICA question. The availability of data for the questionnaire item was rated as two if there was less than 5% missing information, one if the missing information was between 5 and 10%, and zero if there was more than 10% missing information. The quality score was zero if the comparability of the questionnaire or the availability of data was rated as zero, one if the comparability of the questionnaire and the availability of data were not rated as zero but both of them were rated as one, and two if the comparability of the questionnaire and the availability of data were not rated as zero and at least one of them was rated as two.
In general, the comparability of local and MONICA questions was good for all questionnaire items and the proportion of missing information among respondents was low. More details about the results are given in the relevant quality assessment reports [6].
Populations, sampling frames, response rates and mode of data collection for questionnaire items in the final MONICA surveys
Physical measurements
In the MONICA Manual [5], detailed measurement protocols for the physical measurements (blood pressure, cholesterol and anthropometric measurements) were specified, with recommendations on the measurement instruments. For each measurement, the locally used instruments and procedures were documented and assessed against the MONICA protocol [6]. In addition, information about the training and certification of staff doing the measurements was documented.
The structure of quality scores differed between the physical measurements. For blood pressure [8] and anthropometric measurements [9,10], information about the measurement instruments and the actual measurement results were used to evaluate the data quality. Several indicators relating to the measurement results, such as terminal digit preference, are indicators of data accuracy and reflect the quality of training but will not provide the information about actual measurement bias. For blood lipids [11,12], the information from the external laboratory quality control was used to evaluate the bias and variation of the lipid results.
In general, measurement protocols were followed in the surveys and the recommended instruments were used. More details are given in the relevant quality assessment reports [6].
Use of quality scores
To demonstrate the use of quality scores in statistical analysis for this paper, total cholesterol [11] and body mass index (BMI) [9] data were used. These two data items were selected as examples, because there was sufficient variation in data quality between populations to demonstrate the potential effect.
The mean total cholesterol (mmol/l) and mean BMI (kg/m2) were age-standardized according to the World Standard Populations [13].
To see whether data quality affected the population estimates, we tested if the mean total cholesterol and mean BMI differed between the populations with different data quality. The analysis of variance was used to study these differences.
For mean total cholesterol, the results are no different between populations with different data quality (Fig. 1) but for mean BMI, it appears that in populations with low data quality the mean BMI is lower than in populations with high data quality (Fig. 2). This result may be unduly influenced by the one population in which the data quality for BMI was rated as zero.
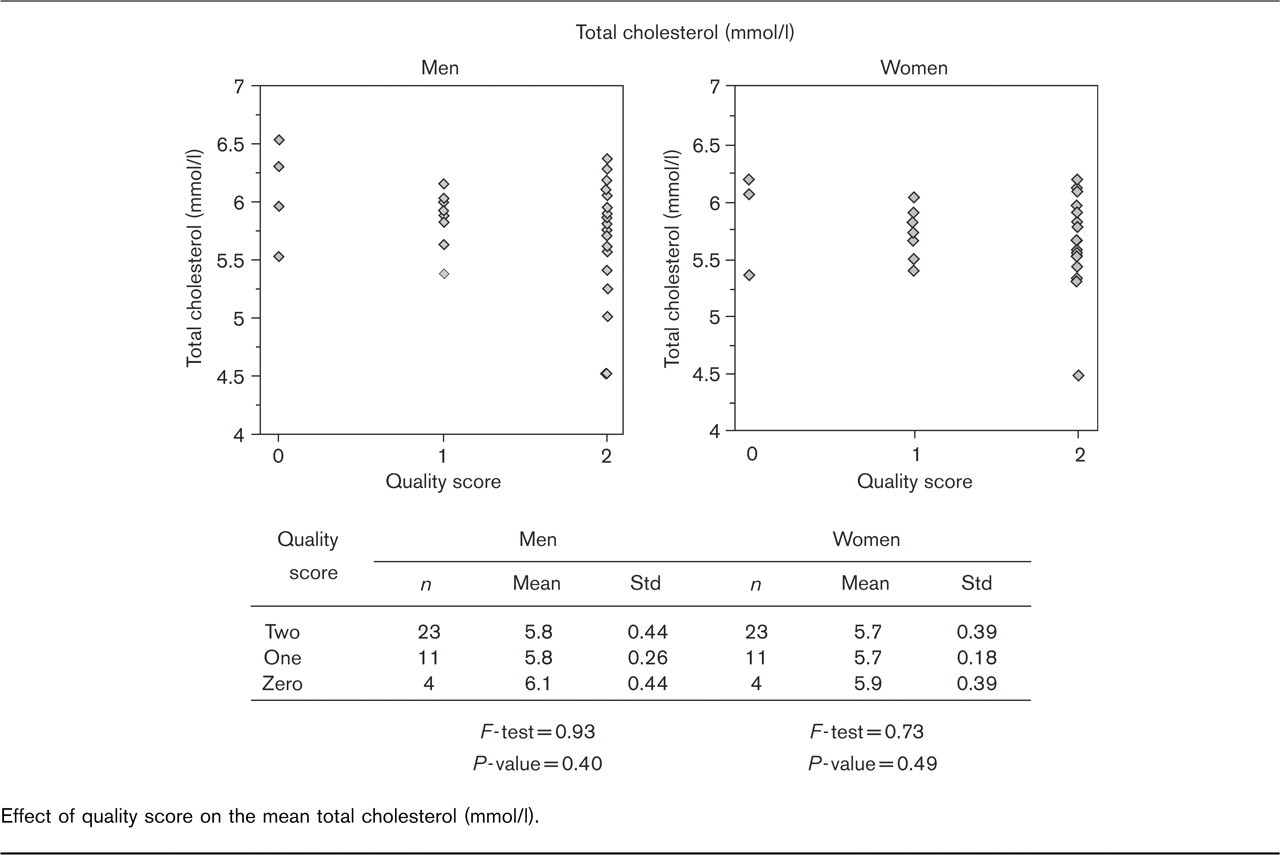
Effect of quality score on the mean total cholesterol (mmol/l).
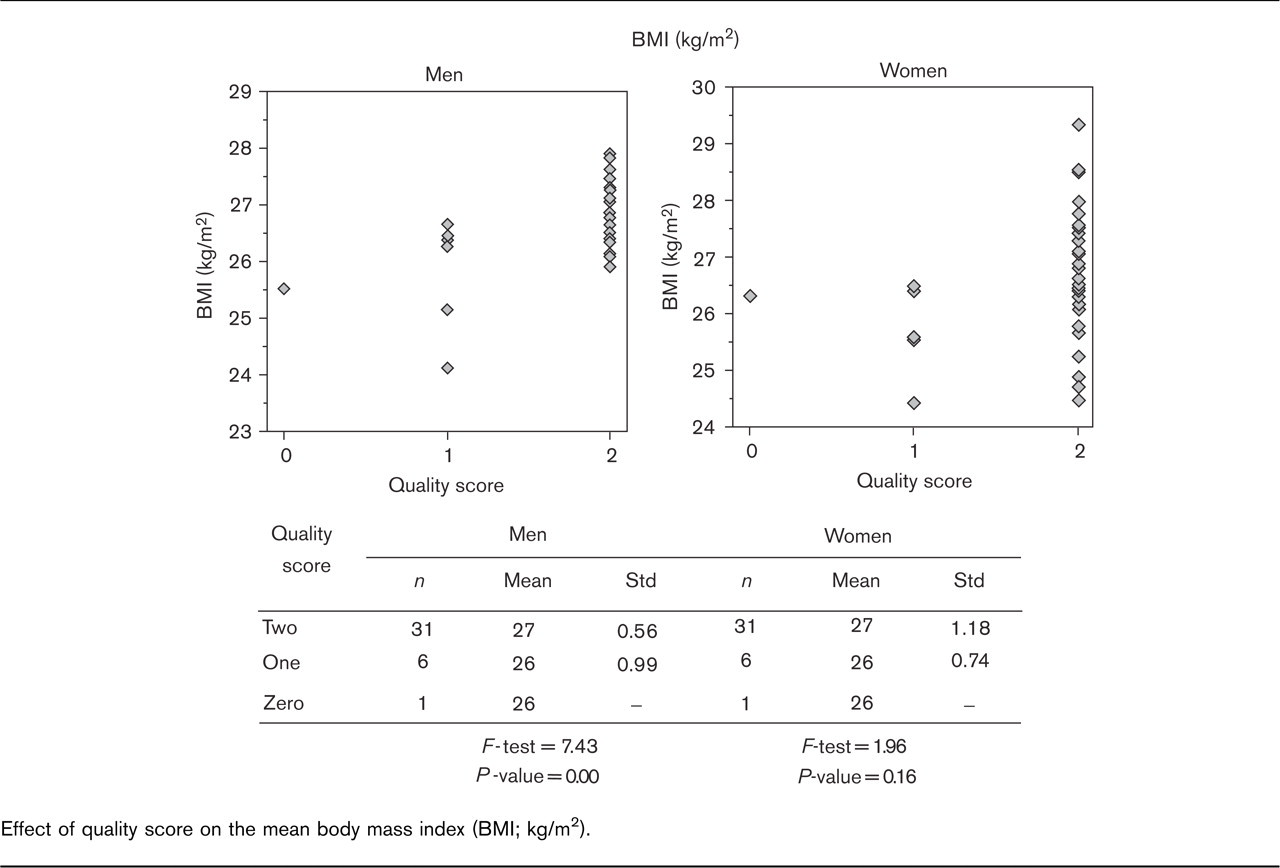
Effect of quality score on the mean body mass index (BMI; kg/m2).
The quality scores can be used both to identify the populations with quality problems in their data and then exclude those populations from the analysis, or as quality weights. To demonstrate the use of the quality scores in statistical analysis, the association between mean total cholesterol and mean BMI was studied using the Pearson correlation coefficient. The analyses were carried out in three different ways. At first, the analysis was done using all the available data regardless of the data quality. The second set of analyses excluded the populations with low data quality and the third set of analyses used quality scores as weights. The exclusion was done using six different exclusion criteria: total cholesterol quality score is zero; total cholesterol quality score is zero or one; BMI quality score is zero; BMI quality score is zero or one; the quality score for total cholesterol or BMI is zero; and the quality score for total cholesterol or BMI is zero or one.
For the weighted analysis, weights for each data item were derived from the relevant quality score by adding 0.2 to each quality score and then dividing it by 1.1. This allows a small weight for the populations with a quality score of zero. The weights for the combination of two data items were defined as the mean of the weights for individual data items. The weighted correlation coefficient between the total cholesterol and BMI was computed using the weights corresponding to total cholesterol, the weights corresponding to BMI, and the combined weights.
The weighted correlation coefficient was calculated as
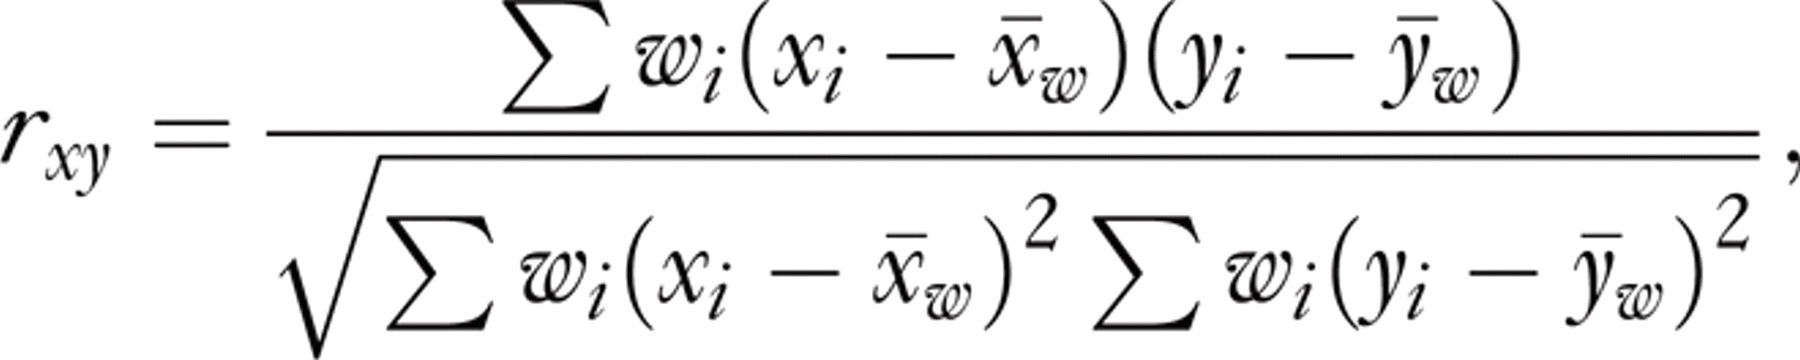
where w i is the weight, x i is the sample mean total cholesterol and y i is the sample mean BMI in population i and x w and y w were calculated as
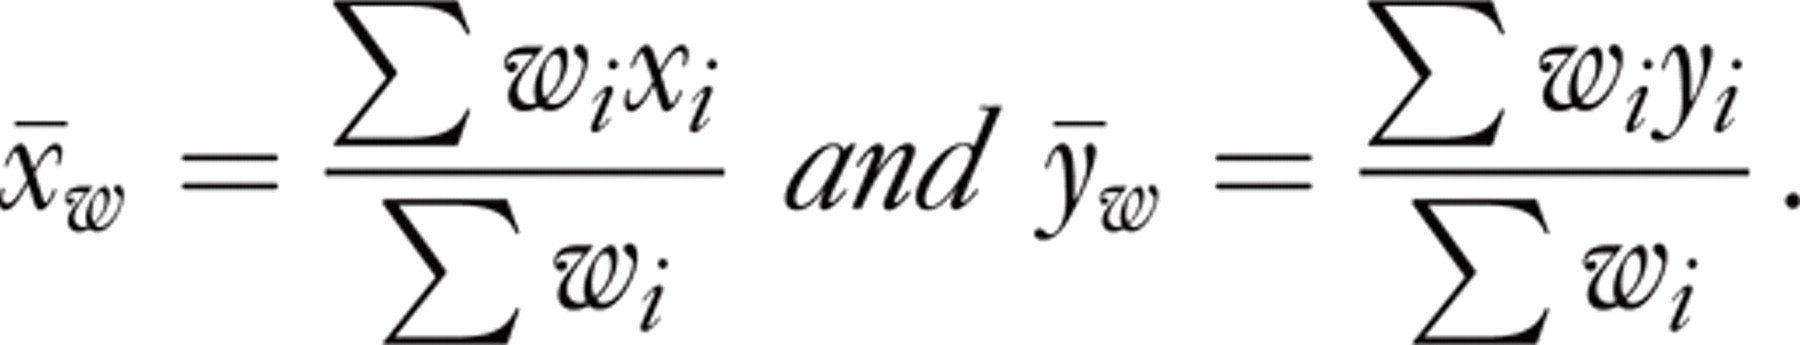
The correlation coefficient between total cholesterol and BMI, when the data quality was not taken into consideration, was 0.64 for men and 0.06 for women.

Body mass index (BMI; kg/m2) versus total cholesterol. Effect of data quality on the results. chol, total cholesterol.
When populations with low data quality were excluded from the analysis, the correlation changed markedly in both men and women. Excluding populations with a total cholesterol quality score of zero increased the correlation coefficient in both men and women. The same happened when populations with either total cholesterol or BMI with a quality score of zero were excluded. When one population with a BMI quality score of zero was excluded, the correlation coefficient remained the same in women and decreased slightly in men. If the exclusion criteria were also extended to populations with a quality score of one, the results changed more drastically. The biggest difference in results was seen when populations with a BMI quality score of zero or one were excluded from the analysis (seven populations). In this case the correlation coefficient decreased to 0.35 in men and changed to −0.19 in women (Fig. 3).
These observed changes in the correlation coefficient after the exclusion of the populations are caused by the fact that the populations with low quality scores for BMI were mainly populations with a relatively low mean BMI. Furthermore, populations with low quality scores for total cholesterol tended to have a higher than average mean total cholesterol, and therefore their contribution to the correlation coefficient was changed markedly.
When the analysis was done using quality weighting, all populations were included in the analysis. Weighting the analysis by the quality score of total cholesterol increased the correlation coefficient in both men and women. When the analysis was weighted by the quality of BMI, the correlation coefficients decreased, and in women the correlation changed the direction. Weighting of the analysis by the combination of the quality of total cholesterol and BMI data did not change the results markedly (Fig. 3).
Discussion
In general, data quality is understood to be good coverage, with a high response rate, and measurements are without known measurement error. In the WHO MONICA Project, all the components of data quality were considered, documented, and assessed. The quality of each data item was assessed in detail in the quality assessment report and quantified using the quality scores.
A good sampling frame lists everyone in the target population only once and does not include any foreign elements, such as individuals who have died or moved away. Sampling frames are known to differ from each other by their nature and frequency of updating.
Population registers in general are regularly maintained and therefore are kept well up to date [14], whereas the census lists have good coverage of the population at the time the census is conducted but it soon gets out of date if no regular updating is done [15]. General practitioners’ (GP) lists tended to be out of date, especially for elderly individuals [16,17] during the time when MONICA surveys were carried out. Since then, the coverage of GP lists has improved. Electoral lists may suffer from long intervals between updates and they generally only cover citizens [15,16,18].
In MONICA, the majority of populations used population registers as sampling frames, which provide good coverage of the target population and therefore reduce sampling frame error. In those populations in which either GP lists or electoral registers were used as sampling frames, the coverage of the sampling frame is of concern.
If the target population is all residents aged 35–64 years, as in MONICA, then the exclusion of some population subgroups is a part of a sampling frame error. In most MONICA populations, this was not a problem. In a few populations in which certain subgroups were excluded from the sample, some bias may have occurred. The fraction of prisoners in the population is quite small and should not bias the population estimates, but excluding foreigners and non-citizens is a bigger problem. Foreigners and non-citizens form a big part of the population in many countries, and their health behaviours and profiles may differ considerably from citizens of the country. Also excluding individuals who are seriously ill or handicapped may bias the population estimates if their proportion in the population is high.
Low response rates alone are not enough to cause non-response bias in the population estimates if respondents and non-respondents behave similarly. Then only the precision of estimates is affected [19]. In many cases, the socio-economic, health and risk profiles of respondents and non-respondents differ, and therefore the estimates based only on respondents are biased [20–24]. As in MONICA, response rates varied considerably between populations, the possible non-response bias should be taken into account when interpreting the survey results.
Even though in MONICA the same quality scores were assigned for men and women, it should be questioned in other surveys as to whether this is the best approach. It is known that some measurements are more difficult for women than for men, for example the measurement of waist circumference in a first trimester pregnant women. Furthermore, the coverage of the sampling frame may vary between subgroups causing different sampling frame quality for them.
In MONICA, quality scores were used in two ways: excluding the populations with low data quality from the descriptive analysis and by weighting the analysis for the data quality in the analytical analysis [25,26]. Usually, the exclusion from the analysis was done if the data quality score was zero or alternatively if the response rate was below a certain limit. Commonly used cutpoints for the response rate were 50 or 60%.
As our results show, data quality is an important component of reliable survey results. The results may change significantly when data quality information is incorporated into the analysis. In our example, the correlation coefficient varied from 0.35 to 0.72 in men, and from −0.19 to 0.22 in women, depending on the way the analysis was adjusted for data quality. A variation of this magnitude clearly indicates that the results are sensitive to the quality of total cholesterol and BMI data.
Even though the quality scores used to quantify the data quality are artificial quality indicators, they will provide valuable information about the potential quality problems of the data. Quality scores will not provide information about the actual magnitude of bias, but will point out populations or data items within populations in which some survey error may exist. This information is valuable, especially in multicentre studies, in which results between populations are compared.
Investigating the sensitivity of the results in relation to the data quality obtained will provide valuable information about the robustness of the results. When results change markedly after adjusting for data quality, it may, for example, indicate that as a result of quality problems, some measurements are systematically lower or higher than measurements without quality problems. As the data quality obtained can not be corrected after data collection has finished, it is important to report observed shortcomings and learn from them for the future.
Conclusion
The data quality is a combination of several factors: the representativeness of the sample, which includes issues such as sample selection, sampling frame and non-response, and the accuracy and precision of measurements, which includes the formulation and selection of questions, the selection of physical measurements, the selection and training of personnel and the mode of data collection. In addition to these, data processing will also affect data quality.
The WHO MONICA Project developed a system of quality scores to identify and quantify data quality in the international project in which results from over 30 populations were compared in both cross-sectional and trend settings. These quality scores are a simple way to assign a value for data quality, and they can also be used in the analysis as data quality indicators, either identifying populations with quality problems to be left out from the comparisons or by weighting the data by its quality.
Whenever reporting survey results, the impact of data quality should be investigated, acknowledged, and reported.
Disclaimer
This publication was approved by the MONICA centres whose data were used. However, the views expressed in this paper are those of the authors and may not reflect the views of individual WHO MONICA investigators.