
Abstract
Background
Coronary risk prediction ‘engines’ are now in common use, and their worth is well proven. There remains the question of how to deal with a prior diagnosis of diabetes.
Design
An individual participant meta-analysis of 33 cohort studies involving 364 566 subjects.
Methods
Fatal coronary hazard ratios for age, smoking, systolic blood pressure and cholesterol, were computed from Cox models, comparing those with and without diabetes. Three risk prediction equations were compared: a ‘stepped model', which included the risk factors and diabetes status; an ‘interaction model', which included interactions between diabetes and the risk factors; and a ‘fixed model', which fixed the 10-year rate of coronary death amongst those with diabetes to be 7%. These were compared through the area under the receiver operating characteristic curve (AUC) and Hosmer-Lemeshow statistics.
Results
The hazard ratio for age was greater for those without diabetes than those with, for men (P=0.005) and women (P=0.02); for men only, systolic blood pressure showed a similar differential (P=0.011). Nevertheless, AUCs were only 0.001 different for the stepped and interaction models for each sex. The AUC for the fixed model was lower and, unlike the other two, showed significant lack of fit for both sexes (P< 0.001).
Conclusions
There is no justification for developing separate risk prediction models for those with and without diabetes, nor for assuming that everyone with diabetes should be considered as being at a common high level of risk. Diabetes status might, instead, be used as a risk variable in an overall population equation.
Introduction
Risk prediction, often called ‘absolute risk’ prediction [1], is now a well-established tool for decision making in preventive cardiology. The Framingham risk prediction equations for coronary heart disease (CHD) (and sometimes other cardiovascular endpoints) have been formulated [2], reformulated [3], simplified through point scoring [4] and charts [5], recalibrated to other populations [6] and replaced by similar prediction engines developed in local populations [7,8].
Most of the coronary risk prediction tools in current use take account of a prior diagnosis of diabetes. One approach, here called the ‘stepped’ method, is to include a term for diabetes in the risk prediction algorithm [2], so that those with diabetes have a different (always higher) score than those without, when all other risk factors are kept at a constant level. Where risk points are given for each risk factor, and later summed, the total for someone with diabetes is always greater by the same amount as someone without diabetes but with identical values of other risk factors, regardless of the levels of these other risk factors (e.g. blood pressure) [3]. Another approach, the ‘interaction’ method, computes separate risk predictions for those with and without diabetes [9,10]. This method treats those with and without diabetes as totally independent, such that the information on how other risk factors relate to coronary risk in one group is not used to inform the risk prediction for the other group. This approach has limited statistical power for the diabetes group, as it will typically be small in general populations. Some studies have addressed this shortfall by using data from patients with diabetes [11–13]. This approach is only able to derive, and test, algorithms for those with diabetes, however, and cannot directly compare risk predictions for those with and without the condition. Finally, a third approach, the ‘fixed’ method, is that taken, for example, in two national treatment guidelines in the USA [14,15]: pre-existing diabetes is taken as risk-equivalent to pre-existing heart disease, thus implying that treatment to prevent CHD should be considered for all those with diabetes.
This paper uses the data from one of the largest overviews (meta-analyses) of cohort studies to compare the three approaches to coronary risk prediction, taking account of diabetes status and the other major cardiovascular risk factors. The best of these approaches is used to formulate a single coronary risk prediction model applicable to those with and without diabetes.
Methods
The Asia Pacific Cohort Studies Collaboration (APCSC) is an overview of cohort studies carried out in the region which satisfy certain inclusion criteria (age and blood pressure recorded at baseline; vital status recorded at the end of follow-up; total follow-up of at least 5000 person-years) and exclusion criteria (entry not dependent upon having a particular condition or risk factor) and whose investigators were willing to provide individual participant data [16]. Coronary deaths were all deaths with the underlying cause coded according to the ninth revision of the International Classification of Diseases as 410-414. Analyses were restricted to individuals aged 20 years or more at the time of the baseline survey for whom diabetes status was recorded, based on an individual's self-report of a previous diagnosis of diabetes. Additionally, for studies that measured glucose, diabetes status was positive if fasting glucose was greater than 6.1 mmol/l for serum samples, and greater than 7 mmol/l for plasma samples, or if non-fasting glucose was greater than 10 mmol/l for serum samples, and greater than 11.1 mmol/l for plasma samples [17].
Survival analyses
Separately for men and women, Cox survival models, stratified by study [18], were used to estimate hazard ratios for coronary death according to age, systolic blood pressure (SBP), total cholesterol (TC) and smoking (current smoker/not), for those with and without diabetes. These variables were chosen since they appear in all the current cardiovascular or coronary risk prediction algorithms. Age, SBP and TC were taken as continuous variables, so as to increase power and since previous analyses have shown these variables to have a log-linear relationship with coronary outcomes in APCSC [19–21]. Results for SBP and TC are reported after adjustment for regression dilution [18], whilst all hazard ratios were adjusted for age (except where age is the variable of interest). The homogeneity of the effect of each risk factor across diabetes status was tested by adding an interaction term to the Cox model.
Risk prediction
Most risk prediction models look at 10-year risk. Few studies in APCSC, however, have follow-ups of this length. Thus, in order to maximize study inclusion, but yet provide a reasonable length of follow-up over which to estimate risk, 8-year predictions were made. Thus, individuals were right-censored to 8 years and, to avoid bias due to a large number of participants having dropped out, analyses were restricted to studies with a 75th percentile of follow-up equal to at least 8 years. Participants with missing information on any of the risk factors of interest were excluded.
Three logistic regression models were fitted, for each sex. The ‘stepped model’ included age, age squared, SBP, TC, smoking, diabetes and study. Age squared was included for completeness, since it features in the Framingham risk prediction models [2–4]. For both men and women, a stepped risk prediction model for coronary death was formed using the beta coefficients (log odds ratios, not corrected for regression dilution) from the stepped logistic model [4]. The discrimination of this prediction model was evaluated using receiver operating characteristic (ROC) curves and calibration with observed outcomes was evaluated using Hosmer-Lemeshow tests [22].
The ‘interaction model’ added interactions between diabetes and age, SBP, TC and smoking for each sex, unless lack of numbers suggested that estimation of any of the interactions was unreliable. An interaction risk prediction model was formed, for each sex, from the beta coefficients derived from this model. Finally, a ‘fixed model’ was formed, for each sex. For those with diabetes, this model assumes a fixed rate of death from coronary disease at a level that would normally lead to treatment. US guidelines for lipid-lowering therapy [14] define those at highest risk as having an estimated 10-year probability of fatal or non-fatal coronary heart disease of greater than 20%. Assuming a ratio of fatal-to-nonfatal coronary events of approximately 1 : 2, this suggests that those with a 10-year rate of fatal CHD of about 7% should be treated. Thus, the fixed model assumes a probability of 0.7% per annum for coronary death for those with diabetes. In sensitivity analyses, this percentage was varied from 0.1 to 2.1%. For those without diabetes the probabilities found from the stepped model were used. The interaction and fixed models were evaluated as for the stepped model, with which each was compared. The percentage of overall bias in predicted CHD rates with the fixed model was calculated as 100 times (observed rate minus predicted rate) divided by the observed rate, for men and women separately.
Results
From a total study size of just under 600 000 in APCSC, 364 566 (61%) individuals had age, SBP and diabetes status or fasting blood glucose recorded at baseline (Table 1). Overall 6% of participants had diabetes and 41% were female. Over an average of 4 years follow-up, 2265 (0.6%) died from coronary heart disease. Amongst men, there were 198 coronary deaths amongst those with diabetes (1.1%) and 1379 (0.7%) amongst those without. Corresponding results for women were 67 (1.2%) and 621 (0.4%).
In both sexes, there were significant differences (P≤0.001) between those with and without diabetes for all the other risk factors considered (Table 2). In every case, except smoking amongst women (where prevalence was low), those with diabetes had higher values.
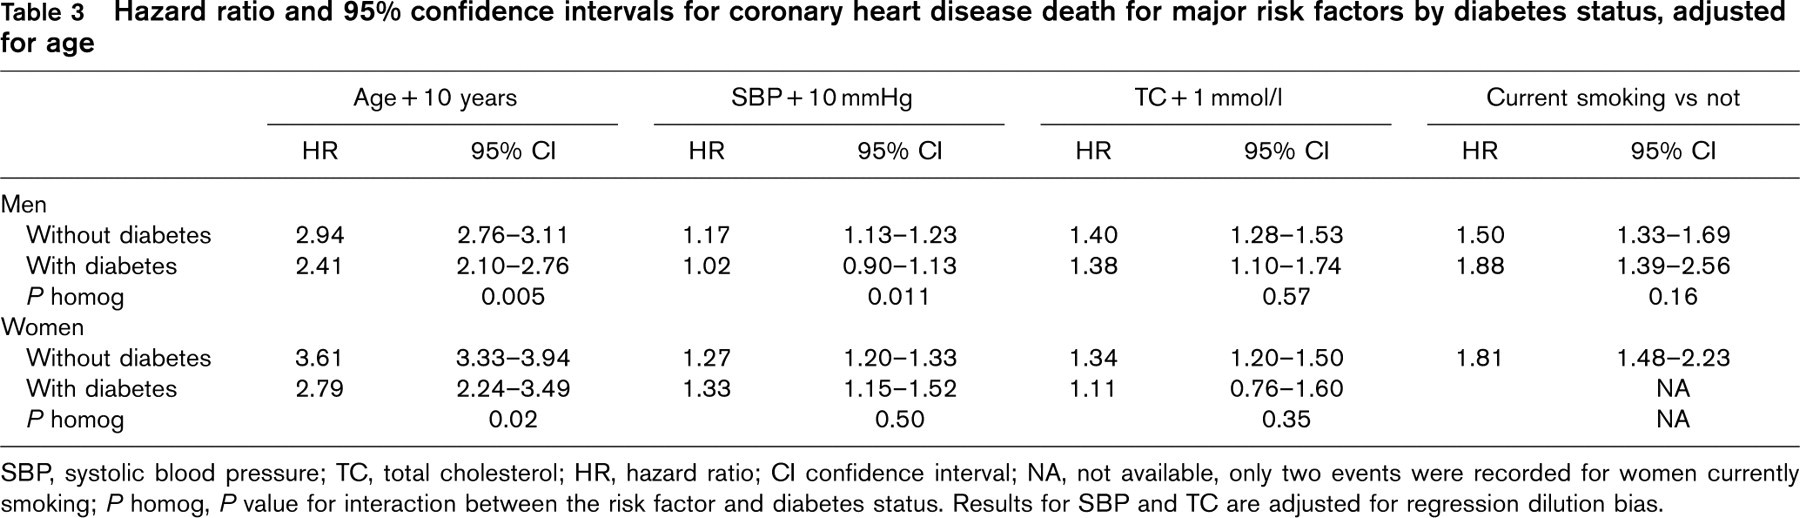
The age-adjusted hazard ratio for coronary death, comparing those with diabetes and those without was 1.83 (1.57-2.14) in men and 2.25 (1.73-2.93) in women. Table 3 shows the hazard ratios for other risk factors, both for those with and without diabetes. Results are shown separately by sex, except that there were too few deaths amongst women who both smoked and had diabetes to allow reliable estimation. For men, the effects of age and SBP were significantly (P < 0.05) stronger amongst those without, compared with those with, diabetes. For women, a similarly significant difference by age was observed, but SBP was not significantly different by diabetes status. The effects of TC were not significantly different between those with and without diabetes for either sex; the same was true for smoking amongst men.
Figure 1 compares risk prediction for the three models considered, for each sex. In these analyses data from 43 079 men (436 CHD deaths overall, of which 50 were for those with diabetes) and 48 729 women (182 CHD deaths; 22 with diabetes) were used. Since no reliable estimation was available, the interaction effect for smoking was left out of the interaction model for women. Despite the finding of some significant interactions in Table 3, the stepped and interaction models gave very similar results for both sexes. AUCs were 0.83, to two decimal places, for men and 0.89 for women. Hosmer-Lemeshow tests showed no significant lack of fit, comparing observed and predicted death rates, there being slight underestimation amongst those in the highest decile of predicted risk. The fixed model discriminated between those who did and did not die from CHD almost as well, with an AUC of 0.82 for men and 0.88 for women. It did not, however, calibrate as well with observed data compared with the other models. There was significant (P < 0.001) lack of fit for both sexes, with considerable overestimation of risk amongst those with the highest 10% of predicted risk. For each sex, when percentages other than 0.7% for 10-year risk of fatal CHD for those with diabetes were used in the fixed model, the AUC never approached that of the stepped model.
Baseline summary statistics and details of studies
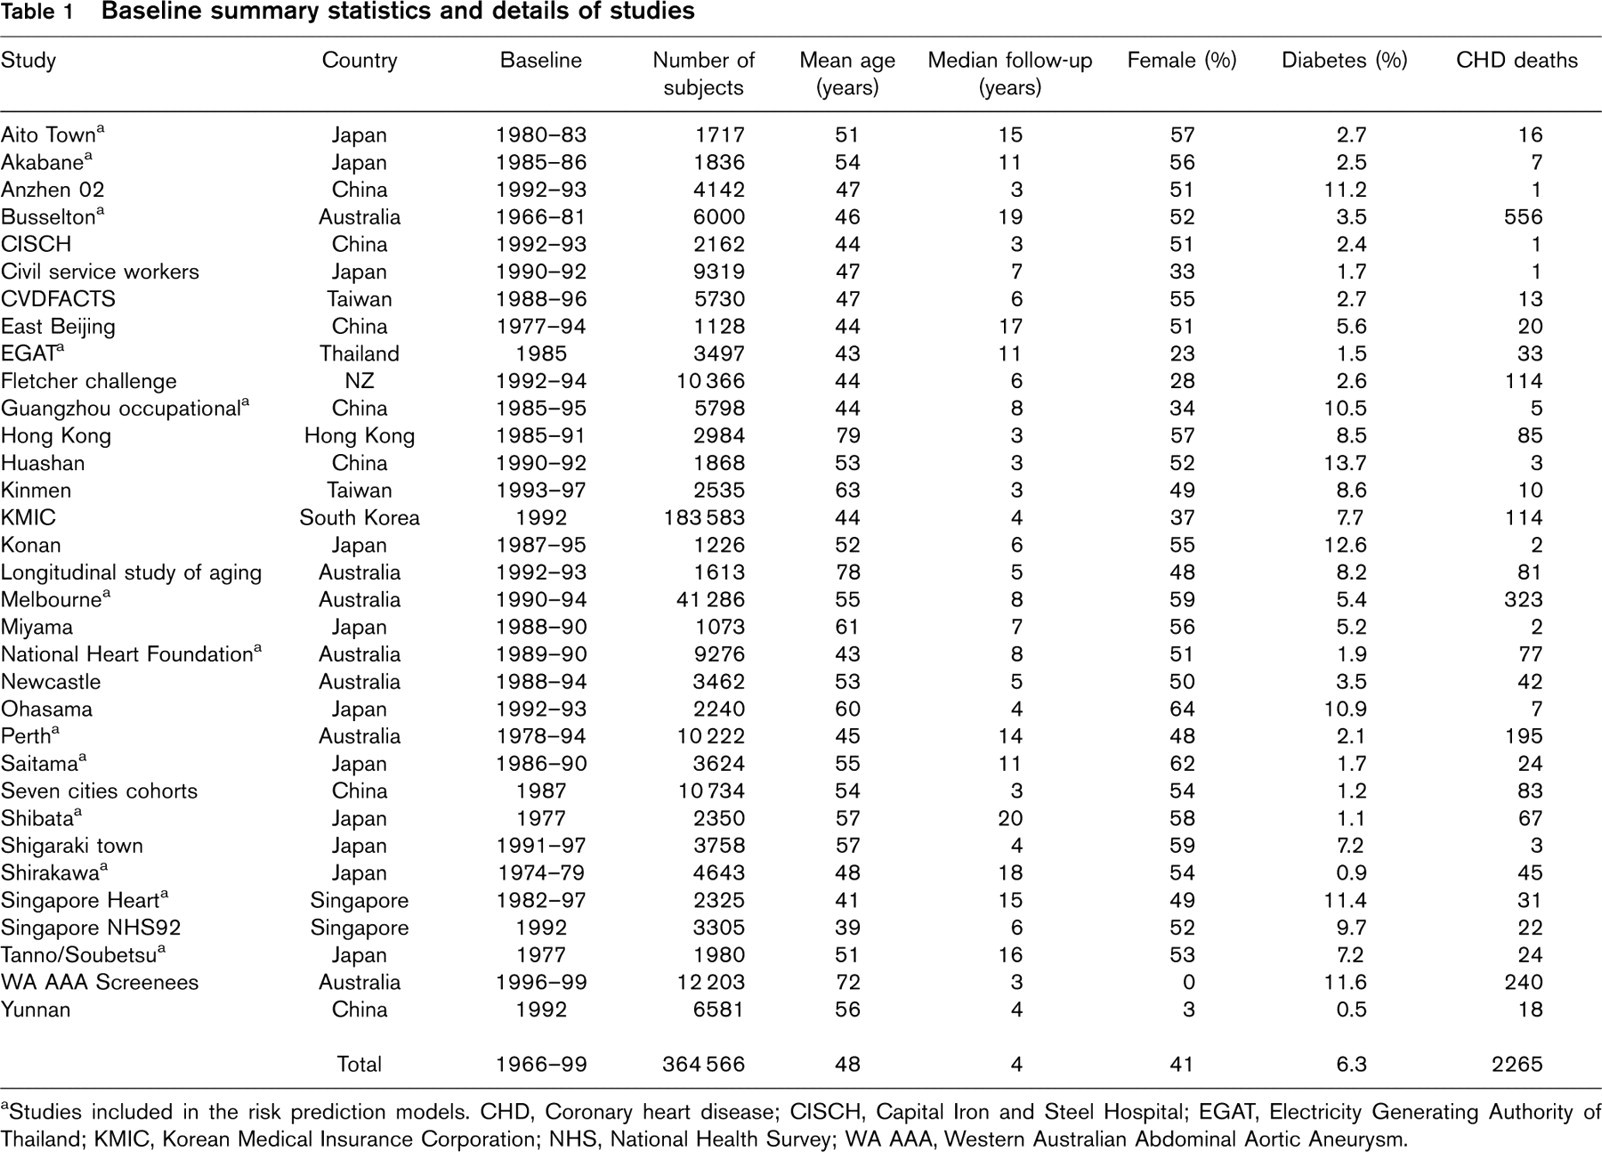
Studies included in the risk prediction models. CHD, Coronary heart disease; CISCH, Capital Iron and Steel Hospital; EGAT, Electricity Generating Authority of Thailand; KMIC, Korean Medical Insurance Corporation; NHS, National Health Survey; WA AAA, Western Australian Abdominal Aortic Aneurysm.
Mean and 95% confidence intervals for major risk factors by diabetes status, adjusted for age
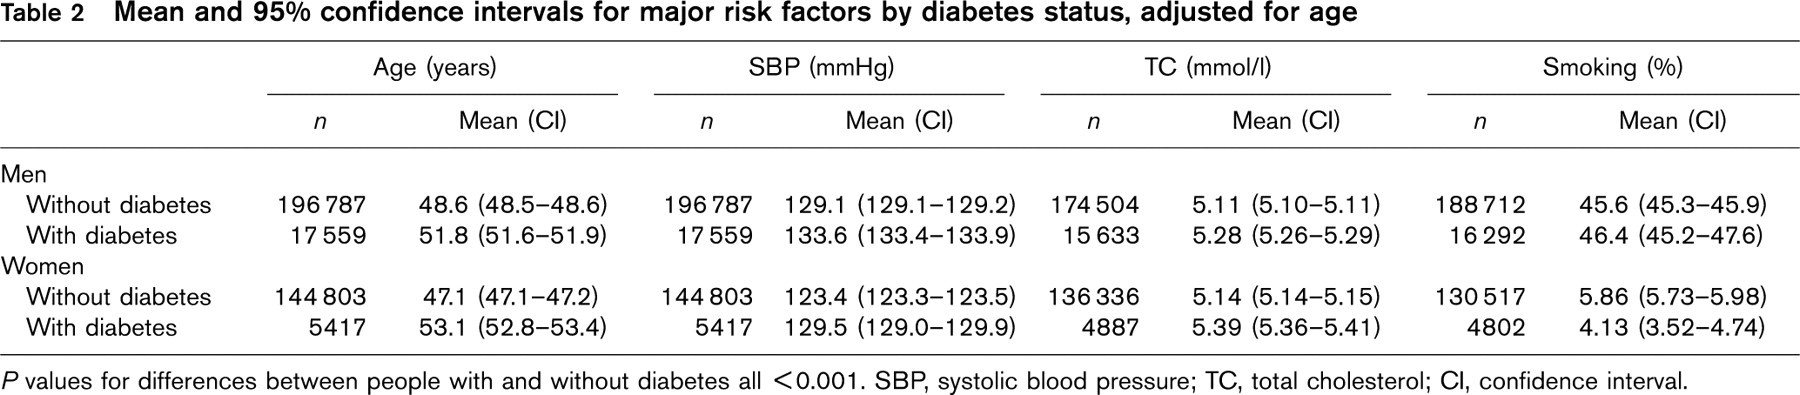
P values for differences between people with and without diabetes all < 0.001. SBP, systolic blood pressure; TC, total cholesterol; CI, confidence interval.
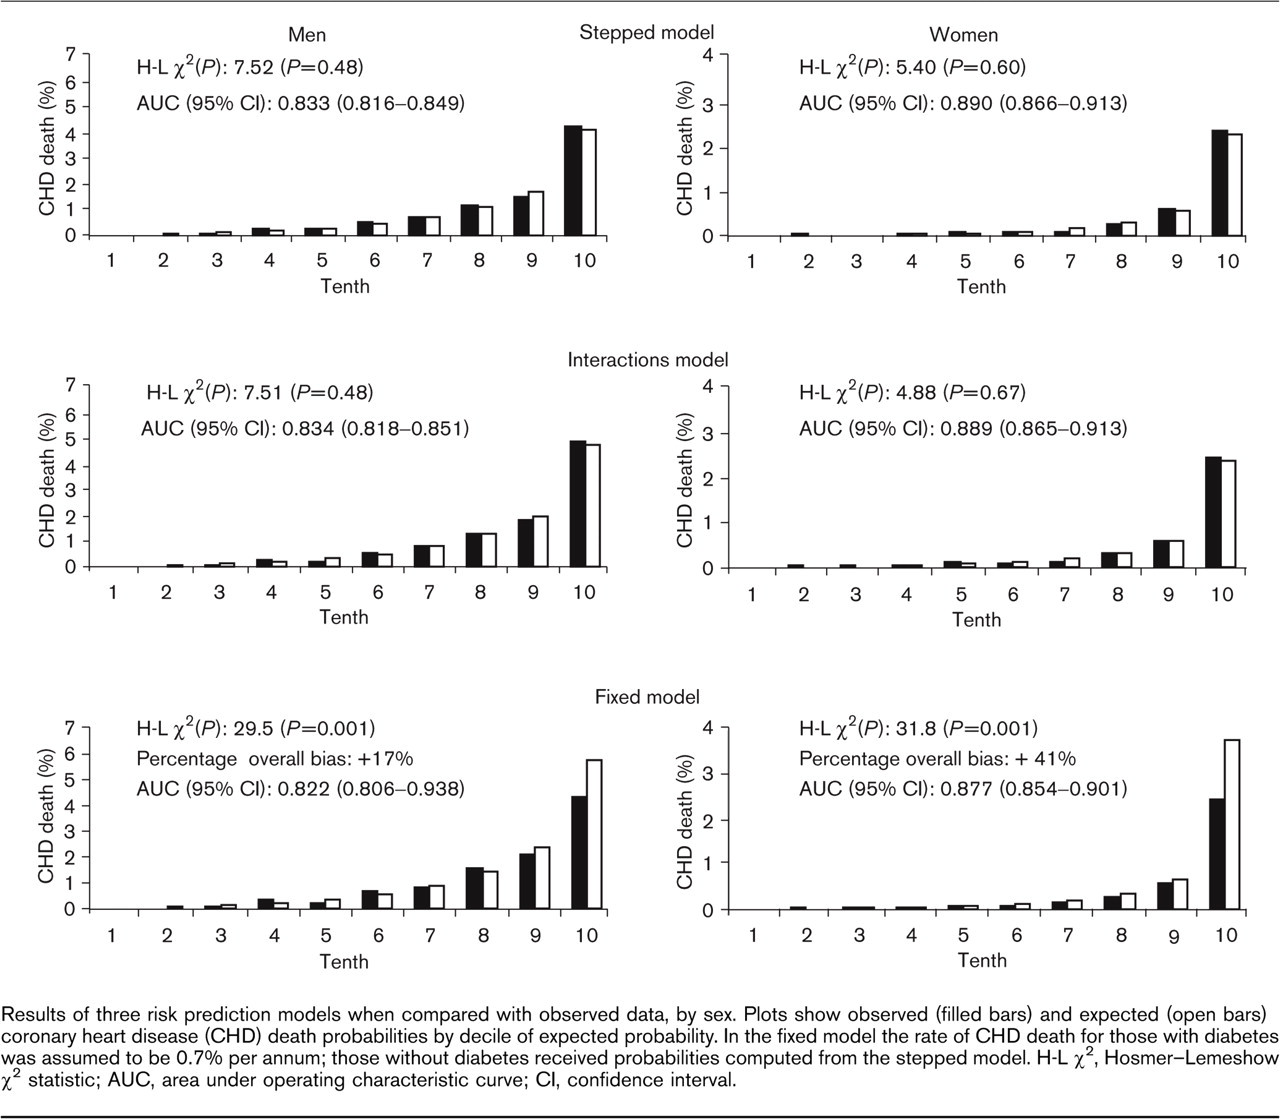
Results of three risk prediction models when compared with observed data, by sex. Plots show observed (filled bars) and expected (open bars) coronary heart disease (CHD) death probabilities by decile of expected probability. In the fixed model the rate of CHD death for those with diabetes was assumed to be 0.7% per annum; those without diabetes received probabilities computed from the stepped model. H-L X 2, Hosmer-Lemeshow X 2 statistic; AUC, area under operating characteristic curve; CI, confidence interval.
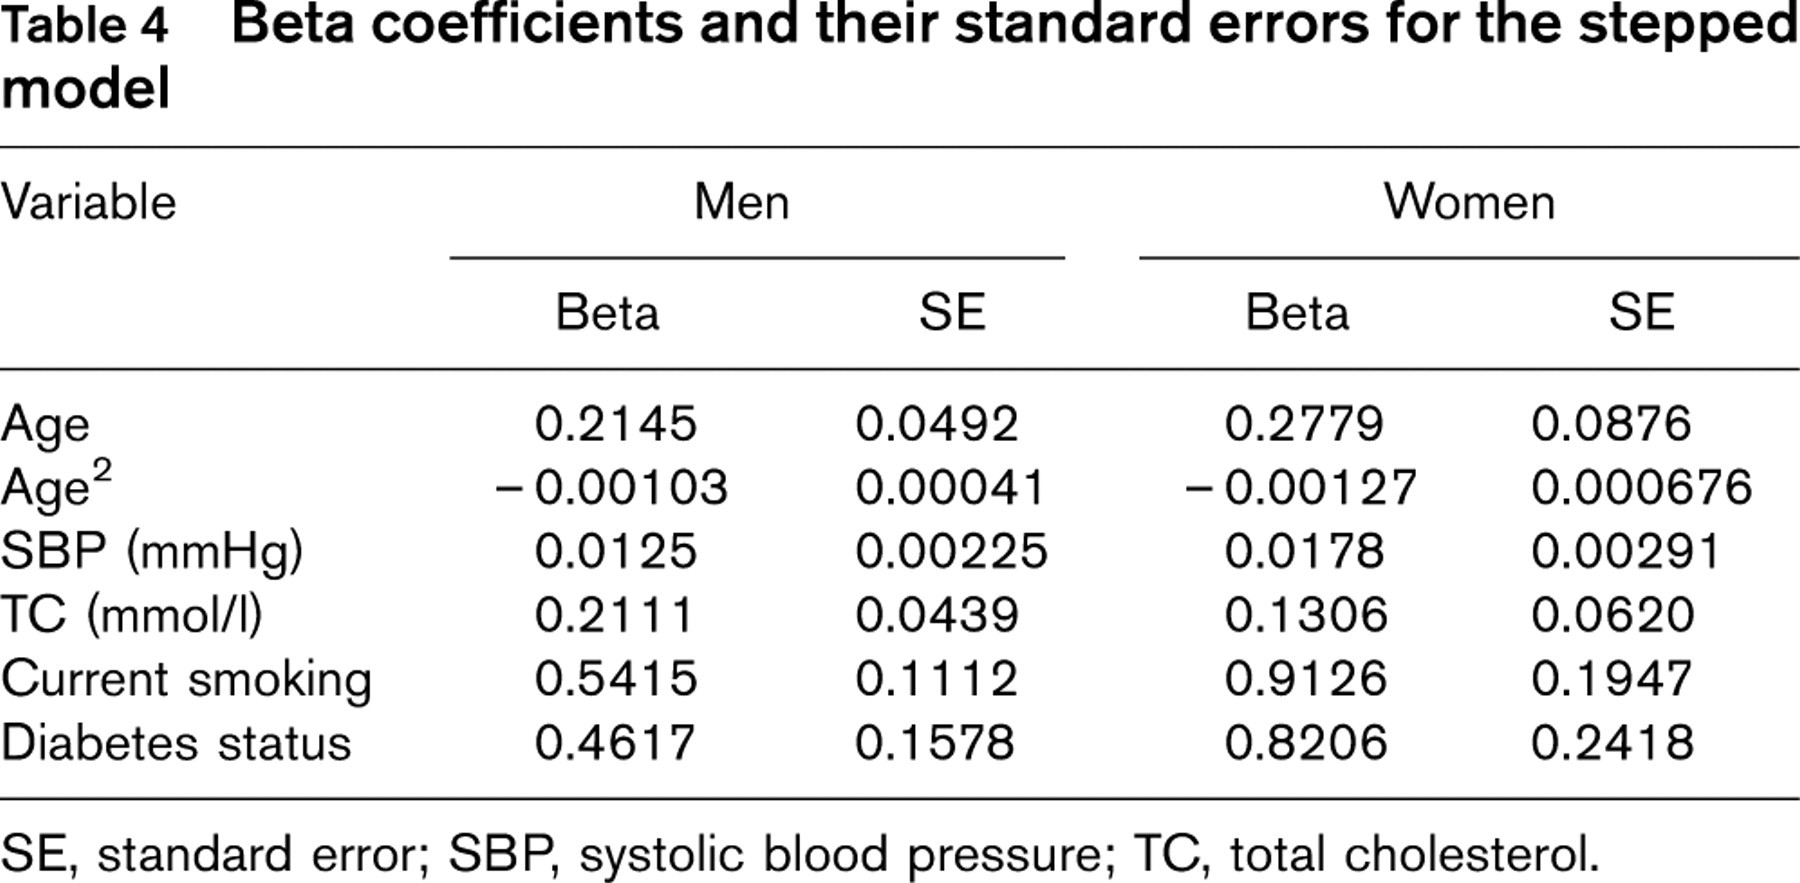
Since the stepped model is superior to the fixed model, and is simpler while performing equally well as the interaction model, this is the model of choice. Table 4 shows the beta parameters for this model; these parameters form the basis of the risk scoring system for this approach to coronary risk prediction [4].
Discussion
Primarily using data from the Framingham study [2], current treatment guidelines worldwide mostly approach coronary or cardiovascular disease risk prediction using the interaction method (e.g. New Zealand Guidelines for Assessment and Management of Cardiovascular Risk [23]), or the fixed method (e.g. British Hypertension Society [24], US National Cholesterol Education Program - Adult Treatment Panel III [14]). Others, such as the Joint European Societies [25], use a cardiovascular risk prediction algorithm that omits diabetes status as a predictor variable.
The current analyses, based on several thousands of people and several hundreds of events, suggest that coronary heart disease prediction tools should account for diabetes simply by including a term for diabetes in the risk score, as assumed in the stepped model. That is, someone with diabetes gets a constant added to his or her risk score compared with someone without diabetes but with the same levels of all the other risk factors. The more complex interaction model gives no additional benefit, suggesting that it is not necessary to develop separate prediction tools for those with, and without, diabetes. Treatment algorithms that assume all those with diabetes should be treated to prevent coronary events predict coronary death rather less well, as shown by the results for the fixed model.
Two restrictions apply to the results. First, the definition of diabetes used is inaccurate. It may be that a more precise definition, such as one based on a glucose tolerance test, would produce different results, but our data do not allow this to be tested. Sensitivity analyses restricted to self-reported diabetes (not using information on blood glucose) produced essentially the same results as shown in Table 3 here (results not shown). Second, the basic finding could alter if further risk factors, such as blood triglycerides and high-density lipoprotein cholesterol levels, physical exercise, glycosylated haemoglobin and albuminuria, were introduced into the model [26]. Some of the studies in APCSC measured triglycerides, which some have suggested should appear in risk prediction models for diabetes [27]. Although there were too few data to carry out extensive analyses, triglycerides was a significant risk factor after adjustment for all the variables in the stepped model for men, but not women (results not shown). Furthermore, the diabetes-by-triglyceride interaction was only marginally non-significant for men (P = 0.076), but, again, there was no evidence of an interaction for women. There were only 54 deaths, however, from CHD in the subgroup with data on triglycerides for women compared with 165 for men. The AUC went up slightly, for men, when triglycerides was added to both the stepped (0.878 to 0.881) and interaction (0.877 to 0.883) models. No change appeared for women. Thus triglycerides may, indeed, be useful in risk prediction models, as previous APCSC analyses have suggested [28]. The similarities in the AUCs in the stepped and interaction models with triglycerides suggests, however, that even when triglycerides are included, there is no reason to suggest that a separate algorithm is required for those with and without diabetes.
Hazard ratio and 95% confidence intervals for coronary heart disease death for major risk factors by diabetes status, adjusted for age
SBP, systolic blood pressure; TC, total cholesterol; HR, hazard ratio; CI confidence interval; NA, not available, only two events were recorded for women currently smoking; P homog, P value for interaction between the risk factor and diabetes status. Results for SBP and TC are adjusted for regression dilution bias.
Beta coefficients and their standard errors for the stepped model
SE, standard error; SBP, systolic blood pressure; TC, total cholesterol.
It has been previously suggested that the risk of myocardial infarction among those with diabetes and no known coronary disease is equivalent to that of non-diabetic individuals with a previous history of myocardial infarction [29]. Other data indicate a range of coronary risk associated with diabetes, not necessarily always similar to that of established coronary heart disease [30–35]. The current analyses are consistent with this conclusion. Some have argued that a prior diagnosis of diabetes should be regarded as equivalent to a prior diagnosis of CHD in coronary risk prediction, because of the high case fatality associated with diabetes [36]. The current data, however, which evaluate prediction of fatal coronary events, do not support this contention. Instead, it seems that the most appropriate way to treat diabetes status in coronary risk prediction is to include it as an independent variable in the risk equation.
Footnotes
Appendix
Writing committee: M. Woodward, F. Barzi, T.H. Lam, K. Jamrozik, H. Ueshima, A. Patel.
Executive committee: D.F. Gu, T.H. Lam, C.M.M. Lawes, S.W. MacMahon, W.H. Pan, A. Rodgers, I. Suh, H. Ueshima, M. Woodward.
Participating studies and principal collaborators: Aito Town: A. Okayama, H. Ueshima; H. Maegawa; Akabane ∗: N. Aoki, M. Nakamura, N. Kubo, T. Yamada; Anzhen02 ∗: Z.S. Wu; Anzhen: C.H. Yao, Z.S. Wu; Beijing Aging: Z. Tang; Beijing Steelworkers: L.S. Liu, J.X. Xie; Blood Donors’ Health: R. Norton, S. Ameratunga, S. MacMahon, G. Whitlock; Busselton ∗: M.W. Knuiman; Canberra-Queanbeyan: H. Christensen; Capital Iron and Steel Company (CISC) ∗: X.G. Wu; CISCH: J. Zhou, X.H. Yu; Civil Service Workers: A. Tamakoshi; CVDFACTS ∗: W.H. Pan; East Beijing ∗: Z.L. Wu, L.Q. Chen, G.L. Shan; EGAT ∗: P. Sritara; Fangshan ∗: D.F. Gu, X.F. Duan; Fletcher Challenge ∗: S. MacMahon, R. Norton, G. Whitlock, R. Jackson; Guangzhou: Y.H. Li; Guangzhou Occupational ∗: T.H. Lam, C.Q. Jiang; Hisayama: M. Fujishima, Y. Kiyohara, H. Iwamoto; Hong Kong ∗: J. Woo, S.C. Ho; Huashan ∗: Z. Hong, M.S. Huang, B. Zhou; Kinmen: J.L. Fuh; KMIC ∗: I. Suh, S.H. Jee, I.S. Kim; Konan ∗: H. Ueshima, Y. Kita, S.R. Choudhury; Longitudinal Study of Aging ∗: G Andrews; Melbourne ∗: G. Giles; Miyama ∗: T Hashimoto, K Sakata; National Heart Foundation ∗: T.A. Welborn; Newcastle ∗: A. Dobson; Ohasama ∗: Y. Imai, T. Ohkubo, A. Hozawa; Perth ∗: K. Jamrozik, M. Hobbs; Saitama ∗: K. Nakachi; Seven Cities ∗: X.H. Fang, S.C. Li, Q.D. Yang; Shanghai Factory Workers: Z.M. Chen; Shibata ∗: H. Tanaka; Shigaraki Town ∗: Y. Kita, A. Nozaki, H. Ueshima; Shirakawa ∗: H. Horibe, Y. Matsutani, M. Kagaya; Singapore Heart: K. Hughes, J. Lee; Singapore NHS92 ∗: D. Heng, S.K. Chew; Six Cohorts ∗: B.F. Zhou, H.Y. Zhang; Tanno/Soubetsu ∗: K. Shimamoto, S. Saitoh; Tianjin: Z.Z. Li, H.Y. Zhang; Western Australia AAA Screenees ∗: P. Norman, K. Jamrozik; Xi'an: Y. He, T.H. Lam; Yunnan ∗: S.X. Yao.
∗Studies providing data used in this paper.