
Abstract
Background
Dietary habits play a major role in cardiovascular disease risk but few simple nutrition assessment tools are available for clinical practice. We developed a 14-item food frequency questionnaire to evaluate dietary patterns in relation with coronary risk in a French population.
Design and methods
This food frequency questionnaire gave different scores of intake: saturated fatty acids (six questions), mono-unsaturated fatty acids, Ω-3 and Ω-6/Ω-3 polyunsaturated fatty acids (five questions), and fruits and vegetables (three questions). Validity was assessed against a 7-day dietary history (n = 49 subjects) and against biomarkers (n = 181). The food frequency questionnaire was also administered twice with an interval of 15 days to evaluate its reproducibility (n = 20).
Results
Validity against dietary history was assessed with Spearman correlation coefficients which ranged from 0.47 (fruits and vegetables) to 0.63 (polyunsaturated fatty acids/saturated fatty acids) (all P < 0.05), with a mean value of 0.54. On average, 39% of the subjects were classified in the same quartile with the food frequency questionnaire and the dietary history and 84% in the same or adjacent quartile. Biomarker-based validity using Spearman correlation coefficients varied from 0.21 (saturated fatty acids) to 0.53 (Ω-3 polyunsaturated fatty acids) (all P < 0.05), with a mean value of 0.35. On average, 37% of the participants were classified in the same quartile with the food frequency questionnaire and the corresponding biomarkers and 73% in the same or adjacent quartile. Reproducibility assessed by the intraclass correlation coefficient ranged from 0.71 (mono-unsaturated fatty acids) to 0.93 (global score), with a mean value of 0.81.
Conclusion
We validated a short food frequency questionnaire for dietary pattern assessment in coronary prevention.
Introduction
Cardiovascular diseases are the major cause of death in adults in most European countries [1]. Diet and lifestyle strongly influence all cause mortality during the life span [2]. Dietary patterns play a major role in the development and in the prevention of cardiovascular disease, especially coronary heart disease (CHD) [2–4. Mediterranean diet is associated with a risk reduction of CHD death [3] while a western pattern increases GHD risk [5]. Changing dietary patterns towards a Mediterranean type diet or a dietary supplementation with Ω-3 polyunsaturated fatty acids (PUFA) has been shown to reduce coronary risk in secondary prevention [6,7]. Therapeutic goals, lifestyle, and dietary guidelines have thus been published for patients with CHD, or other atherosclerotic disease, and for healthy high-risk individuals [8,9]. There is a need to have validated tools to evaluate dietary patterns among CHD high-risk patients. Few specific tools are available, however, to assess dietary recommendations in CHD prevention, and they are often time consuming and difficult to use in clinical practice and large surveys [10]. Surveys which sought to evaluate the observance of secondary prevention guidelines, such as EUROASPIRE surveys I and II [11], focused on measurable risk factors (smoking, obesity, blood pressure, serum cholesterol, diabetes mellitus). They did not include a specific evaluation of dietary recommendations, though the authors highlighted the need for dietician support [11]. We therefore developed a short food frequency questionnaire (FFQ) in order to have a fast and simple tool for food assessment in CHD prevention. The aim of this FFQ was not to assess an exhaustive diet estimate but to evaluate dietary patterns known to be associated with a positive or negative influence on CHD risk [3,5].
Methods
Study populations
Four groups of volunteers were included in this study, three to evaluate the relative validity of the questionnaire and another to test its reproducibility (Fig. 1). Participants were all French residents. All gave their informed consent.
Group I included 49 subjects who were consecutively recruited in a health appraisal centre. Both men and women were eligible if they were between 30 and 70 years of age, without any known metabolic or cardiovascular disorder that would have required specific diet recommendation. Group II included 32 coronary patients admitted to the coronary intensive care unit of our university hospital for an acute coronary syndrome. Group III included 104 coronary patients recruited 6 months to 3 years after having attended a cardiovascular rehabilitation program. Group IV included a random sample of 20 subjects (15 with a history of cardiovascular or coronary heart disease and five without), without restriction of age or sex, who agreed to answer the FFQ twice. These latter subjects had to have a stable diet during the study period in order to avoid any bias.
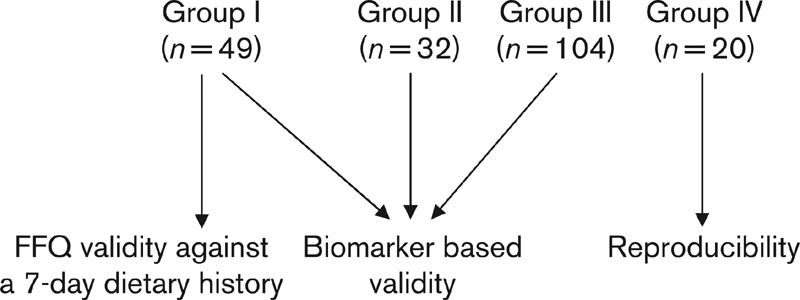
Design and sample size in each group of the study. Group I, subjects recruited in a health appraisal centre; Group II, coronary patients with acute coronary syndrome; Group III, coronary patients after cardiovascular rehabilitation; Group IV, sample of subjects with and without history of cardiovascular disease. FFQ, food frequency questionnaire.
Study design
The FFQ was self-administered and, on average, the administration of the questionnaire took approximately 5 min.
Validity was assessed by comparing the results of the FFQ against two methods. First, the validity was tested against a 7-day dietary history in the 49 volunteers of group I. The dietary history was collected during a 45-min interview with a trained dietician of the cardiovascular prevention centre of Rennes University Hospital. To avoid any interaction between the two methods, the 49 participants were randomly allocated to two groups, one filling first the FFQ and the other starting with the dietician interview according to a crossover design. Second, a biomarker based validity was assessed by comparing the specific scores of the FFQ with the corresponding plasma biomarkers in the subjects of groups I, II and III. The following comparisons were tested: saturated fatty acids (SFA), Ω-3 PUFA, and Ω-6/Ω-3 PUFA and PUFA/SFA ratios. We also compared plasma folate concentration as a biomarker of fruits and vegetables intake. Reproducibility was tested on the 20 participants of group IV who completed the FFQ twice with an interval of 15 days.
Food frequency questionnaire
This semi-quantitative FFQ was designed to assess the consumption of foods associated with an increase or a decrease of coronary risk, allowing to calculate a summary dietary score of CHD risk in accordance with the dietary recommendations [12]. It was constructed with 14 questions (Fig. 2) selected to give information about the intake of three food groups likely to influence CHD risk [13]. A group of six questions explored the SFA intake from cheese (question 1), red meat (question 2), delicatessen (question 4), salted pies and pizzas (question 5), cookies, cakes and pastries (question 7), and butter (question 12). Another group of five questions explored vegetable mono-unsaturated fatty acids (MUFA) and Ω-3 and Ω-6 PUFA intake from fish (question 3), nuts (question 9), and vegetable fats (questions 6, 13 and 14). A last group of three questions explored the fruits and vegetables intake (questions 8, 10 and 11).

Food frequency questionnaire.
A score was attributed to each food group weighed according to their influence on CHD risk. A negative score of 17 points was attributed to SFA consumption. A positive score of 19 points was achieved with vegetable MUFA, Ω-3 PUFA, and fruits and vegetables. The scale for vegetable MUFA (0–4 points), corresponded to a reported consumption ranging from under 6 to 24 or more grams/day with an increment of 6 g/point score. The scale for Ω-3 PUFA (0–8 points), corresponded to a reported consumption ranging from under 0.30 to 2.4 or more grams/day with an increment of 0.3 g/point score. The scale for fruits and vegetables ranged from 0 to 7 points. In addition, eight points were attributed to Ω-6 PUFA consumption which was not included in the global score, but was used to estimate the Ω-6/Ω-3 PUFA ratio. The scale for Ω-6 PUFA (0–8 points) corresponded to a reported consumption ranging from under 1.5 to 12 or more grams/day with an increment of 1.5 g/point score. Thus we had to multiply the Ω-6 score by five when determining the Ω-6/Ω-3 PUFA ratio.
To determine the weight of each food item inside the FFQ, we used the INCA survey which investigated the food consumption of a large adult French sample in 1998 and 1999 [14]. The respective weight of each item was defined according to the proportion it represented on the nutrient intake tables of this survey. To determine MUFA and PUFA content of vegetable fats, fish and nuts, we used the CIQUAL database [15]. Omega-3 PUFA intake from fish was evaluated from the mean weekly servings of fresh or canned fish. We attributed a mean Ω-3 PUFA intake of 0.32 g/day for a one weekly serving. For vegetable oils and margarines, a 10 g intake was attributed for each cooking or seasoning.
Seven-day dietary history
During the interview with the dietician, subjects were asked about the usual weekly frequency and amount of food consumption. This was done on a meal-by-meal basis, including snacks. For each food item, information was collected on the method of preparation and serving size using pictures and photographs when necessary. This method provided a weekly quantitative estimate of the foods typically eaten. Data collected with this dietary history method were computed with a specific software for nutritional analysis (Profil 4D, ACIM, Saint Doulchard, Cher, France). This software used standard French food composition tables and translated food consumption into nutrient intake so that we could compare SFA, Ω-3, and Ω-6/Ω-3 PUFA and PUFA/SFA ratios given by the two methods. The MUFA intake was not taken into account for the comparison of these two methods because our FFQ explored only the intake of MUFA from vegetable sources while the dietary history calculated the total MUFA intake from both animal and non-animal sources. The fruits and vegetables score and the specific question on fruit consumption of the FFQ were compared with the folate and vitamin C intake, respectively given by the dietary history.
Biomarker-based validity
Plasma contents of SFA, total Ω-3, and Ω-6/Ω-3 PUFA and PUFA/SFA ratios were used as biomarkers of intake. Plasma lipids were extracted with hexane-isopropanol (3:2, v/v) as previously described [16]. After saponification, fatty acids were methylated. Methylesters were extracted with pentane and analyzed by gas chromatography using an Agilent Technologies (Palo Alto, California, USA) 6890N at 250°C and a bonded silica capillary column. Plasma folate concentration was used as a biomarker of the intake of fruits and vegetables.
Statistical analysis
Statistical analysis was performed with SAS statistical software V8.02 (SAS Institute, Cary, North Carolina, USA). Both the validity of the FFQ compared with the dietary history and the biomarker-based validity were tested using the same statistical method. We first calculated the Spearman correlation coefficients between the scores given by both methods. In addition to correlations based on continuous variables, we cross-classified the scores into quartiles to evaluate the ability of both methods to classify individuals similarly in broad categories of intake. Percentages of concordant classification for the same quartile are given, together with concordant classification in the same or adjacent quartile. Finally, we tested the symmetry of the contingency tables using Bowker's test [17] to evaluate any over or underestimation of our FFQ compared with the dietary history. The intraclass correlation coefficient was assessed for each score to test the reproducibility of the FFQ. We also used the method of Bland and Altman [18] to evaluate the agreement between the two measurements, where the difference between the two global dietary scores obtained for each subject was plotted against the mean global dietary score. Limits of agreement were defined as means ± 1.96 SD.
Results
Study population and results of the food frequency questionnaire in the four groups of participants
Participants included in the study were predominantly male, with a mean age ranging from 47 to 58 years and a normal to mildly elevated body mass index (Table 1). Mean weekly consumption of different food groups or nutrients as estimated by the FFQ showed a wide range of consumption between the different groups of participants (Table 2). Group II (coronary patients without prior nutritional advice) had the lowest global score because of a higher score of SFA, and low scores of MUFA, Ω-3 PUFA and fruits and vegetables.
Food frequency questionnaire validity against a 7-day dietary history
Results of the comparisons performed between the FFQ and the dietary history are shown in Table 3. Correlation coefficients between the two methods ranged from 0.47 (fruits and vegetables versus folate intake estimated by the dietary history) to 0.63 (PUFA/SFA ratio), with a mean correlation coefficient of 0.54. The percentage of subjects classified in the same quartile by both methods ranged from 31% (fruits item versus vitamin C intake estimated by the dietary history) to 48% (Ω-6/Ω-3 PUFA ratio) and averaged 39%. The percentage of subjects classified in the same or adjacent quartile by both methods ranged from 82% (SFA, fruits and vegetables, and PUFA/SFA ratio) to 88% (Ω-6/Ω-3 PUFA ratio), and averaged 84%. All contingency tables were symmetrical showing no under or overestimation of our FFQ compared with the dietary history.
General characteristics of the patients in each group of the study
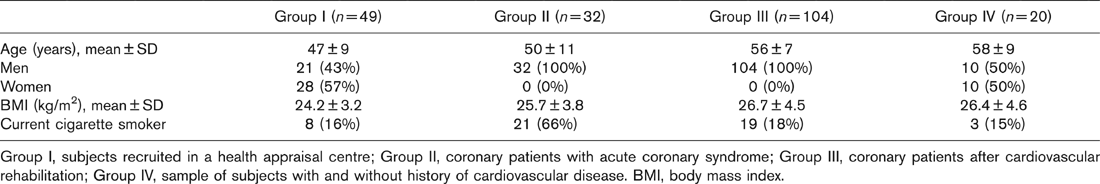
Group I, subjects recruited in a health appraisal centre; Group II, coronary patients with acute coronary syndrome; Group III, coronary patients after cardiovascular rehabilitation; Group IV, sample of subjects with and without history of cardiovascular disease. BMI, body mass index.
Mean scores assessed by the food frequency questionnaire among patients in each group of the study
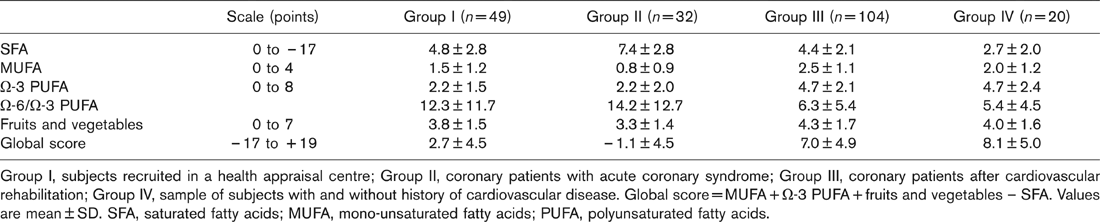
Group I, subjects recruited in a health appraisal centre; Group II, coronary patients with acute coronary syndrome; Group III, coronary patients after cardiovascular rehabilitation; Group IV, sample of subjects with and without history of cardiovascular disease. Global score = MUFA + Ω-3 PUFA+ fruits and vegetables – SFA. Values are mean ± SD. SFA, saturated fatty acids; MUFA, mono-unsaturated fatty acids; PUFA, polyunsaturated fatty acids.
Validity of the food frequency questionnaire against a 7-day dietary history
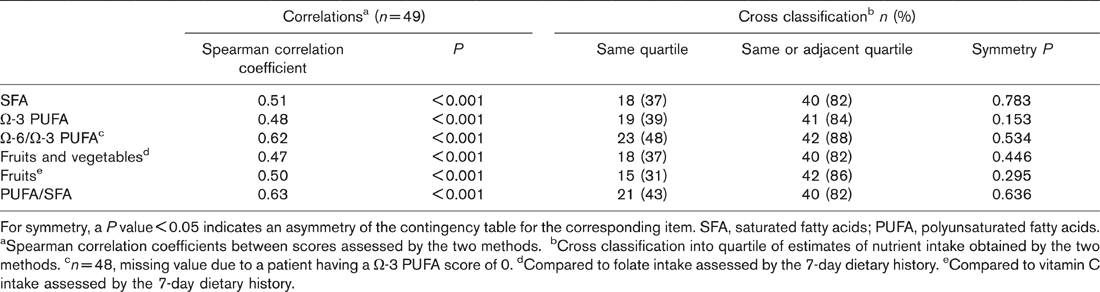
For symmetry, a P value <0.05 indicates an asymmetry of the contingency table for the corresponding item. SFA, saturated fatty acids; PUFA, polyunsaturated fatty acids.
aSpearman correlation coefficients between scores assessed by the two methods.
bCross classification into quartile of estimates of nutrient intake obtained by the two methods.
cn = 48, missing value due to a patient having a Ω,-3 PUFA score of 0.
dCompared to folate intake assessed by the 7-day dietary history.
eCompared to vitamin C intake assessed by the 7-day dietary history.
Biomarker based validity of the food frequency questionnaire
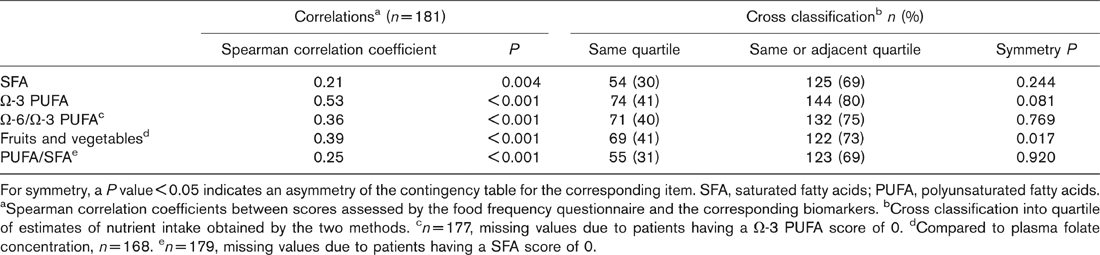
For symmetry, a P value < 0.05 indicates an asymmetry of the contingency table for the corresponding item. SFA, saturated fatty acids; PUFA, polyunsaturated fatty acids. aSpearman correlation coefficients between scores assessed by the food frequency questionnaire and the corresponding biomarkers. bCross classification into quartile of estimates of nutrient intake obtained by the two methods. cN = 177, missing values due to patients having a Ω-3 PUFA score of 0. dCompared to plasma folate concentration, n = 168. en = 179, missing values due to patients having a SFA score of 0.
Biomarker-based validity
Results of the comparisons performed between the FFQ and the corresponding biomarkers are shown in Table 4. Correlation coefficients between the two methods ranged from 0.21 (SFA) to 0.53 (Ω-3 PUFA), with a mean correlation coefficient of 0.35. The percentage of subjects classified in the same quartile by both methods ranged from 30% (SFA) to 41% (Ω-3 PUFA, and fruits and vegetables versus plasma folate concentration), and averaged 37%. The percentage of subjects classified in the same or adjacent quartile by both methods ranged from 69% (SFA and PUFA/SFA ratio) to 80% (Ω-3 PUFA), and averaged 73%. All contingency tables were symmetrical except for the fruits and vegetables score compared to plasma folate concentration for which the asymmetry showed an underestimation of the FFQ to reflect plasma folate concentration.
Reproducibility
The mean time between the two administrations of the FFQ was 16 ± 3 days. Intraclass correlation coefficients assessed for each score between the two administrations of the FFQ ranged from 0.71 (MUFA) to 0.93 (global score), and averaged 0.81 (Table 5). The mean difference between the scores obtained with the two FFQs was inferior to one point whatever the score considered. In the Bland and Altman representation for the global score, the mean difference was −0.35 (95% confidence interval, −3.80 to 3.10) (Fig. 3), and there was no systematic difference between the two administrations of the questionnaire.
Discussion
Many international statements have emphasized the major importance of dietary recommendations in primary and secondary CHD prevention [8,9]. Their observance is probably inadequate, however, as indirectly underlined by the increasing prevalence of obesity [11] and we lack qualitative data especially in the high-risk population because of the difficulty of such evaluation in clinical practice. Thus we aimed to build a short FFQ to assess the dietary pattern associated with CHD risk. Hence, it did not assess an exhaustive diet or the total energy intake.
SFA consumption has long been associated with an increase in CHD risk [4,19] and has also been correlated to all cause mortality [20]. Our FFQ gave an important negative weight (–17 points) for SFA in the global score. Because the aim of the FFQ was to determine a dietary pattern, not an exhaustive dietary history, we limited the number of items. For instance, we did not include questions about milk or egg consumption because it gave limited information about inter-individual variation of total SFA intake [3,5]. Even if olive oil consumption is characteristic of the Mediterranean diet [3,13], MUFA consumption from vegetable source has not been specifically evaluated for CHD prevention, and consequently had a moderate weight in the positive scale (4/19). In several observational and interventional secondary prevention studies, Q-3 PUFA demonstrated a protective effect against cardiovascular events [6, 7,21,22]. A higher relative weight was thus attributed to Ω-3 PUFA in the positive scale of our FFQ (8/19 points). Fish is the major food source of long chain Ω-3 PUFA (eicosapentaenoic acid and docosahexaenoic acid) but there is a large variability among species and, within species according to environmental variables such as diet, season or breeding type [23]. For this reason, Ω-3 PUFA intake from fish was evaluated from the mean weekly servings of fish. Consumption of fruits and vegetables, particularly green leafy vegetables and vitamin C-rich fruits and vegetables are part of the so-called prudent dietary pattern which is associated with a lower CHD risk [5, 13,24]. Their protective effect could be mediated through their content in natural antioxidant as well as in folate susceptible to lower homocysteine level [25] or to have direct protective effects at the endothelium [26]. Their relative weight was 7/19 points in the positive scale of our FFQ. The Ω-6/Ω-3 PUFA ratio has been proposed as an indicator for CHD risk [27]. In the usual Western diet the ratio is around 15 and the recommended ratio in CHD prevention varies between 4 and 6 [27]. Our FFQ is thus able to summarize diet through two complementary scores. The most important is the global dietary score that reflects the dietary pattern and the other one is the estimated Ω-6/Ω-3 ratio.
Reproducibility of the food frequency questionnaire (FFQ) assessed by the intraclass correlation coefficients and mean difference of scores between the two food frequency questionnaires
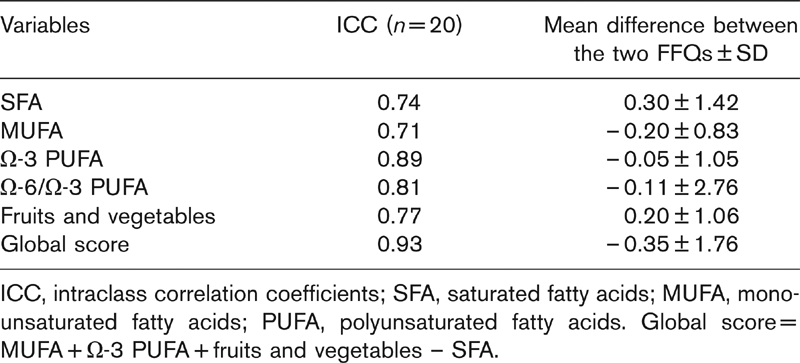
ICC, intraclass correlation coefficients; SFA, saturated fatty acids; MUFA, mono-unsaturated fatty acids; PUFA, polyunsaturated fatty acids. Global score = MUFA + Ω-3 PUFA + fruits and vegetables – SFA.
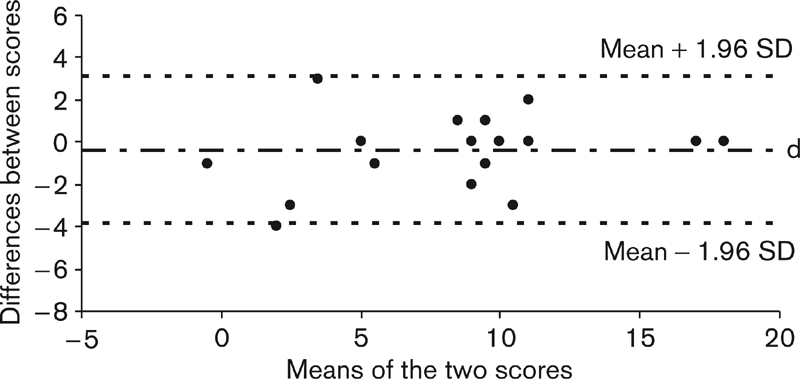
Graphic representation of the difference between the two consecutive scores obtained to assess the reproducibility of the food frequency questionnaire versus the mean of the two scores for each individual according to the method of Bland and Altman [18]. Horizontal lines indicate the mean difference between the two scores (d = −0.35) and the limits of agreement (corresponding to the 95% confidence interval, mean ± 1.96 SD).
We chose dietary history as the reference method to validate our FFQ. There is no gold standard for the estimation of dietary intake [28] but dietary history gives a more complete and detailed description of both qualitative and quantitative aspects of food intake than do food records or 24-h recalls, eliminates individual day-to-day variations, takes into consideration seasonal variations, and provides a good description of usual intake [29]. It requires, however, a highly trained dietician, is time consuming, is subject to variability among interviewers, depends on subject's memory, and records must be checked, coded and entered appropriately [29]. In our study, the same trained dietician collected and coded the dietary history of all patients and computed them with a specific software for nutritional analysis. In addition to the dietary history, we validated the FFQ against biomarkers which are independent of the subject's reported intake. A recent review [28] indicated that 75% of studies have been validated against another dietary method and only 19% against a biomarker. Low correlations are to be expected, however, since biomarker levels are subject to laboratory errors and are not influenced by diet alone [30]. For instance, SFA are not only derived from food but also from fatty acid biosynthesis.
For the purpose of this validation study, subjects with very different characteristics were enrolled including men and women, with and without CHD history, and with and without former dietary advice. As expected, the dietary habits varied widely between the subgroups. The most unfavourable pattern was found in coronary patients without dietary advice and the best pattern was observed in patients who had benefited from cardiovascular rehabilitation. Our results showed a similar quality of the validation in all subgroups.
The correlation coefficient, widely used in nutritional research, although notoriously difficult to interpret, can serve as a global measure of linear association [18]. The degree of agreement with classification into percentiles (generally tertiles, quartiles or quintiles) is also commonly used. Our results were in accordance with those observed in other validation studies with much detailed FFQ. When compared with a dietary history, a specific fat intake estimate FFQ (104 items) found a mean correlation coefficient of 0.65 (0.38 to 0.83) [31], and an habitual food intake estimate FFQ (75 items) found mean correlation coefficients of 0.71 for macronutrients and 0.66 for vitamins and minerals [32]. Others have used 24-h recalls or weighed records as reference methods for validation of longer FFQ (70 to 134 items) [30,33–35]. They found similar or slightly lower mean correlation coefficients ranging from 0.40 to 0.48, and mean percentage of agreement into quartiles ranging from 39 to 48% [30, 33,34].
Despite their limitations, our correlations with plasma biomarkers were better than previously reported for SFA [30,36] and Ω-3 PUFA [36], and slightly lower for Ω-6/Ω-3 PUFA [36] and PUFA/SFA [30]. Plasma folate was significantly correlated with the fruits and vegetables score that is known to be the largest source of folate in the diet, and the correlation was similar to that observed with a specific 90 items FFQ for assessing folate intake [37].
Reproducibility of our FFQ showed a higher mean intraclass correlation coefficient than in other studies [33, 35,38]. The interval between the two administrations of the FFQ (16 days) however, was shorter than in those studies (1–12 months).
This study has some limitations. First, the sub-samples of groups I, II and III were relatively small. The total number of subjects included, however, is 205. Nearly half of them had a history of coronary disease which is a major target of this FFQ. In fact our aim was to favour the diversity of the tested population and the methodological quality of the validation process using three different approaches (comparison to a reference method, biomarker-based validity, and reproducibility). Second, groups II and III were composed exclusively of men who represent the majority of middle-aged coronary patients. Women were included in group I, however, for the validation against a reference method and the biomarker-based validity, and in group IV to test the reproducibility of the FFQ. Third, this validation study was performed among French residents. Before using it in populations of non-French origin, other validation studies would be useful.
Our FFQ is one of the shortest ever proposed for assessing dietary pattern, especially in cardiovascular prevention. Another short FFQ (15 items) has already been validated with Norwegian food [10] and showed good agreement with a 7-day food record (correlation coefficient of 0.73 with the sum score of the 15 items). It did not estimate specifically the type of fat intake and the value of each item was constant (1 to 3 points) so that it did not take into account the relative weight of the different food groups with regard to the CHD risk.
In conclusion, this study showed that the relative validity and reproducibility of this short FFQ were similar or superior to much more detailed validated FFQ, and that it was able to rank subjects by levels of intake. This FFQ represents a useful tool to evaluate dietary habits and adherence to dietary advice in cardiovascular prevention and rehabilitation. In the future, it should be interesting to correlate this FFQ to cardiovascular morbidity-mortality in large-scale prevention trials.
Footnotes
Acknowledgements
We wish to thank the dieticians of the Cardiovascular Prevention Centre (CHU) Valerie Samama and Catherine Frerou for their assistance, Christine Jard from the Centre for Preventive Medicine (CRAM) for her help in laboratory assays, and Gisèle Laviolle for English technical support.