
Abstract
Background
Although cardiovascular diseases are the main cause of death in the region, there are few data on the prevalence of cardiovascular risk factors in Latin American. We studied the distribution and impact of cardiovascular risk factors in Bucaramanga, Colombia.
Methods
We conducted a cross-sectional study in a random sample of 2989 subjects 15–64 years old. Population attributable risks were estimated from Framingham risk scores.
Results
Smoking prevalence was 16.2% (men 26.3%; women 10.5%). Hypertension prevalence was 9.9% in women and 8.8% in men, but reached 50% in those 60–64 years old. After adjustment for body mass index, men were more likely to be hypertensive, but only if under 40 years old. Obesity was more frequent in women (15.7%) than in men (8.7%), even after age-adjustment. About 46% of the participants were overweight or obese. Women also had higher prevalence of high total cholesterol (19.7 versus 15.7%) and high low-density lipoprotein-cholesterol (23.9 versus 19.5%), but lower prevalence of low high-density lipoprotein (HDL)-cholesterol (22.2 versus 37.6%). Only low-HDL prevalence was significantly different after body mass index and age-adjustment. The prevalence of diabetes was similar in men and women (4%), but age and body mass index-adjusted impaired fasting glucose prevalence was 60% higher in women. Population attributable risks were larger and similar for high total cholesterol, hypertension, and large waist-to-hip ratio (19%).
Conclusions
Women had higher prevalence of all risk factors with the exception of smoking and low-HDL. Reduction in cholesterol levels, blood pressure and obesity is a priority to control the ongoing epidemic of cardiovascular diseases in this population.
Introduction
Cardiovascular diseases have become the main cause of mortality in Latin America, exceeding infectious and parasitic diseases by 66% in 1990 [1]. Aging and a rising prevalence of risk factors drive the increasing burden of cardiovascular diseases in this population [2]. In Colombia, for instance, the coronary heart disease mortality rate increased 2.1% per year from 1980–1984 to 1990–1996 [3]. Better knowledge on the distribution of cardiovascular risk factors is needed for the design of effective prevention programs in the region. In 1995 the Pan American Health Organization launched the Countrywide Integrated Non-communicable Diseases Intervention Programme in Latin America/Conjunto de Acciones para la Reducción Multifactorial de Enfermedades No Transmisibles (CINDI/CARMEN) [4, 5]. A baseline survey of chronic disease risk factors was conducted in Bucaramanga, a city of 560 000 population, in eastern Colombia, as part of CARMEN. Here we report the distribution of major cardiovascular risks factors and the potential impact for prevention resulting from their control.
Methods
The population of Bucaramanga is classified in six socioeconomic strata (SES) defined by the availability of public services and quality of household units in the neighborhood [6]. We selected a random sample of 40 neighborhoods from low SES (2 and 3). Sixty to 80 households per neighborhood and one person per household were selected at random. All participants completed an interview and were invited for a physical examination in a local clinic. The study was approved by the Research Ethics Committee of the Universidad Industrial de Santander and written informed consent was obtained from each participant.
Fasting blood samples were drawn from each participant, processed and stored at −70°C. Blood tests were conducted at the Department of Santander Public Health Laboratory in batches of samples with appropriate masked quality control samples added to each batch, using an Autolab blood sample analyzer (Boehringer Mannheim GmbH Diagnostica, Mannheim, Germany). Plasma glucose, total and high-density lipoprotein (HDL) cholesterol and triglyceride were measured using commercially available kits (Boehringer Mannheim, MPR3, MPR2 CHOD-PAP, MPR2 GPO-PAP, respectively). HDL levels were determined after precipitation of plasma with MgCl2 and dextran sulfate. Low-density lipoprotein (LDL) cholesterol was calculated using the Friedewald equation [7].
Participants who had consumed 100 or more cigarettes in their lifetime and were now consuming one or more cigarette per day were classified as current smokers. Blood pressure was measured independently by two observers in each participant, following standard recommendations [8]. The average of the two measurements was used in the analysis and subjects with systolic blood pressure (SBP) ≥ 140 mmHg or diastolic blood pressure (DBP) ≥ 90 mmHg and those with a physician diagnosis who were taking antihypertensive medication were considered as hypertensive. Participants with fasting plasma glucose ≥ 7.0 mmol/l and those who had been diagnosed by a physician were considered as diabetic [9].
Non-diabetic participants with glucose ≥ 5.6 and < 7.0 mmol/l were classified as having impaired fasting glucose (IFG) [9]. Weight, height, and waist and hip circumference were measured in duplicate and the average of both measurements was used for the analysis. Obesity was defined as a body mass index (BMI) of 30 kg/m2 or above [10] and abdominal obesity as a waist circumference of 88 cm or more in women and 102 cm or more in men [11]. Although there is no consensus on cut points for waist-to-hip ratio (WHR) [12], we also determined the proportion of men with WHR over 1.00 and women with WHR over 0.85 [10].
Data analysis
Summary measures and their 95% confidence intervals (CIs) were calculated for all risk factors. The effect of age, sex and BMI on the distribution of other risk factors was estimated by multiple linear and log-binomial regression models [13].
A considerable fraction of interviewed participants did not participate in the physical exam. Factors associated with participation in the physical exam were identified using logistical regression. To avoid selection bias due to non-participation, we used multiple imputation to fill out missing values for participants without physical exam data [14]. We used Amelia [15] to generate 10 imputed data sets. Means were calculated as the average of the estimates from each imputed data set, and variances were calculated using Rubin's formula [16].
To estimate population attributable risks (PARs), we calculated the 10-year expected risk of coronary heart disease in each individual of 30 years or older, using the Framingham equation [17]. Then we used a linear regression model with the Framingham score as outcome to estimate the expected risk in the whole population (Rp) and in those not exposed to the risk factors of interest (Ro), while holding other risk factors at their average value. The PAR was defined as ((Rp-Ro)/Rp) x100 and its variance was obtained by simulation of Rp and Ro and their corresponding variances. Stata 8.0 (Stata Corporation, College Station, Texas, USA) was used in the analysis.
Results
A total of 2989 15–64-year-old subjects were studied. Almost two-thirds were women and the average age was 35.1 years (95% CI 34.6–5.6; Table 1). Overall 18.8% of the interviewed subjects did not take the physical examination. Independently of other factors, subjects 15–19, 20–29, 30–39, and 40–49 were 2.25, 2.73, 2.50, and 1.77 times more likely to miss the examination, respectively, than those 50 years or older. Similarly, non-participation was 15% higher in men than in women, and 23% higher in those from SES 3 than those from SES 2.
Prevalence of current smoking by age and sex. Bucaramanga, 2001
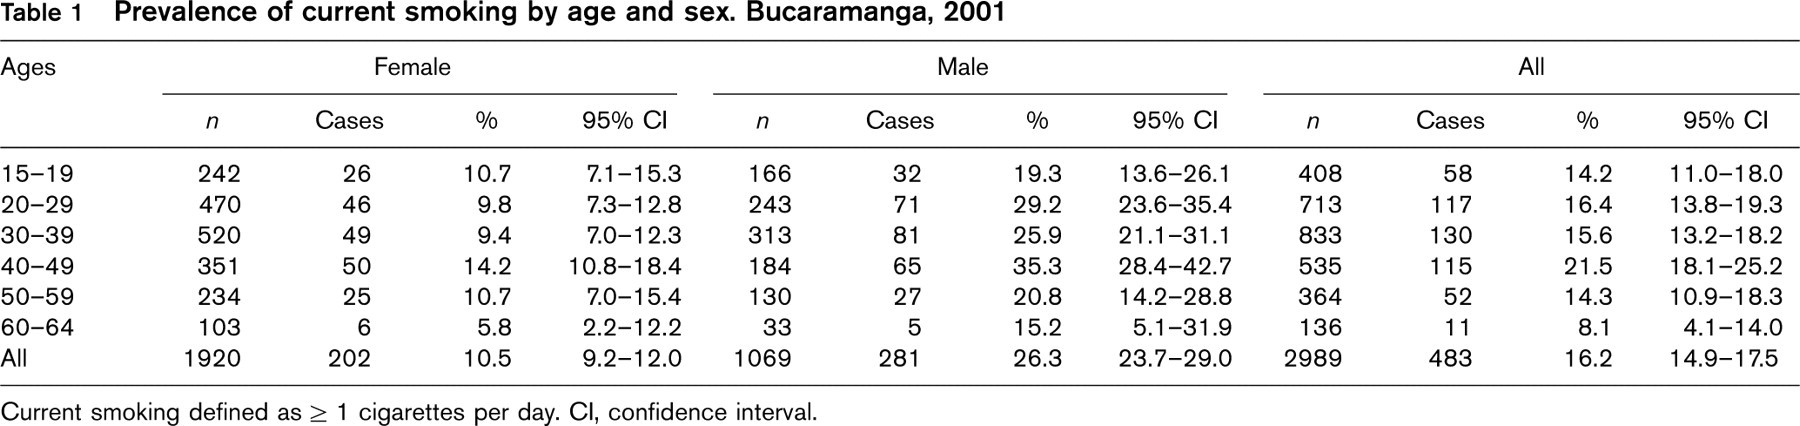
Current smoking defined as ≥ 1 cigarettes per day. CI, confidence interval.
Furthermore, people in self-reported good and fair health were 35 and 44% more likely to miss the examination than those in excellent health.
Smoking
Overall smoking prevalence was 16.2% and was considerably higher in men than in women (26.3 versus 10.5%; P < 0.001; Table 1). Age, alcohol use, and education-adjusted smoking prevalence was 2.06 times higher (95% CI 1.74–2.44) in men than in women. After adjustment for age, sex and alcohol use, smoking prevalence was 18.7% (95% CI 3.2–31.7%) and 33.3% (95% CI 6.1–52.7%) lower in subjects with secondary and college education, respectively, than in those with primary education. The average age people started smoking was 18.1 years (95% CI 17.8–18.5), but varied significantly with sex and age. Average ages of starting smoking were 20.6 (95% CI 19.8–21.4) in women and 17.3 (95% CI 16.8–17.8) in men in people under 30 years old (P < 0.001). Corresponding means for people ≥ 30 years were 16.7 (95% CI 16.0–17.4) and 15.8 (95% CI 15.4–16.6; P = 0.04). This age by sex interaction was statistically significant (P = 0.004).
Blood pressure
Mean SBP was 108.2 mmHg (95% CI 107.3–109.1) in women and 111.4 mmHg (95% CI 110.4–112.5) in men (P < 0.001). The effect of sex on SBP depended on age. Before age 50 years, age and BMI-adjusted SBP was 6.2 mmHg (95% CI 5.1–7.3) higher in men, while in participants 50 years or older it was slightly but non-significantly higher in women (1.9 mmHg; 95% CI −2.9–6.8). On the other hand, average DBP was 68.1 mmHg (95% CI 67.6–68.6) in women and 70.9 mmHg (95% CI 70.3–71.6) in men (P < 0.001). After adjusting by age and BMI, DBP was 4.0 mmHg higher in men (95% CI 3.2–4.7) across all age groups.
The prevalence of hypertension was 9.9% in women and 8.8% in men (P = 0.30), and increased progressively with age (Table 2). After adjustment for BMI, younger men were more likely to be hypertensive than younger women, but older women were as likely to be hypertensive as older men. Male to female prevalence ratios (PRs) were 2.36 (95% CI 0.98–5.67), 1.79 (95% CI 0.97–3.31), 1.36 (95% CI 0.92–2.01), 1.03 (95% CI 0.76–1.40), and 0.78 (95% CI 0.50–1.22) at 20, 30, 40, 50 and 60 years of age, respectively (P-value for a sex by age interaction 0.06).
Obesity
Average BMI was 25.4 kg/m2 (95% CI 25.2–25.6) in women and 24.2 kg/m2 (95% CI 23.9–24.5) in men (P < 0.001) and increased with age. Age-adjusted BMI was 0.98 kg/m2 (95% CI 0.62–1.35) higher in women than in men. The prevalence of obesity (BMI ≥ 30 kg/m2) was 15.7% in women and 8.7% in men (P < 0.001; Table 2), but overall 45.8% were overweight or obese (BMI ≥ 25 kg/m2). In addition, the age-adjusted prevalences of obesity and overweight were 1.74 (95% CI 1.36–2.22) and 1.14 (95% CI 1.04–1.24) times higher in women than in men.
Mean waist circumference was 77.0 cm in women and 81.9 cm in men (P < 0.001). Abdominal obesity affected 13.1% of the participants and increased with age (Table 2). The BMI and age-adjusted prevalence of abdominal obesity was 3.26 (95% CI 2.12–4.99) times more frequent in women than in men. Moreover, 22.5% of the women had a large WHR, as compared to only 9.0% of the men (P < 0.001). For a fixed BMI, women were 5.78 (95% CI 2.72–12.25), 4.27 (95% CI 2.56–7.14), 3.15 (95% CI 2.27–4.38), 2.33 (95% CI 1.70–3.19), and 1.72 (95% CI 1.06–2.81) times more likely to have a large WHR than men at ages 20, 30, 40, 50, and 60, respectively (P for interaction, 0.03).
Plasma cholesterol and dyslipidemia
Mean total, LDL and HDL-cholesterol were 5.18 (95% CI 5.13–5.23), 3.49 (95% CI 3.36–3.43), and 1.03 (95% CI 1.02–1.04) mmol/l, respectively, and all increased with age. Age and BMI-adjusted total, LDL, and HDL-cholesterol were 0.13 (95% CI 0.04–0.22); 0.25 (95% CI 0.17–0.32); and 0.07 (95% CI-0.06, 0.09) mmol/l higher in women than in men, respectively. The prevalence of high total cholesterol (≥ 6.15 mmol/l; Table 3) was significantly lower in men than in women (15.7 versus 19.7%; PR 0.76; 95% CI 0.61–0.94). Similarly, the prevalence of high LDL-cholesterol (≥ 4.10 mmol/l) was also significantly lower in men (19.5 versus 23.9%; PR 0.77; 95% CI 0.63–94). These patterns persisted after adjusting for age and BMI but were no longer statistically significant. On the contrary, low HDL-cholesterol prevalence (< 0.90 mmol/l) was significantly higher in men (37.6 versus 22.2%), even after adjustment for age and BMI (PR 2.2; 95% CI 1.82–2.65).
Prevalence of hypertension, obesity, and abdominal obesity by age and sex. Bucaramanga, 2001
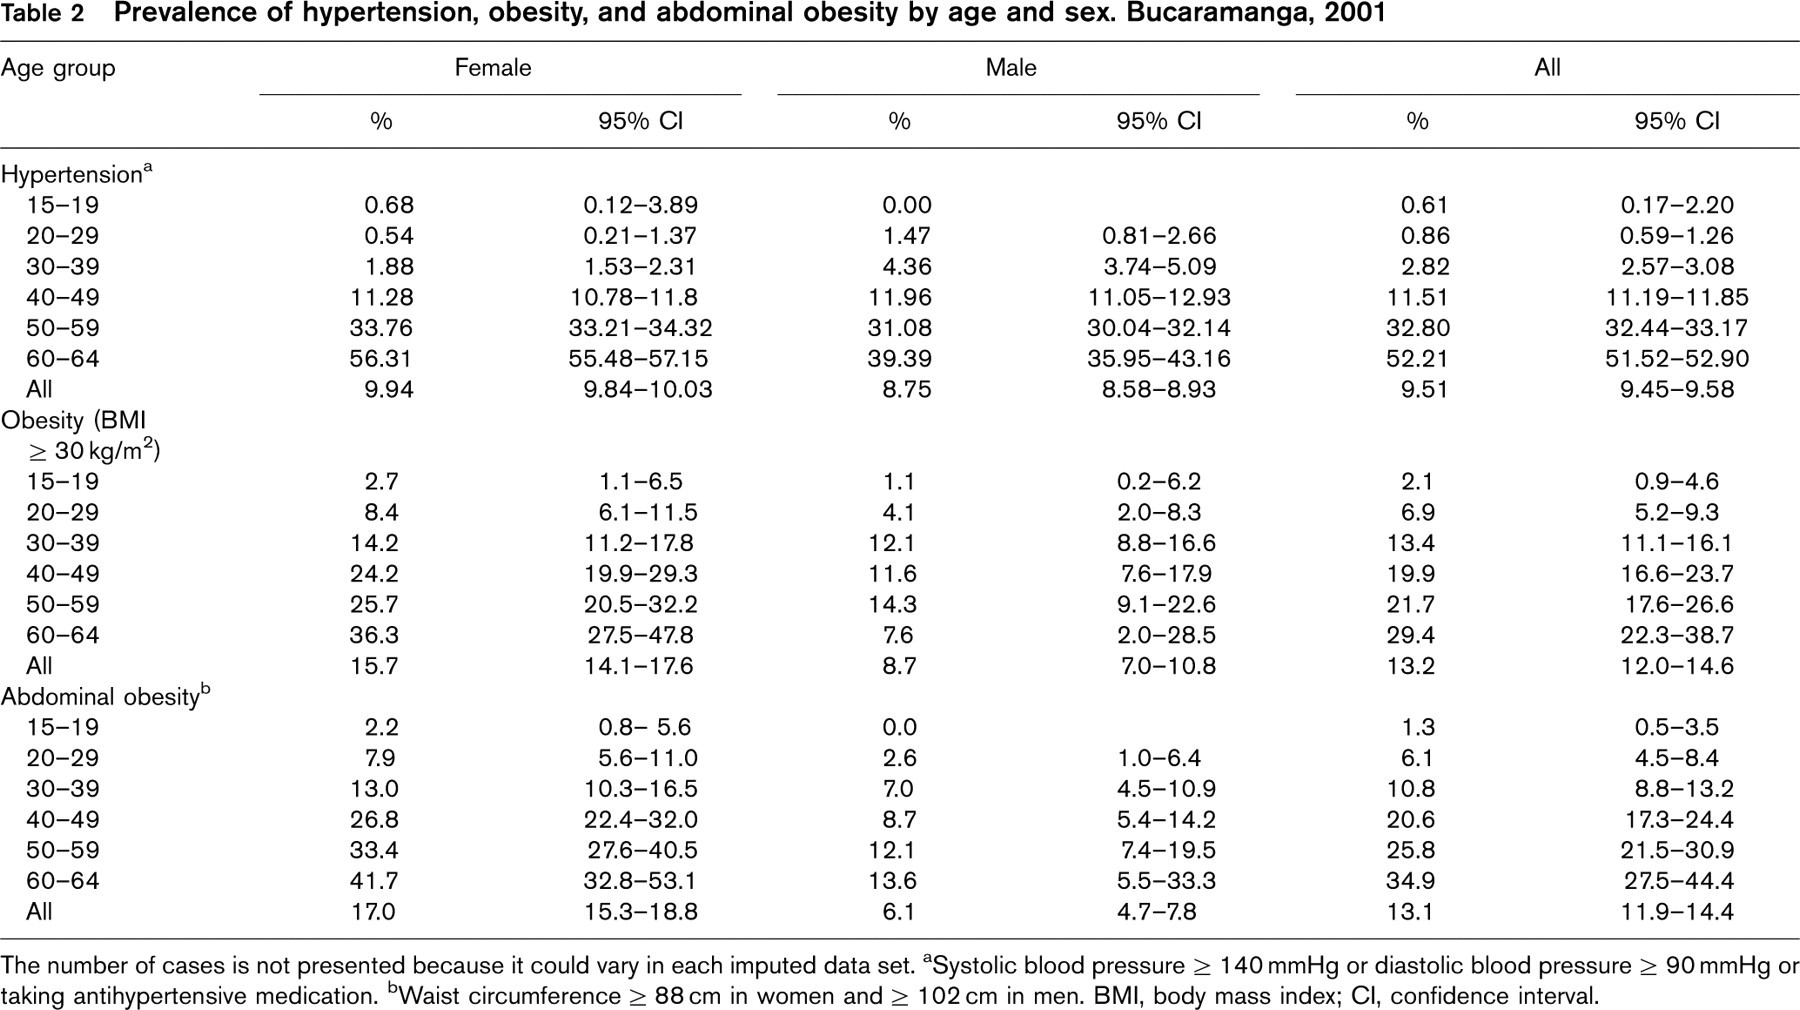
The number of cases is not presented because it could vary in each imputed data set.
aSystolic blood pressure ≥ 140 mmHg or diastolic blood pressure ≥ 90 mmHg or taking antihypertensive medication.
bWaist circumference ≥ 88 cm in women and ≥ 102 cm in men. BMI, body mass index; CI, confidence interval.
Prevalence of dyslipidemia by age and sex. Bucaramanga, 2001
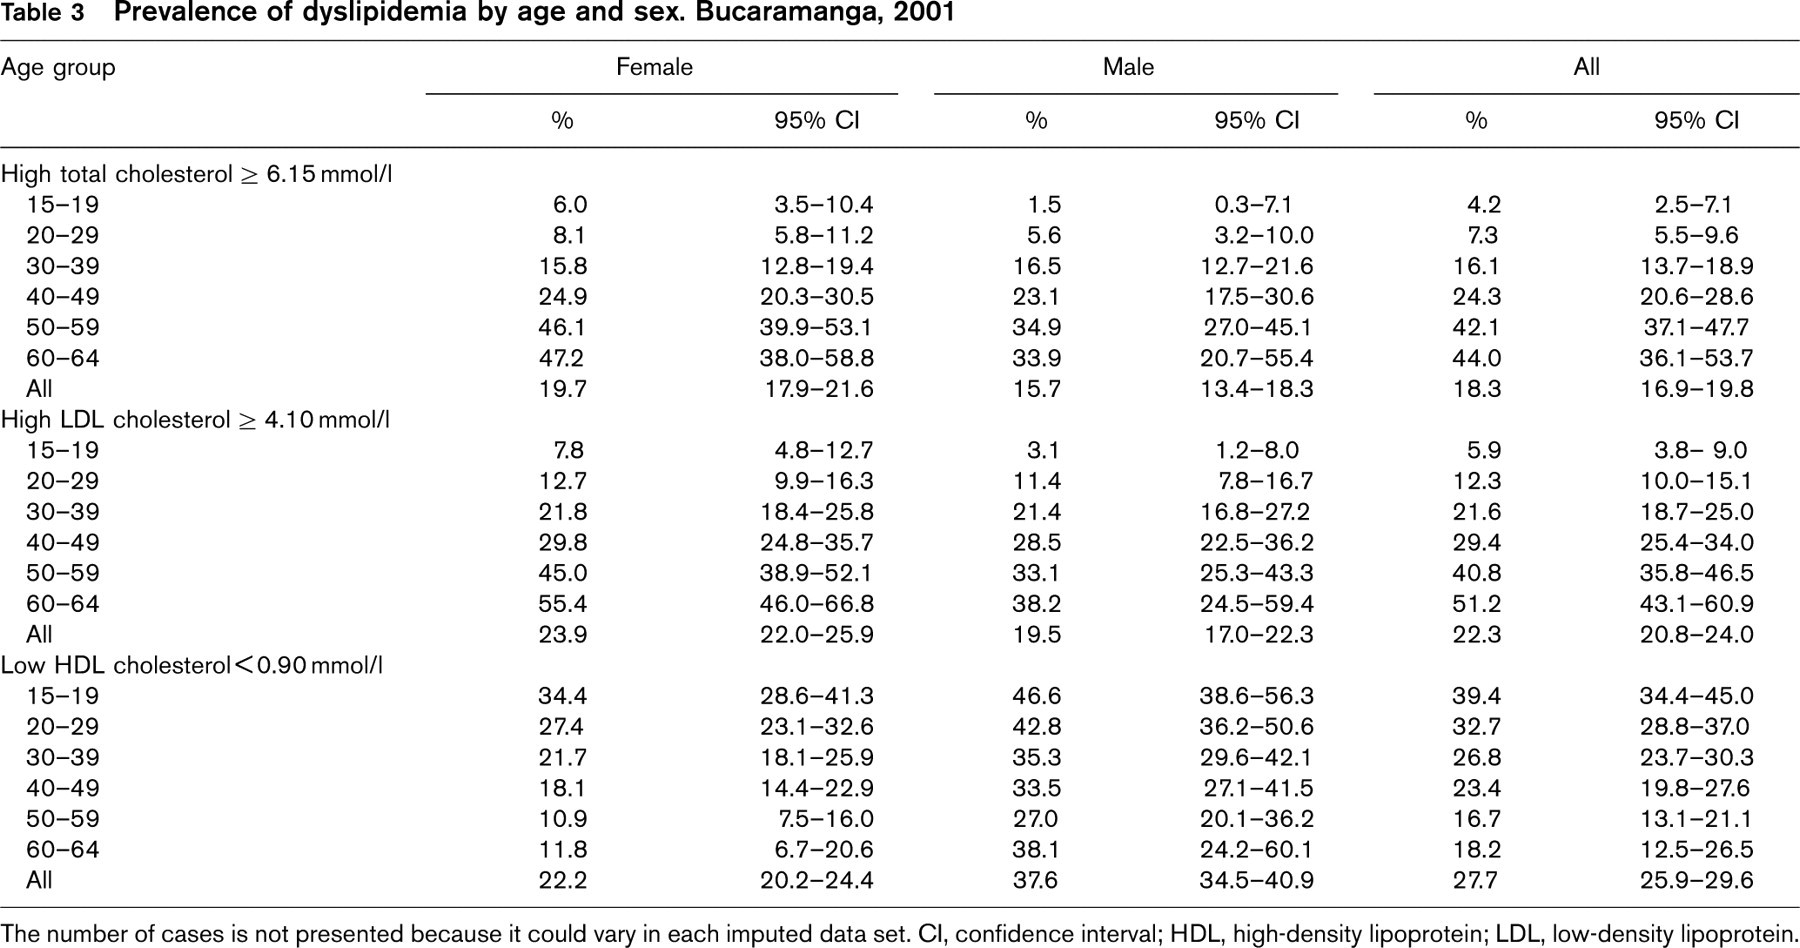
The number of cases is not presented because it could vary in each imputed data set. CI, confidence interval; HDL, high-density lipoprotein; LDL, low-density lipoprotein.
Prevalence of diabetes and impaired fasting glucose by age and sex. Bucaramanga, 2001
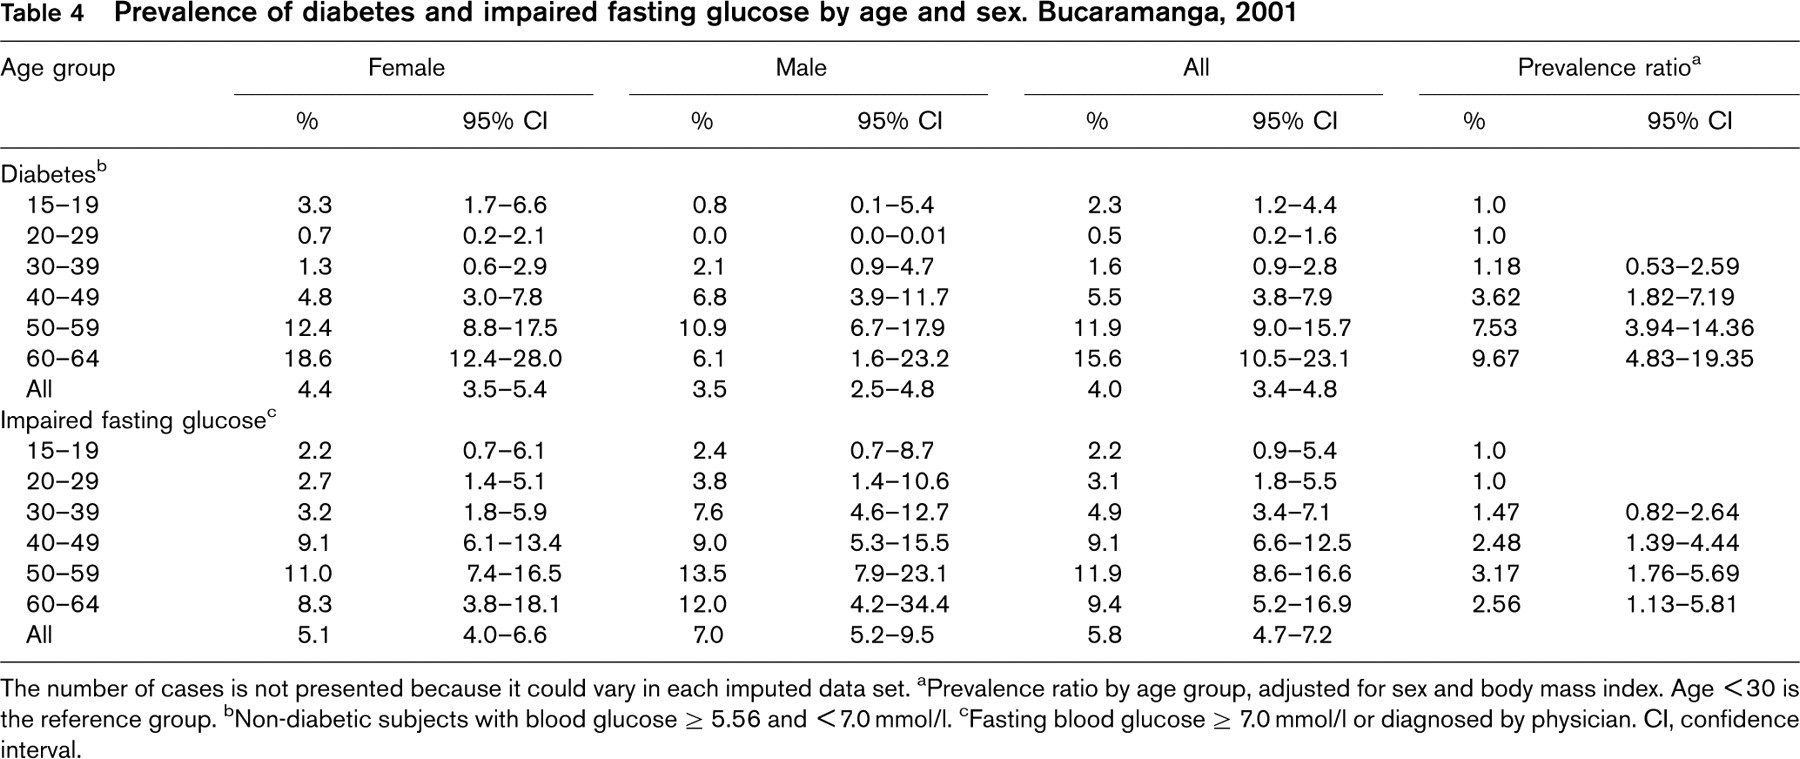
The number of cases is not presented because it could vary in each imputed data set.
aPrevalence ratio by age group, adjusted for sex and body mass index. Age < 30 is the reference group.
bNon-diabetic subjects with blood glucose ≥ 5.56 and < 7.0 mmol/l.
cFasting blood glucose ≥ 7.0 mmol/l or diagnosed by physician.
CI, confidence interval.
Fasting plasma glucose and diabetes
Average fasting glycemia was 4.75 mmol/l (95% CI 4.70–4.80), was very similar in men and women, and increased with age. For similar age and BMI, however, fasting glycemia was 0.14 mmol/l (95% CI 0.04–0.26) higher in men than in women. Four percent of all participants (95% CI 3.4–4.8) had diabetes and 5.8% (95% CI 4.7–7.2) of non-diabetics had IFG (Table 4). After accounting for age and BMI, the prevalence of diabetes was practically identical in both sexes (PR 0.98; 95% CI 0.67–1.44), but women had a significantly higher prevalence of IFG (PR 1.59; 95% CI 1.11–2.26). Finally, the sex and BMI-adjusted prevalence of diabetes increased progressively with age and was almost 10 times higher in those 60–64 years of age than in the under 30-year-olds (Table 4).
Population attributable risk percentages
Estimates of PAR showed that elevated total cholesterol, hypertension, and a large WHR were the major contributors to excess risk of coronary events (Table 5). If any one of these three factors were eliminated in this population, while preserving all other risk factors at their average values, about 19% of all coronary events in the next 10 years would be prevented. Moreover, controlling hypertension or decreasing WHR would result in significantly larger proportions of prevented cases among women than in men (21.3 vs. 15.0%, and 22.2 vs. 14.3%, respectively). One-third of the population had at least one of these three risk factors (33.4%; 95% CI 31.7–35.2%) and simultaneous control of all of them would result in a reduction of 41.2% in the incidence of coronary events, 47.1% in women and 35.1% in men.
Discussion
We have studied the distribution of cardiovascular risk factors in a random sample of young and middle-age subjects from low SES residing in Bucaramanga. Due to the targeted nature of our sample, our results can not be extrapolated to the whole population of Bucaramanga or Colombia. Overall, the level of cardiovascular risk factors was high, considering that the mean age of the participants was only 35 years. Compared to men, women had higher levels of all risk factors, excluding smoking and low-HDL cholesterol.
Random selection of one participant per sampled household resulted in a representative sample of all eligible residents. In fact, the proportions of participants in the 24 strata defined by SES, sex and age were within ± 2.1% of the corresponding proportions of residents. On the other hand, selection bias could have occurred due to non-participation in the physical examination. Since SES, age, sex and self-perceived health status were associated with participation and are likely related to factors measured in the examination, limiting the analysis to subjects with physical examination data could have resulted in selection bias. To minimize this bias we imputed physical examination data and included all subjects in our analysis [14].
Similar to what has been observed in many populations, the prevalence of smoking was significantly higher in men (26%) than in women (10%). The overall prevalence (16.2%), however, was considerably lower than the 30–40% recently reported in other South American urban populations, including Bogotá, Colombia [18]. Moreover, our results suggest that men start smoking earlier than women and that both men and women are now taking up smoking at older ages.
Approximately 10% of the population was hypertensive. This low prevalence is mostly explained by the large fraction of young people in the study sample. In fact, a third of those 50–59 and more than half of those 60–64 years old were hypertensive. A higher prevalence among men at younger ages and similar prevalence in both sexes after age 50 years was observed, a pattern that has been also reported in other populations [19, 20]. In studies in random samples of South American urban populations, using similar case definitions, the prevalence of hypertension varied from 11.1 to 36.9% [21]. Interestingly, the prevalence observed in our study was strikingly similar to that in the CARMEN survey conducted in Chile (9.5 versus 11.1%) [21].
Population attributable risk for different cardiovascular risk factors
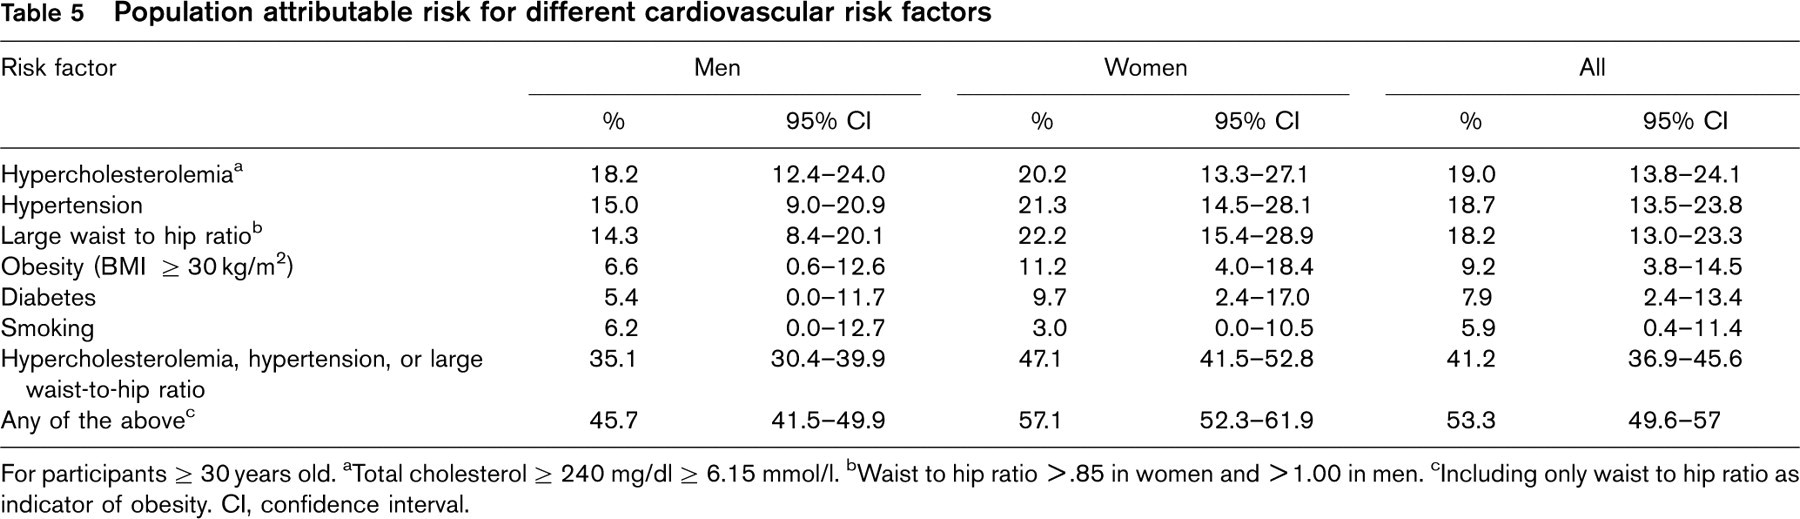
For participants ≥ 30 years old.
aTotal cholesterol ≥ 240 mg/dl ≥ 6.15 mmol/l.
bWaist to hip ratio > .85 in women and > 1.00 in men.
cIncluding only waist to hip ratio as indicator of obesity.
CI, confidence interval.
Even though the prevalence of obesity was low (13%), almost half of the population was overweight or obese. Indeed, the average BMI (25.0 kg/m2) was well over the optimum population mean of 21.0–23.0 kg/m2 [10]. The prevalence of obesity in urban South American populations is highly variable and for selected countries ranges from 12 to 26% in women and from 7 to 26% in men [3]. Women in our study had higher age-adjusted prevalence of obesity as defined by BMI or by waist circumference, a finding that has also been reported in other Latin American populations [21–25]. This could be explained by a greater predisposition in women to accumulate fat tissue than lean tissue when energy intake is greater than output [26].
We observed lower prevalences of high total and high LDL-cholesterol in men, but this sex difference was no longer significant after accounting for age and BMI. On the contrary, the prevalence of low-HDL was considerably higher in men than in women even after adjustment for age and BMI. Data on cholesterol levels in other Latin American populations are particularly scarce. The observed pattern of dyslipidemia, however, was similar to that reported in urban residents of Puriscal, Costa Rica [22], though the prevalence in our population was considerably higher.
The proportion of diabetics was similar in men and women (about 4%) and within the range observed in other urban populations from South America: from 4.0% in Chile to 8.5% in Argentina [3]. On the contrary, the prevalence of IFG was significantly higher among women, even after adjusting by age and BMI. A similar sex-diabetes pattern has been observed in other populations [27, 28].
Based on the analysis of predicted risk derived from the Framingham equation [17], we identified abdominal obesity, hypercholesterolemia and hypertension as the main contributors to cardiovascular risk in this population (attributable risks of about 19% for each factor). Since the baseline risk of coronary events is likely different in the two populations, estimates of risk derived from the Framingham equation are unlikely to reflect the actual incidence of coronary events in Bucaramanga [29]. Nevertheless, our PAR estimates should not be affected, because the predicted risks in the whole population and in the non-exposed population were calculated using the same baseline risk. Estimation of PAR using Framingham scores may be of importance in developing countries where incidence data are particularly scarce. From a public health perspective, weight control should have a high priority in this population, not only because obesity has a high impact on the incidence of coronary events but also because reducing obesity will also decrease cholesterol and blood pressure levels, the other two other risk factors with largest PAR. Further data on people 65 years or older and from higher SES is currently needed.
Footnotes
Acknowledgements
We thank Dr Luz X. Martínez, from the Fundación Cardiovascular del Oriente Colombiano, who interpreted blood tests and provided clinical advice for participants.