
Abstract
Background
Postprandial hyperlipidaemia may be a predictor of vascular risk.
Design
We evaluated postprandial lipaemia after an oral fat tolerance test (OFTT) in men (n = 41) and women (n = 21) with metabolic syndrome (MetS).
Methods
Triglyceride (TG) levels were measured before and 2, 4, 6 and 8 h after the fat load.
Results
Men showed a greater plasma TG response 8 h after the fat load (284 ± 117 versus 224 ± 126 mg/dl, P = 0.029). Only fasting TG levels significantly predicted the TG area under the curve (AUC) and incremental AUC.
Conclusions
Men had a more pronounced postprandial hypertriglyceridaemia and seem to have delayed TG clearance.
Introduction
The prevalence of coronary heart disease (CHD) is higher in men than in women [1]. This has been attributed, at least in part, to gender differences in plasma lipid and lipoprotein concentrations [1]. Furthermore, despite having similar levels of total body fat (in kg), men have been characterized by increased abdominal fat accumulation [2]. Significant gender differences have also been reported in postprandial triglyceride (TG) levels [2, 3].
The remnants of TG-rich lipoproteins accumulated in the postprandial state are involved in atherogenesis [4]. They act as carriers of cholesteryl ester to the vessel wall and are toxic to endothelial cells [5]. Abnormal metabolismlism of postprandial lipoproteins is a common finding in type 2 diabetes [6] and hypertensives [7]. Normally, a postprandial rise in TG levels often occurs due to meal frequency [8], while in hyperlipidaemic subjects this response may be more sustained and extensive [9, 10].
The aim of this study was to evaluate the gender difference in postprandial TG response in men and women with metabolic syndrome (MetS).
Methods
The study population consisted of Greek men (n = 41) and women (n = 21) with MetS. Heavy drinking, liver and renal disease, hypothyroidism and professional sporting activity were exclusion criteria.
All subjects were recruited at their first visit to the lipid clinic and were not taking lipid-lowering drugs. Additionally, none of the women included in the study were on any hormone treatment. However, half of those with hypertension were on antihypertensive medication (diuretics and angiotensin-converting enzyme inhibitors). The diagnosis of MetS was based on the National Cholesterol Education Program Adult Treatment Panel (ATP) III definition [11].
All participants gave their informed consent and the Ethics Committee of the Onassis Cardiac Surgery Center, Athens, Greece, approved the study protocol.
Oral fat tolerance test
The oral fat tolerance test (OFFT) protocol has been described in detail [7]. Since there are no official guidelines, an abnormal TG response to a fatty meal was considered when any of the postprandial TG concentrations (at 2, 4, 6 or 8 h) was higher than the highest TG concentration [219 mg/dl (2.5 mmol/l)] in any hour in any healthy subject in previous studies [5, 7]. Body mass index (BMI) was calculated as weight divided by height squared (kg/m2). We assessed the whole-body insulin resistance using the following formulas: index of homeostasis model of insulin resistance (HOMA-IR) = fasting glucose fasting insulin/22.5, and the quantitative insulin sensitivity check index (QUICKI) parameter as 1/log insulin + log glucose in mg/dl [7].
Statistical analysis
Categorical variables are presented as percentages. Values of numerical characteristics were tested for normality and are presented as mean ± standard deviation, when they are normally distributed. The t-test for independent samples or the Mann-Whitney U-test, as appropriate, was used for the comparison of numerical values between two groups. Areas under the curve (AUC), as well as incremental AUC (i-AUC), for serial measurements of TG levels at baseline and after the OFTT were calculated using the trapezoid rule. The i-AUC was determined as the area between the postprandial curve for TG concentration and the line representing the fasting TG concentration at 0 h. Linear regression analysis was performed to determine the predictors of elevated AUC or i-AUC values; age, BMI, high-density lipoprotein (HDL) cholesterol, fasting TG, fasting glucose, HOMA-IR and QUICKI were the independent variables tested. Spearman's correlation analysis was performed to assess correlations between different numerical variables. Significance was set at P <0.05.
Results
The physical and metabolic characteristics of the patients are shown in Table 1. Men were 6 years younger than women (P = 0.004). As a MetS group, the subjects were abdominally obese, as indicated by the mean values of waist circumference. Although no gender difference was noticed in BMI, men had a significantly increased waist circumference compared to women. Men also had significantly lower HDL cholesterol levels. A significantly higher frequency of smoking was observed in men (61%) compared to women (14%). Thirty-six (87.8%) men and 16 (76.2%) women had an abnormal postprandial response. When comparing non-smoker men (n = 16) with non-smoker women (n = 18), men had a higher AUC value [2485 (1104) versus 1795 (705), P = 0.039], while there were no significant differences in fasting and postprandial TG levels between smoker and non-smoker men.
Clinical characteristics of the study population
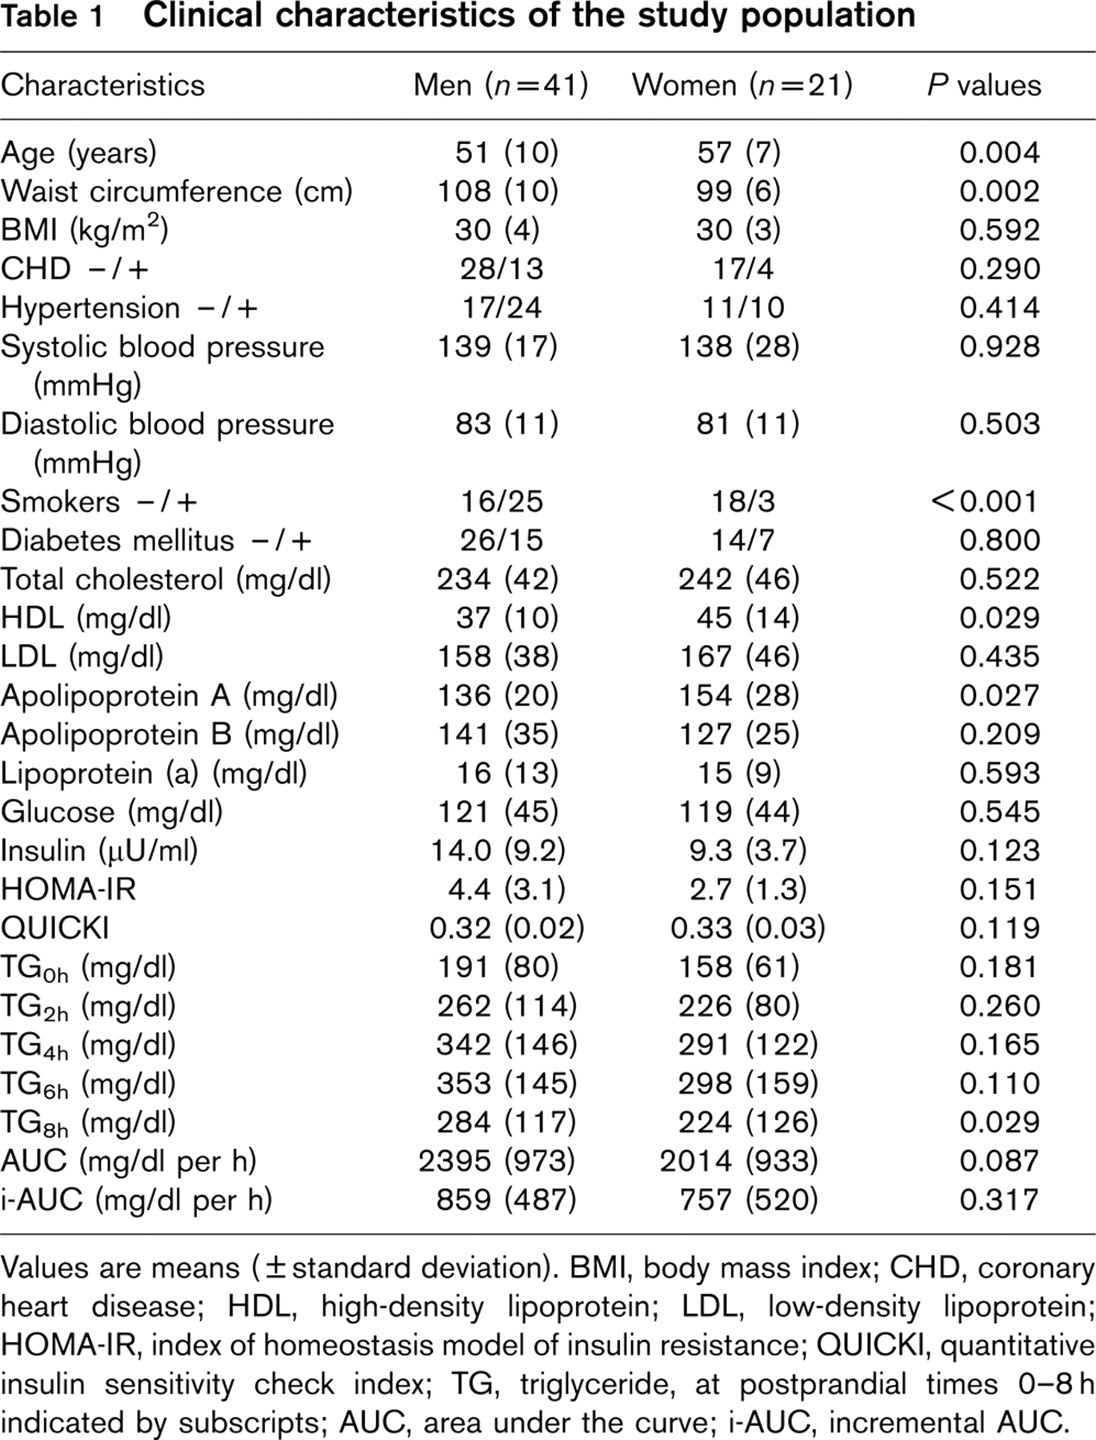
Values are means (± standard deviation). BMI, body mass index; CHD, coronary heart disease; HDL, high-density lipoprotein; LDL, low-density lipoprotein; HOMA-IR, index of homeostasis model of insulin resistance; QUICKI, quantitative insulin sensitivity check index; TG, triglyceride, at postprandial times 0–8 h indicated by subscripts; AUC, area under the curve; i-AUC, incremental AUC.
No significant differences between men and women were found in TG levels 2, 4 and 6h after the OFTT; at 8 h, men had significantly higher values (P = 0.029) (Table 1).
In linear regression analysis, where the AUC or the i-AUC was the dependent variable and age, BMI, HDL cholesterol, fasting TG, HOMA-IR, and QUICKI were the independent variables, only fasting TG levels were independently associated with high AUC (coefficient B = 11.126, P <0.001) and i-AUC values (coefficient B = 3.348, P = 0.002).
There was a significant correlation between i-AUC and fasting TG concentration (r = 0.505, P <0.001) and an inverse correlation between HDL cholesterol levels and TG concentration 6 h (r = −0.274, P = 0.031) and 8 h (r = −0.297, p = 0.023) after the fatty meal.
Discussion
We found a slower clearance of TG-rich lipoproteins postprandially in men with MetS compared with MetS women. There was no difference in the absorption phase between genders. Linear regression analysis showed that for every rise of 1 mg/dl (0.01 mmol/l) of the fasting TG values, the AUC increased by 11 mg/dl per h (0.12 mmol/l per h).
The gender differences in TG levels at the eighth hour of the OFTT, which reflects TG clearance [5], could be attributed to three reasons. First, MetS men had lower fasting HDL levels compared with MetS women, and fasting HDL cholesterol levels were inversely correlated with postprandial TG concentration at 6 and 8 h. It has been reported that a low fasting HDL concentration is associated with a delayed TG clearance compared with normal fasting HDL values, even if fasting TG levels are normal [12, 13]. Elevated plasma TG concentration at any state (fasting/postprandially) seems to promote the cholesteryl ester exchange reactions mediated by cholesteryl ester transfer protein (CETP) [14]. It is possible that during transient hypertriglyceridaemia, the HDL particles are TG-enriched via CETP-mediated exchange with TG-rich lipoproteins. HDL-TG-rich particles are cleared more rapidly from the circulation, leading to low serum fasting HDL cholesterol levels [15].
Second, the high TG and low HDL cholesterol phenotype has been frequently reported in subjects with ‘abdominal’ obesity [16]. The delayed clearance of TGs, observed in obese subjects, can be explained by elevated fasting TG levels, which lead to saturation of lipoprotein lipase and delayed clearance of chylomicron remnants; and a progressive increase in plasma free fatty acid levels after consuming the fatty meal, whereas in women, plasma free fatty acid levels at the end of the postprandial period are close to fasting concentrations [2]. According to Couillard et al. [2], despite a similar amount of total body fat (in kg), men are usually characterized by increased abdominal fat accumulation, as in our study (MetS women had a typical pear shape).
Third, the selection of non-age-matched subjects theoretically could be a limitation, since there are studies suggesting that age influences the postprandial TG response [3]. However, in linear regression analysis, the AUC values were independent of age, and in analysis of covariance, TG levels were not affected by the difference in age between the two groups. Moreover, the group of men in the present study had a worse TG clearance than women despite a significantly younger age.
Insulin resistance is associated with dyslipidaemia [17]. In our study, the HOMA-IR and QUICKI methods were used to assess insulin resistance. HOMA-IR is accepted as a marker of insulin resistance [18] and this index correlated significantly with the euglycaemic hyperinsulinaemic clamp [19]. The new QUICKI method [20] is a simple and accurate way for insulin resistance diagnosis in clinical and epidemiological practice [21]. Neither of these values correlated with the TG AUC in our study.
Smoking has been incriminated for raising fasting [22] and postprandial [23] TG levels. In the present study, there was no significant difference in the postprandial TG response between smoker and non-smoker men. Zaratin et al. [24] showed that oral fat tolerance is not altered in smokers, although an upregulation of the rate of metabolism of the TG-rich lipoproteins is observed immediately after smoking one cigarette. In our study postprandial responses were probably not affected, since they were not exposed to acute smoking.
The gender difference observed in the current study is new. However, the small number of MetS women in relation to MetS men can be considered as a limitation. Therefore, comparison of a greater number of subjects is needed to draw definite conclusions.
In conclusion, men had a more pronounced abnormal postprandial lipaemia, displaying delayed clearance of postprandial TG when compared with MetS women. The fasting TG concentration was the main determinant of postprandial hyperlipidaemia, which is probably another metabolic disturbance associated with the MetS.