






Abstract
Aims
To evaluate the predictive accuracy of the Systematic Coronary Risk Evaluation (SCORE) project high-risk function in Norway.
Methods and results
We included 57229 individuals screened in 1985-1992 from two population-based surveys in Norway (age groups 40-49, 50-59, and 60-69 years). The data have been linked to the Norwegian Cause of Death Registry. The SCORE high-risk algorithm for the prediction of 10-year cardiovascular disease (CVD) mortality was applied, and the risk factors entered into the model were age, sex, total cholesterol, systolic blood pressure, and smoking (yes/no). The number of expected events estimated by the SCORE model (E) was compared with the observed numbers (O). The SCORE low-risk algorithm was studied for comparison. In men, the observed number of CVD deaths was 718, compared with 1464 estimated by the SCORE high-risk function (O/E ratios 0.53, 0.53 and 0.45, for age groups 40-49, 50-59 and 60-69, respectively). In women, the observed and expected numbers were 226 and 547. The O/E ratios decreased with age (ratios 0.60, 0.45 and 0.37, respectively), i.e. the overestimation increased with age. The low-risk function predicted reasonably well for men (ratios 0.85, 0.92 and 0.79, respectively), whereas an overestimation was found for women aged 50-59 and 60-69 years (ratios 0.69 and 0.56, respectively).
Conclusion
The SCORE high-risk model overestimated the number of CVD deaths in Norway. Before implementation in clinical practice, proper adjustments to national levels are required.
Introduction
Cardiovascular disease (CVD) continues to be one of the leading causes of death in Europe. Several risk estimation models based on classic risk factors have been developed for clinical practice to assess the CVD risk in asymptomatic individuals [1–4]. The Framingham risk function was based on the Framingham Heart Study in the United States [1], and was included in European guidelines for primary prevention in 1994 and 1998 [5–7], but several studies have found this risk function to overestimate risk in both high and low-risk populations in Europe [8–10]. Therefore the Systematic Coronary Risk Evaluation (SCORE) project risk function was developed on the basis of European cohort studies [11], and the risk charts developed from the SCORE algorithm were included in the most recent European guidelines on CVD prevention in clinical practice [European Society of Cardiology (ESC) guidelines] issued by the Third Joint Task Force in 2003 [12]. This risk model estimates the 10-year risk of a fatal atherosclerotic CVD event, based on age, sex, blood pressure, serum cholesterol level and smoking habits. Individuals with a 10-year risk of fatal CVD of 5% or greater are by definition at high risk and are eligible for primary prevention. Separate risk charts have been developed for low and high-risk regions in Europe. The high-risk chart for northern Europe includes Norway. The Norwegian data included in the SCORE project were collected in the period 1974-1978. However, the cardiovascular mortality has declined in Norway and several other European populations during recent decades (http://data.euro.who.int/hfamdb/). Risk estimates based on cohort studies that started more than 20 years ago are thus likely to overestimate cardiovascular risk [13, 14]. Therefore, the Norwegian Society of Cardiology recommended that the new guidelines should not be implemented until the predictive accuracy of the model had been validated in population studies in Norway (http://www.hjerte.no). Recent studies have shown that implementation of the new guidelines, including the SCORE model, would classify a high proportion of Norwegians as high-risk individuals [15, 16]. Moreover, a study from Hartz et al. [17] suggested that the consequences could be a doubling of Norwegian individuals on primary preventive drugs. The predictive accuracy of the SCORE high-risk model has not yet been studied in Norway.
Large population-based surveys conducted in Norway in 1985-1992 linked to the Norwegian Cause of Death Registry gave us the opportunity to investigate the predictive accuracy of the SCORE high-risk function in the Norwegian population.
Methods
The SCORE project has provided charts for the 10-year risk of fatal CVD in individuals aged 40-65 years. In the present study we will focus on those aged 40-69 years. The study subjects were obtained from two population-based surveys in Norway, The Norwegian Counties Study and the Cardiovascular Program in Norway, conducted by the Norwegian National Health Screening Services.
The Norwegian Counties Study
Three cardiovascular screenings in three Norwegian counties (Oppland, Sogn og Fjordane, and Finnmark) were performed in 1974-1978, 1977-1983 and 19851988. In the first screening all individuals aged 35-49 years, and random samples of 20-34-year-old individuals were invited [18]. Data from the first screening with follow-up to 1992 were included in the SCORE project, and together with other European cohort studies, these data formed the basis for the SCORE risk algorithm [11]. The sample invited to the second and third screening was a combination of previous participants and new cohorts. In the present paper we will use participants who were aged 40-59 years at the third screening. In all three counties all inhabitants aged 40-54 years were invited. In addition, all individuals aged 55-59 years were invited in Finnmark, whereas a 10% random sample of individuals aged 55-59 years who had previously been invited to the second screening were invited in each of the two other counties.
Selection of study sample from the Norwegian cardiovascular disease surveys

aSubjects screened after 1992 were excluded in the present study because of less than 10 years of follow-up (n = 3154).
bSome subjects are registered on several of the exclusion criteria, thus the sum eligible for analyses is not a result of simple subtraction from 56006 and 11 850, respectively.
cNot recorded in The Cardiovascular Program in Norway.
d92% of the 60-69 year olds were aged 65-67 years at screening.
Altogether, 56 006 subjects aged 40-59 years were screened. The attendance rate was 86.6% (Table 1). Of these, 60% had also participated in the first screening. The data were linked to the Norwegian Cause of Death Registry with follow-up until 1 January 2001 (see the Definition of endpoints section).
The Cardiovascular Program in Norway
The Cardiovascular Program in Norway in 1985-1994 covered all men and women aged 40-42 years from all counties except for the capital of Oslo [19]. In addition, all individuals aged 65-67 years in the counties Horda-land, Møre og Romsdal and Nord-Trøndelag were invited during 1989-1993. Furthermore, in some municipalities broader age groups were invited.
Altogether 15 004 individuals aged 60-69 years attended in this program with a participation rate of 77%. The individuals have been followed with respect to death until 1 January 2003 through linkage to the Norwegian Cause of Death Registry (see the Definition of end-points section). To obtain a complete 10-year follow-up, participants screened later than 1992 were excluded. A total of 11 850 individuals aged 60-69 years are thus included in this study (Table 1).
Study sample
The new guidelines advise that the risk chart be used for asymptomatic individuals [12]. We have therefore excluded individuals who reported a history of myocardial infarction, angina pectoris, stroke or diabetes. We also excluded individuals on drug treatment for hypertension and users of nitroglycerine (Table 1). In our view these groups of individuals would be under medical supervision. Some individuals had missing information on some of the major risk factors and were therefore excluded. A total of 49 144 individuals aged 40-59 years from the Norwegian Counties Study and 8085 individuals aged 60-69 years from the Cardiovascular Program were thus included in the analyses. We emphasize that 92% of the latter group were aged 65-67 years.
Data collection
The screenings were carried out by mobile team personnel who operated according to a standardized procedure. The questionnaire was on the back of the invitation letter. This was filled in at home and taken to the screening site where it was checked for omissions and inconsistencies. The questionnaire included detailed questions on smoking habits. Height and weight were measured using an electronic device, with the participants wearing light clothes without shoes. Systolic and diastolic blood pressure were measured using a Dinamap 845XT (Criticon Inc., Tampa, Florida, USA). Three readings were taken at 1-min intervals, and the mean of the last two readings was used in the analysis. A non-fasting venous blood sample was drawn and analysed for serum total cholesterol, high-density lipoprotein cholesterol and triglycerides. All analyses were performed at the same laboratory using enzymatic methods [20].
Definition of endpoints
The linkage to the Cause of Death Registry was ensured by the unique 11-digit identification number of all Norwegian citizens. This linkage was approved by the Norwegian Data Inspectorate. In line with Conroy et al. [11] atherosclerotic cardiovascular death was defined as International Classification of Disease version 9 codes 401-414, 426-443, with the exception of 426.7, 429.0, 430.0, 432.1, 437.3, 437.4, and 437.5. In addition, sudden death of unknown cause, 798.1, was included. The corresponding codes for International Classification of Disease version 10 were I10-I25, I44-I51, I61-I73, and R96 (R. Conroy, personal communication). The reason for including sudden death of unknown cause as an endpoint is that it has been shown that the epidemiology of fatal coronary heart disease is similar to the epidemiology of sudden death in middle-aged Norwegian men [21].
Statistical analyses
The applicability of the SCORE risk function to the present Norwegian populations was studied in three steps.
First, the expected number of atherosclerotic CVD deaths was calculated using the SCORE algorithm with the high-risk coefficients [11], as Norway is considered a high-risk country in the ESC guidelines [12]. For comparison, we also reported the risk estimates calculated by the SCORE low-risk function. Age at screening, sex, serum total cholesterol, blood pressure, and dichotomized smoking were used in the model. Smoking was defined as the daily use of cigarettes, cigars or a pipe (yes/no). The expected number of CVD deaths was calculated as the sum of individual absolute risks. The observed number of deaths was obtained from the Norwegian Cause of Death Registry. The ratios of observed versus expected number of events (O/E ratio) were stratified by age and sex.
Second, we categorized the participants into quintiles of estimated SCORE risk (high-risk model), and compared the expected and observed number of events in each quintile, stratified by age and sex.
Third, we studied the ability of the SCORE risk function to separate high-risk from low-risk subjects (discrimination). The area under the receiver operating characteristic (ROC) curve was estimated for the high-risk SCORE function across age groups and sex.
The statistical analyses were performed using SPSS version 12.0.1 (SPSS Inc., Chicago, Illinois, USA). The figure was prepared using STATA version 9.0 (StataCorp LP, College Station, Texas, USA).
Results
The baseline characteristics of the study sample by sex and age are given in Table 2.
Expected versus observed cardiovascular disease deaths
The observed number of CVD deaths in men was 718, only half the number expected according to the SCORE model, 1464 (Table 3). The ratio observed over expected (O/E) was similar in all age groups of men (ranging from 0.45 to 0.53). For the low-risk model, however, a better agreement between the observed and expected number of deaths was found (O/E ratios ranging from 0.79 to 0.92). As expected, women had a substantially lower (age-specific) CVD mortality than men. Also for women an overestimation was observed for the high-risk model, and the total number of observed deaths was 226 compared with the 547 expected. The ratio decreased by age, i.e. the overestimation increased with age (O/E ratios of 0.60, 0.45 and 0.37, in the age groups 40-49, 50-59 and 60-69, respectively). Overestimation increased by age also for the low-risk model in women. The overestimation was considerable in the two oldest age groups (ratios 0.69 and 0.56, respectively).
Figure 1 shows the expected and observed numbers of CVD deaths by quintiles of estimated SCORE risk (high-risk model). The high-risk model overestimated deaths in both men and women in all age groups, and in all quintiles, except in the first quintile of 40-49-year-old women. Of note is the fact that there was a limited number of deaths in the lowest risk quintiles for the youngest women, thus the estimates in these quintiles are associated with more uncertainty. For men, the low-risk model performed fairly well in all quintiles of risk, with few exceptions. For women, the low-risk model performed reasonably well only in the age group 40-49 years, whereas overestimation was observed in the two oldest age groups.
Discrimination
Table 4 reports the ability of the SCORE high-risk model to separate high-risk from low-risk subjects in the two Norwegian cohorts. The area under the ROC curve ranged from 0.65 to 0.72, and all values were significantly different from 0.5 (P ≤ 0.001). Similar results were found for the low-risk model (data not shown).
Levels of risk factors among men and women in the study sample presented as mean (SD)
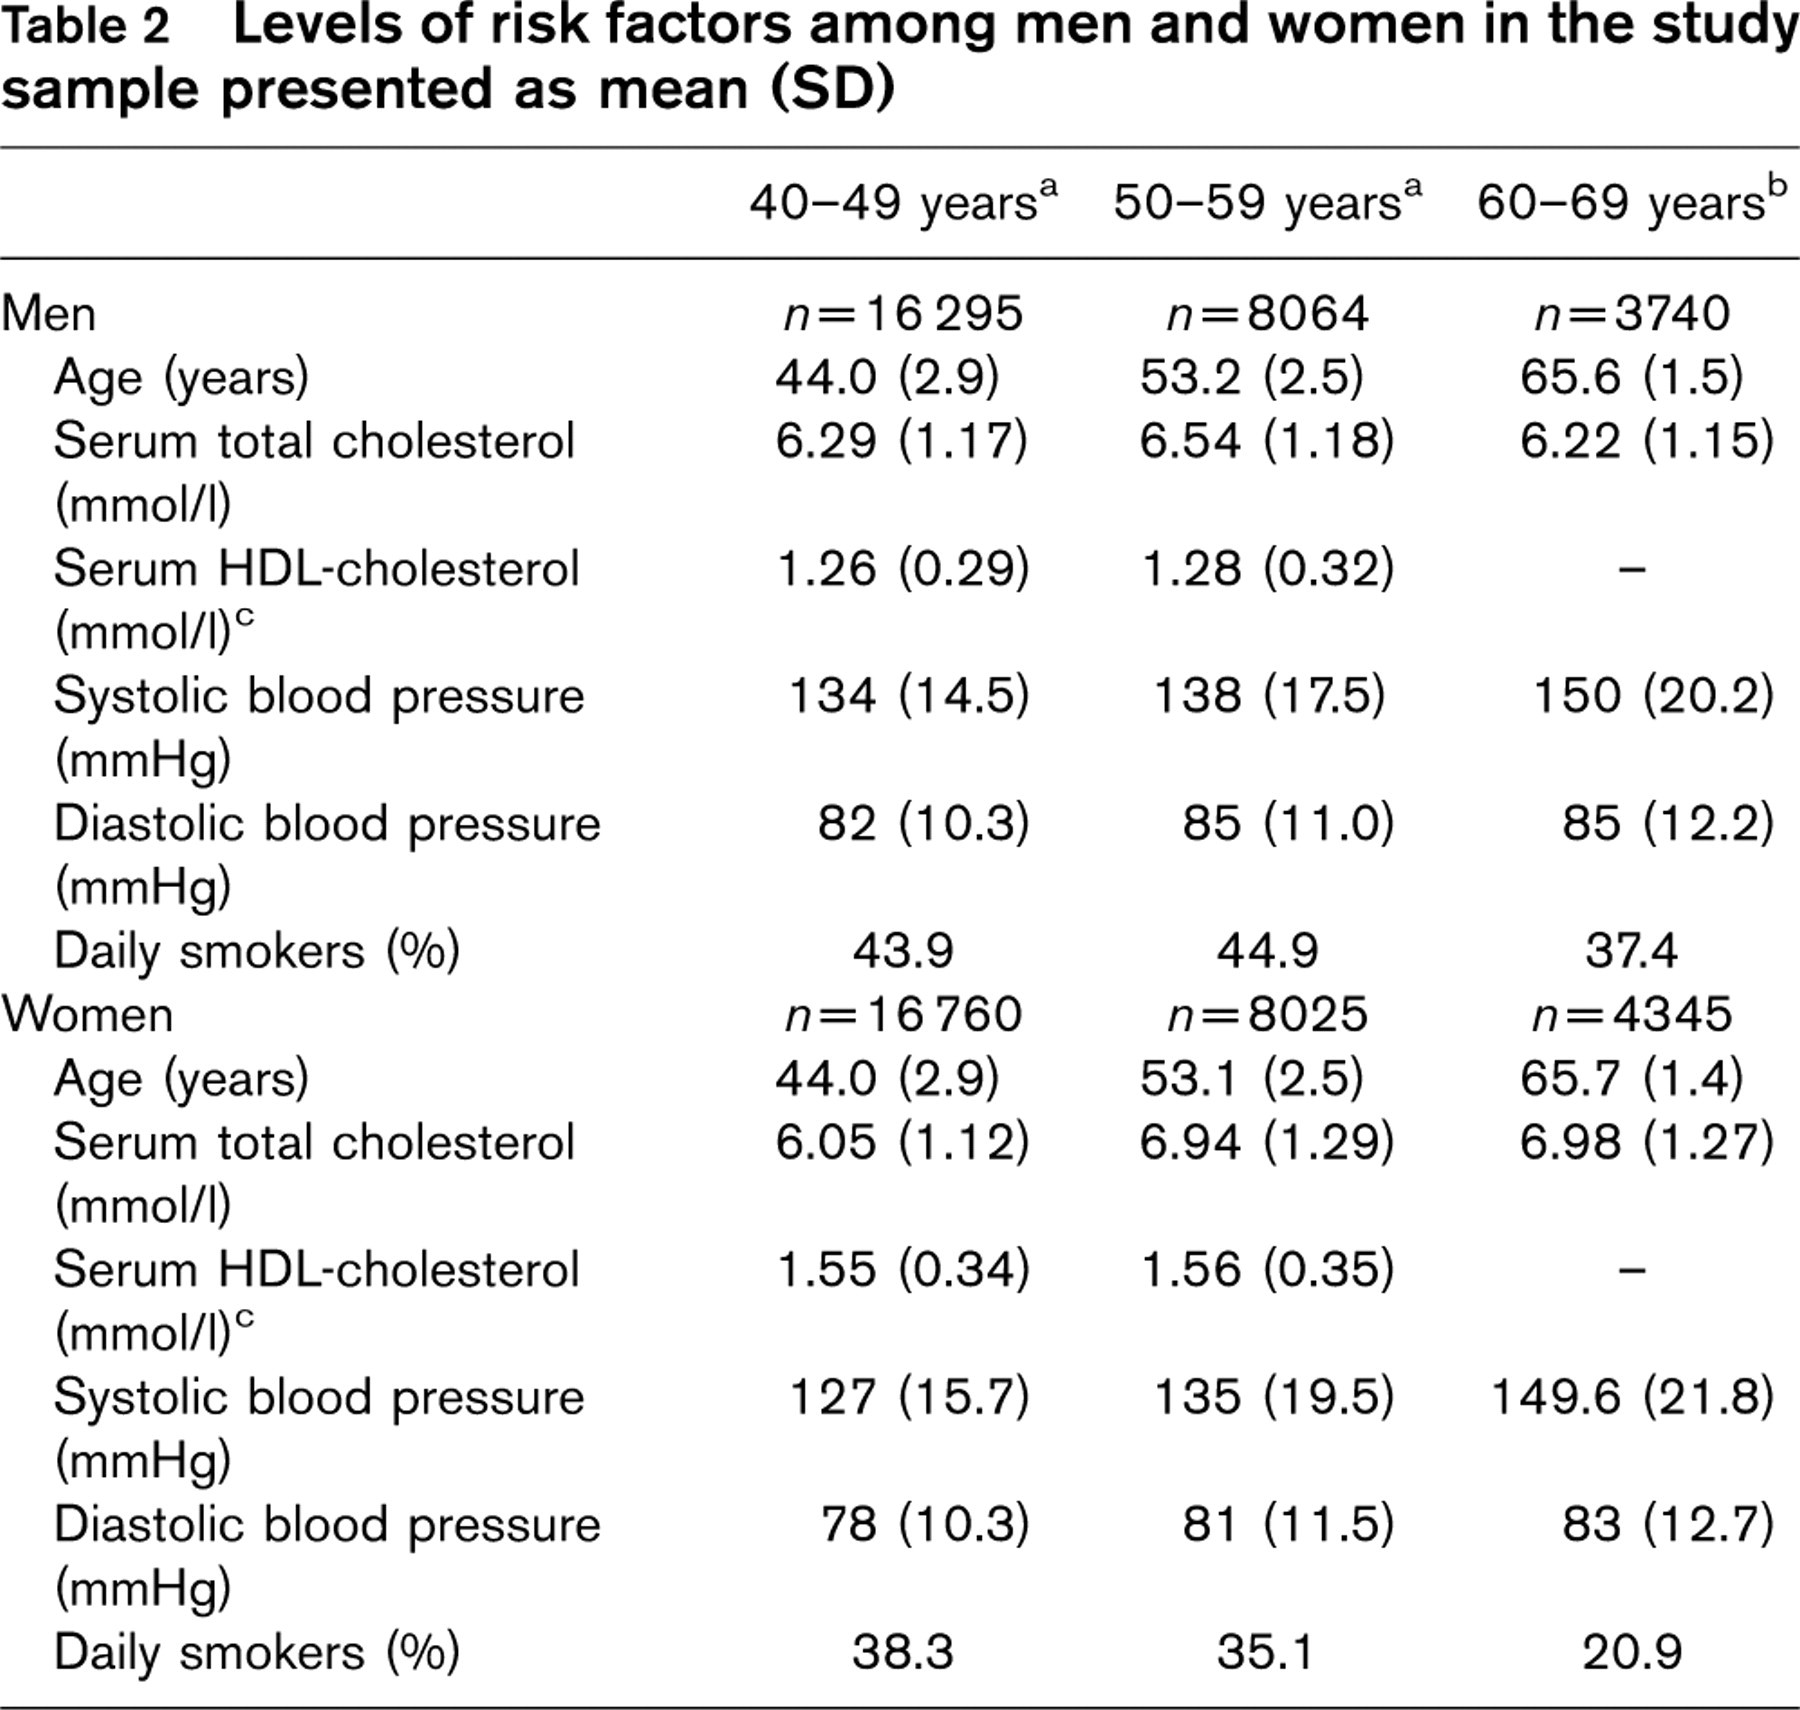
HDL, High-density lipoprotein.
aThe Norwegian Counties Study (1985-1988).
bThe Cardiovascular Program in Norway (1989-1992).
cNot recorded in The Cardiovascular Program in Norway.
Discussion
During a period with decreasing CVD mortality, the SCORE high-risk function overestimated CVD mortality in Norway. Whereas the overestimation among men seems unaffected by age, the overestimation increased with age in women. The low-risk model predicted CVD mortality reasonably well in men, but overestimated mortality among the eldest women.
Our findings regarding the high-risk function are in accordance with a recent study by Neuhauser et al. [22], in which the authors reported the high-risk function to overestimate risk in a German population. We have previously, in accordance with Neuhauser et al. [22], compared the predicted mortality in a study sample from a cross-sectional health screening with observed mortality in the general Norwegian population [16]. We also found that the high-risk function overestimated risk. The problem with these comparisons is that the general population consists of individuals with previous CVD. Furthermore, using yearly mortality rates from a national database to calculate 10-year mortality may be different from following an actual cohort over time. In the present study, we have compared the observed and predicted mortality within the same cohort, which included only participants with no CVD at baseline.
Although Norway was considered a high-risk country in the SCORE project, we also applied the low-risk function on the study subjects. In men, the low-risk function performed reasonably well (O/E ratios were 0.79-0.92); however, in the two oldest female groups risk was overestimated (O/E ratios 0.69 and 0.56 in the age groups 50-59 and 60-69, respectively). It was recently reported that the low-risk model overestimated risk in Austria, which is considered a low-risk country; however, the predictive ability was nevertheless considered fairly good as evaluated by the area under the ROC curve (0.76-0.80) [23]. In the present study, the area under the ROC curves for the high-risk function ranged from 0.65 to 0.72, which is lower than reported from Austria [23], and also slightly lower than for the high-risk model in the original publication (range 0.70-0.72 for individual high-risk countries) [11].
Observed and expected number of cardiovascular disease deaths in the study sample

CI, Confidence interval; E, expected; O, observed; SCORE, Systematic Coronary Risk Evaluation project.
aThe Norwegian Counties Study (1985-1988).
bThe Cardiovascular Program in Norway (1989-1992).
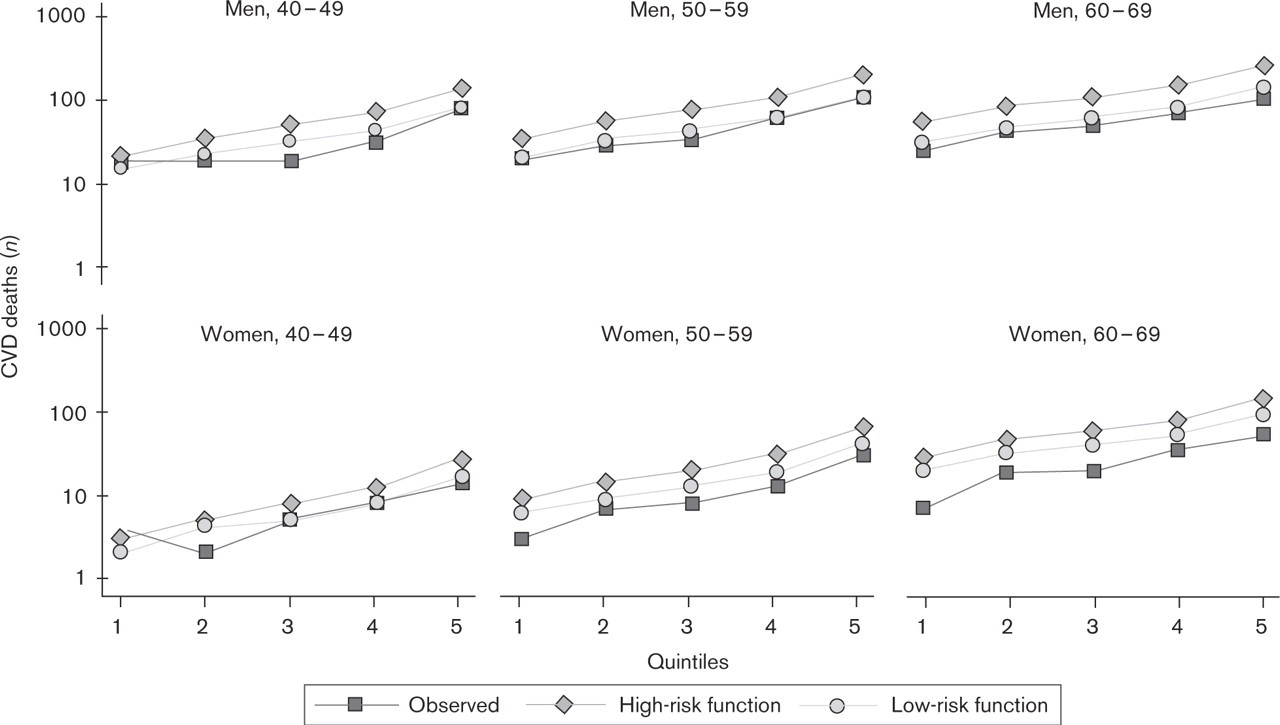
Observed and expected cardiovascular disease (CVD) deaths according to SCORE high-risk and low-risk function in men and women by quintiles of 10-year cardiovascular disease risk.
The area under the receiver operating characteristic curve for the high-risk Systematic Coronary Risk Evaluation (SCORE) project model according to sex and age
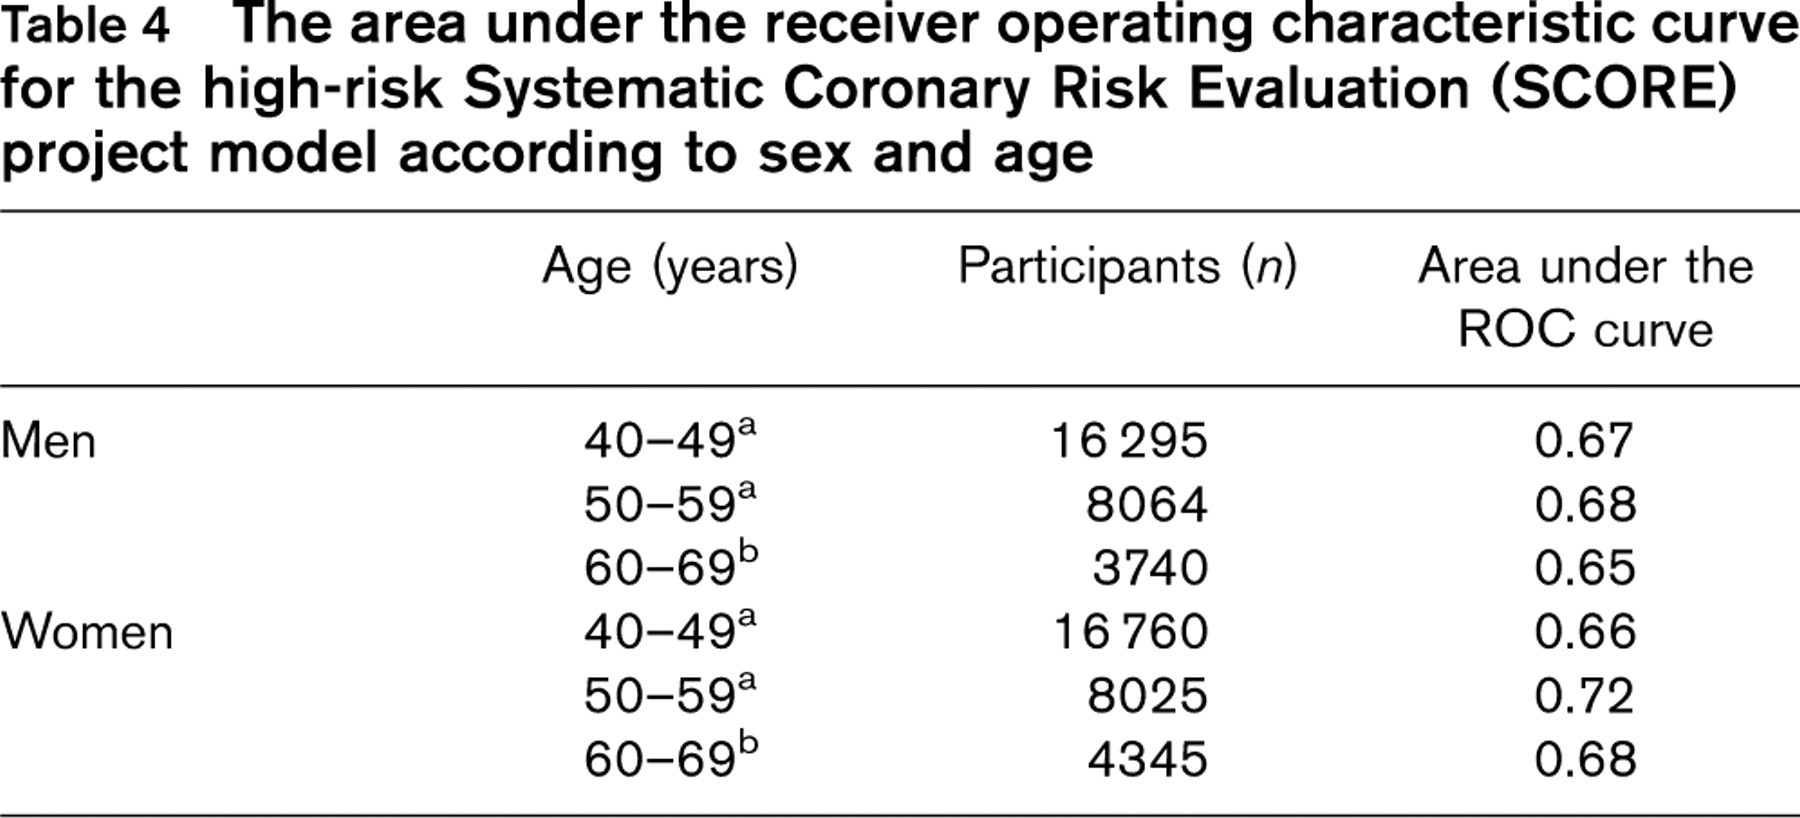
ROC, Receiver operating characteristic.
aThe Norwegian Counties Study (1985-1988).
bThe Cardiovascular Program in Norway (1989-1992).
We previously found that the SCORE high-risk model will classify the majority of Norwegian adults screened in 2000-2003 as high-risk individual [16]. This is in accordance with other recent Norwegian studies showing that implementation of the ESC guidelines would classify most adult Norwegians at high risk of fatal CVD [15, 17]. Accordingly, implementation of the ESC guidelines could lead to a substantial increase of subjects in Norway using primary preventive drugs, especially the use of lipid-lowering drugs in elderly men [17]. The new thresholds for risk defined in the ESC guidelines have been subject to a considerable debate (www.bmj.org) [24], and validation of the SCORE model is warranted [22, 25].
The risk estimates based on cohort studies that started 20-30 years ago are likely to overestimate risk, as comprehensively discussed by Hense and colleagues [13, 14]. The Norwegian data included in the SCORE project were data from the first screening in the Norwegian Counties Study, with a follow-up until 1992 (see Methods section for details on the three consecutive screenings). Approximately 60% of the subjects we included from the third screening in the present study (subjects aged 40-59 years) also participated in the first screening. However, the present study mainly consists of subjects from age groups in which all inhabitants were invited, regardless of previous screenings, and as the attendance was high (86.6%) the present study sample represents the majority of individuals residing in the selected counties in 1985-1988 in the age group 40-59 years. Moreover, 40% of the study participants were not included in the original SCORE project; the present follow-up started 10-13 years later and was in a period with declining cardiovascular mortality. This may explain the overestimation seen for the SCORE high-risk function in the present study.
The mortality from all causes and ischaemic heart disease in the three counties included in the Norwegian Counties Study were found to be similar to the national levels [26]. Also for the counties included in the Cardiovascular Program in Norway, the mortality was found to be similar to the general Norwegian population (http://statbank.ssb.no//statistikkbanken/default_fr.asp?PLanguage=1). As the attendance in both screenings was high (86.6 and 77%), we argue that the present study sample is representative of Norway.
The remarkable decline in CVD mortality rates in Norway over the past 30 years (http://data.euro.who.int/hfamdb/) can only partly be explained by a combination of a reduction in risk factors such as cholesterol [27], blood pressure [28] and smoking (http://www.norgeshelsa.no/norgeshelsa/index.jsp). Improved primary and secondary medical care have also influenced the cardiovascular mortality level.
The suggested solution to overcome the sensitivity of the SCORE model to the declining mortality rates is to adjust the SCORE model to national conditions, as suggested in the guidelines [12]. This has been done in several other countries [29–32]. The case for the development of population-specific risk functions has also been argued strongly by others [14, 33, 34], and we are currently performing adjustments of the SCORE risk model in Norway. Recalibration of the Framingham function, which overestimates risk in both high and low-risk regions of Europe as well as in other ethnic groups [9, 13, 33–37], has also proved successful [36–38].
In conclusion, this study demonstrates that the SCORE high-risk function overestimated the CVD mortality in Norwegian cohorts followed in the periods 1985-2000 and 1989-2002, whereas the low-risk model only overestimated mortality in the oldest women. Our results thus confirm the need for national recalibration of the SCORE model before implementation in clinical practice.
Footnotes
Acknowledgements
The authors would like to thank the participants for their valuable contribution. They also wish to thank Kjell Bjartveit, Per G. Lund-Larsen, the staff at the former National Health Screening Service in Oslo, and the Institute of Community Medicine, University of Tromsø for carrying out the screenings. The present work was funded by a grant to A.S.L. by the Norwegian Research Council (post.doc grant).
There are no conflicts of interest, and the authors do not have any financial interest in the article.