
Abstract
Background
Down syndrome (DS) is a risk factor for metabolic syndrome and cardiovascular disease. The greater oxidative stress described in DS can increase this risk owing to its potential deleterious effects on insulin sensitivity. We hypothesized that metabolic syndrome or its markers, at rest and during exercise, are more pronounced in young adults with DS.
Design
The study design is that of a controlled study.
Methods
Thirteen physically active young adults with DS, after overnight polysomnography, plasma-lipid profile, and insulin-resistance [Homeostasis Model Assessment Insulin Resistance (HOMA-IR)] assessments, underwent a sub-maximal progressive treadmill exercise (10 min at 30 and 50%, and 20 min at 75% of Vo2 max), allowing for maximal fat-oxidation rate and blood-oxidative stress determinations. They were compared with 15 healthy control participants (C).
Results
Vo2 max of DS participants was lower than that of C (60.8 ±2.4 versus 44.4 ± 3.3 ml/kg/min; P < 0.001) but was close to the predicted value (95 ±6%). In DS participants, as expected, oxidative stress was greater than in C (+ 15%; P < 0.001) at rest and all through the exercise protocol. Although a greater fat mass (DS: 19.9 ±1.3%; C: 13.5 ±0.9%; P < 0.001), and a lower insulin sensitivity (HOMA-IR in DS: 1.09±0.16; in C: 0.64±0.13; P < 0.05) was observed for DS participants, a metabolic syndrome could not be shown. Maximal fat-oxidation rate was lower in DS participants (394.2 ±69.9 versus 486.1 ±134.8mg/min in C; P < 0.01), but it was in the normal range.
Conclusion
Despite greater oxidative stress and lower insulin sensitivity, the DS group involved in our study did not display clear metabolic abnormalities. The young age and lifestyle of this group might, partially, have accounted for this apparently healthy metabolic status.
Keywords
Introduction
Mental retardation has been associated with metabolic syndrome, especially in individuals living in community settings [1]. This tendency, which might be due to lifestyle, increases the risk of cardiovascular disease [2]. Moreover, insulin resistance (IR), a feature of metabolic syndrome, has been associated with a decrease in the ability of muscles to oxidize fat [3, 4].
In Down syndrome (DS), metabolic syndrome might be even more prevalent, as it has been frequently associated with an alteration in lipid profile [5–7] and obesity due to endocrine disorders [8]. In addition, a high level of oxidative stress has been clearly demonstrated in DS participants as a result of an overexpression of Cu-Zn superoxide dismutase (SOD1), the activity of which might be increased by 50% [9–11]. Moreover, this oxidative stress can be exacerbated in DS participants by the frequently observed obstructive apnoea syndrome during sleep (OSAS) [12], known to induce intermittent hypoxia episodes [13]. The resulting increased oxidative stress might thus be associated with IR [14, 15] and other features of metabolic syndrome such as atherosclerosis [16], hypertension [17] and obesity [18] in DS participants.
We hypothesized that metabolic syndrome or its markers are more pronounced in DS participants, and that they are related to greater oxidative stress. To verify this hypothesis, we explored a DS group at rest (polysomnogram, fasting lipid profile and insulin sensitivity) and during exercise (redox balance indexes and lipid-oxidation rate), and compared the results with those of a healthy control group (C).
Materials and methods
Participants
Twenty-eight male subjects participated in this study: 13 were adults with DS (free and homogeneous trisomy of the distal band 21q22-1, 22-2 of chromosome 21) and 15 were healthy control participants. The characteristics of the two groups are presented in Table 1. A clinical examination ensured that the participants presented no contraindication to intense and prolonged exercise or severe disease.
All participants with DS lived in community settings with their parents and were recruited from two local mental-deficiency associations. The control participants were physical education students. All participants were physically active, and the number of exercise sessions did not differ between the two groups, although it was slightly lower in DS participants. For both groups, sport sessions or physical activity consisted of at least 1 h of moderate-to-intense exercise (e.g. jogging, circus, stroll, cycle ride, trekkingy) weekly.
All participants, as well as the legal representatives of the DS participants, received information and signed an informed consent. This study was approved by the local ethics committee (no. 9-03 CMJL 1).
Participant characteristics
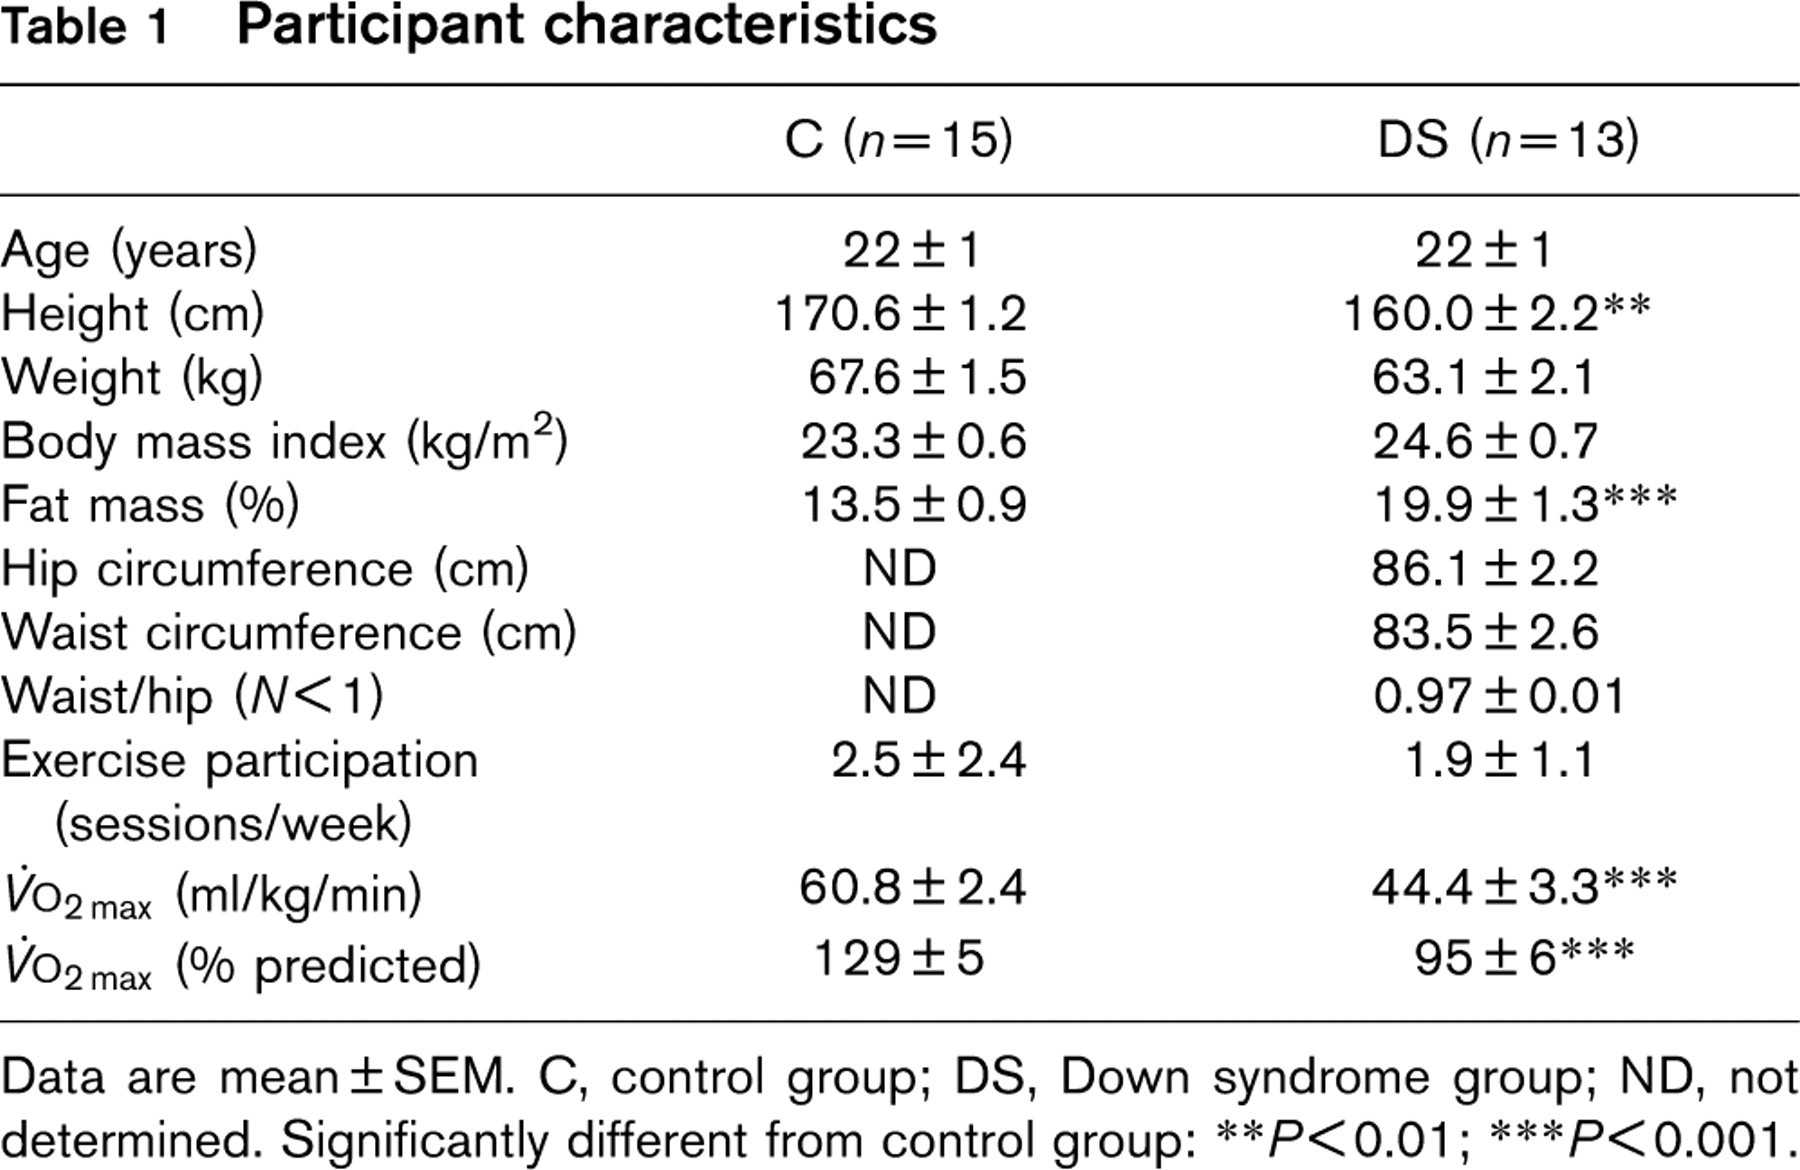
Data are mean ± SEM. C, control group; DS, Down syndrome group; ND, not determined. Significantly different from control group:
P < 0.01;
P < 0.001.
Study design
During the first visit, after clinical examination and determination of anthropometric data, a venous blood sample was collected, to determine glycaemia, insulinaemia and blood-lipid profile. During a second visit, all participants underwent a maximal treadmill incremental exercise test, to determine Vo2 max. At least 1 week later, following an overnight fast, they performed a submaximal graded test consisting of two 10-min bouts at 30 and 50% of Vo2 max, followed by a 75% Vo2 max run that was limited in duration to 20 min. Before each exercise test, all participants refrained from strenuous exercise for 24h. On another occasion, each participant reported to the sleep laboratory of our hospital department and underwent an overnight polysomnography.
Anthropometric measurements
Measurements of weight and height allowed for the calculation of body mass index (BMI: body weight in kg/height in m2). Skinfold measurement with a Lange Skinfold Caliper (Cambridge Scientific Industries, Cambridge, Maryland, USA) at four locations (biceps, triceps, subscapular and suprailiac) allowed for total body fat determination [19]. Waist and hip circumferences measured with a cloth measuring tape allowed for the estimation of visceral fat.
Maximal progressive treadmill test
Each participant underwent a continuous maximal incremental protocol, walking or running on a treadmill (Gymrol Super 2500, Andrézieux, Bouthéon, France). After adjustment to a comfortable walking (i.e. 4 km/h for the majority of DS participants) or running speed (10 km/h for the control group), the slope was increased by 2% every minute until the participants reported exhaustion. Gas exchange and heart rate were continuously recorded with an automated computerized analysis system (Brainware, Toulon, France).
Submaximal graded exercise test
All participants were tested after an overnight fast. The test consisted of continuous exercise for 30-40 min on a treadmill, depending on the capacity of the participant. After two 10-min stages, during which the speed and the slope were adjusted to elicit 30 and 50% Vo2 max of each participant, an endurance stage, limited to a 20-min duration at 75% Vo2 max, was imposed. At the end of each stage, venous blood was collected, to assess the parameters of oxidative stress.
Calculation of lipid-oxidation rate was assessed from gas-exchange measurements, according to the nonprotein respiratory quotient technique [20]: Lipid-oxidation rate (mg/min) = −1.7012 Vo2 + 1.6946 VO2 (with Vo2 and Vo2 in ml/min). Vo2 and VcO2 was averaged over the last 5 min of each exercise stage. The maximal fat-oxidation rate point (Fatmax expressed as % of Vo2 max) is the exercise intensity at which the lipid-oxidation rate reaches a maximum (maximal fat-oxidation rate or MFO in mg/min) [3].
Blood collection and analysis
All venous blood draws were made in the morning after an overnight fast (12h). Plasma glucose, lipid and lipoprotein cholesterol concentrations of all samples were determined using an automated Boehringer Mannheim/Hitachi 917 analyser (Roche diagnostic kit, Meylan, France). Low-density lipoprotein cholesterol was calculated from the Friedwald equation [21]. Fasting plasma-insulin concentration was determined with a human insulin-specific double antibody radioimmunoassay (RIA; Linco Research, St Charles, Missouri, USA).
Calculation of Homeostasis Model Assessment Insulin Resistance calculated with simplified formula (HOMA-IR), an index of insulin resistance was as follows: HOMA-IR = (insulinaemia)/[22.5 × e−ln(glycaemia)] [22]. Fructosamines were measured on a Boehringer Mannheim/Hitachi 917 analyzer (Roche diagnostic Kit, Meylan, France).
Parameters of oxidative stress
Total antioxidant capacity of blood (TAC) was measured using the Randox kit (Randox Laboratories Ltd, Roissy, France) on Hitachi 904. Plasma thiols were measured using 5,5′ dithiobis(2-nitrobenzoic acid) as previously described [23]. Malondialdehyde (MDA) was measured using the Sobioda TBARS kit (Grenoble, France), in which the fluorescence of thiobarbituric acid reactants in plasma can be recorded.
Blood pressure determination
Blood pressure was measured by sphygmomanometer, as recommended [24].
Polysomnography
Each patient underwent full overnight polysomnography in our sleep laboratory, according to international guidelines [25]. A breathing event during sleep was defined as abnormal if either a complete cessation of airflow lasting at least 10s was seen (apnoea) or a reduction in respiratory airflow of at least 50% of the tidal volume, lasting 10 s or more, could be discerned (hypopnoea). Obstructive apnoea was defined as absence of tidal volume in the presence of paradoxical chest or abdominal wall motion. The absence of rib cage movement associated with an apnoea or a hypopnoea, define a central respiratory event.
We considered the average number of episodes of apnoea (AI), and that of pooled episodes of apnoea and per hour of sleep hypopnoea (AHI), the mean overnight arterial oxygen saturation (mean SaO2), the minimum arterial oxygen saturation reached during the night (lowest SaO2) and the overnight time spent at an arterial oxygen saturation lower than 90% (time SaO2 < 90%).
Statistical analysis
Data are reported as means ± SEM. Independent t-tests were used to evaluate baseline descriptive differences between groups. For substrate oxidation and oxidative stress, between-group (DS versus C) and exercise-intensity effects were assessed by repeated-measures analyses of variance. The Bonferroni correction was applied in post hoc analysis. The level of significance for all tests was set at P < 0.05.
Results
Physical fitness
Vo2 max of DS participants was lower than that of C (60.8 ± 2.4 versus 44.4 ± 3.3 ml/kg/min; P < 0.001, Table 1). The mean Vo2 max of DS participants was, however, close to the predicted value (95 ± 6%), according to Wasserman [26].
Metabolic characteristics analysis
On average, BMI did not differ between the two groups and was in the normal range. The average fat mass of DS participants was greater than that of C, but only slightly higher than that of the general population. The mean waist circumference of DS participants was less than 102 cm (Table 1). On average, waist-to-hip ratio was lower than 1 (Table 1). Lipid profile did not differ between the two groups, and was in the normal range of that of the general population (Table 2). HOMA-IR and insulinaemia were greater in the DS participants than in C, although they were in the normal range [22, 27]. As expected, when we pooled the two groups, HOMA-IR was related to fat mass (r = 0.42; P < 0.05). Blood pressure did not significantly differ between the two groups. Whichever group was considered, no participant presented hypertension.
Except for the slightly greater fat mass or the lower insulin sensitivity described above, no participant presented any of the features of a metabolic syndrome according to National Cholesterol Education Program - Adult Treatment Panel III [28]. Finally, fructosamines averaged over the entire submaximal graded exercise protocol were significantly greater in DS participants compared with C (271±8.8 versus 230±6.0 μmol/l; P<0.001).
Blood pressure measurements, lipid profile and indices of insulin resistance
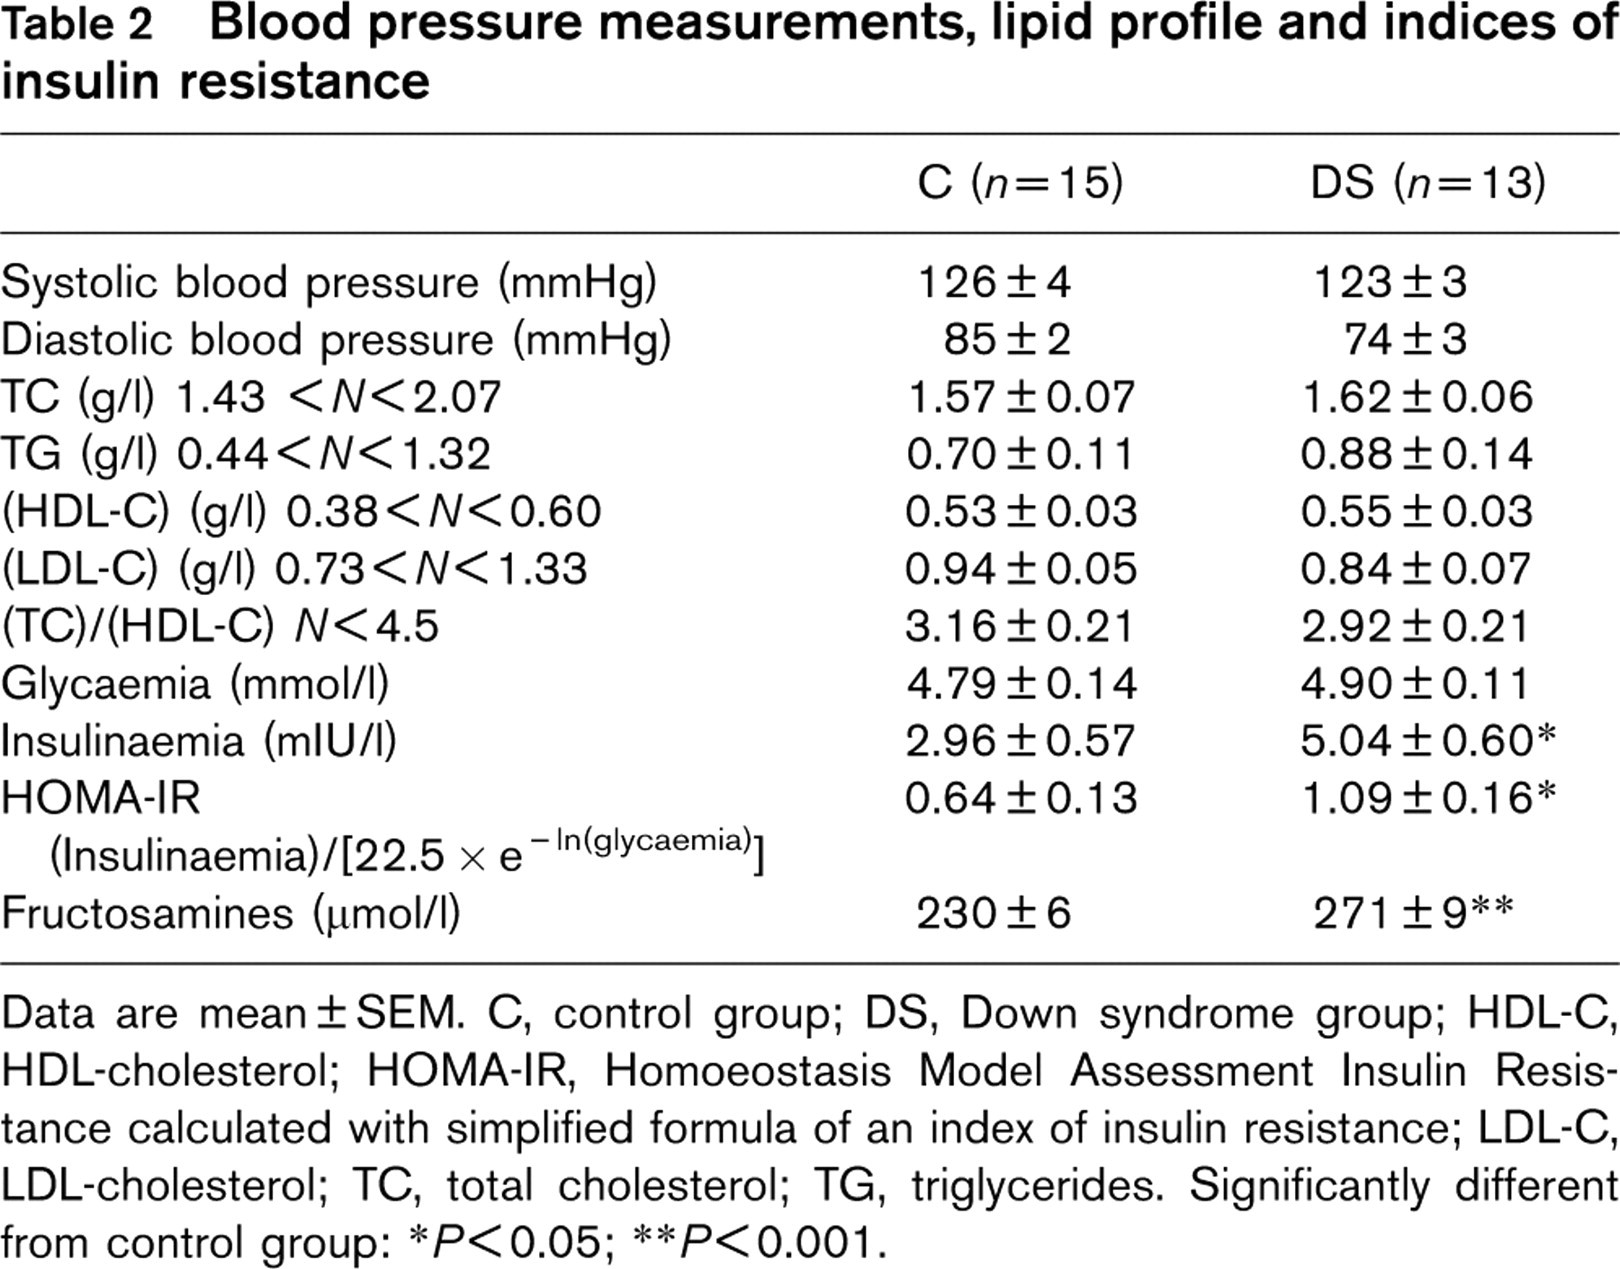
Data are mean ± SEM. C, control group; DS, Down syndrome group; HDL-C, HDL-cholesterol; HOMA-IR, Homoeostasis Model Assessment Insulin Resistance calculated with simplified formula of an index of insulin resistance; LDL-C, LDL-cholesterol; TC, total cholesterol; TG, triglycerides. Significantly different from control group:
P < 0.05;
P < 0.001.
Polysomnography
AI, AHI and time SaO2 less than 90% were greater in DS participants than those obtained in C, whereas mean SaO2 and the lowest SaO2 were lower (Table 3). Five participants reached a sufficient level of severity of OSAS (AHI > 30 events/h), justifying treatment using a continuous positive airway pressure device.
Substrate oxidation during submaximal graded exercise
Endurance at the third step (75% Vo2 max) of the submaximal progressive test was lower in DS participants (15.3±1.0 min) compared with C (20±1.0 min; P < 0.001). Although slightly lower in DS participants, Fatmax did not, however, differ significantly (P = 0.33) between. C (54.7 ±21.5% Vo2 max) and them (47.7 ± 12.6% Vo2 max).
MFO was significantly lower in DS participants, compared with C (394.2±69.9 versus 486.1 ±134.8 mg/min; P < 0.01). Pooling the two groups, MFO and Fatmax were related to Vo2 max (r = 0.42; P < 0.05; r = 0.53; P < 0.01).
Oxidative stress
The ratio (thiols/total proteins) in plasma obtained at rest was lower in DS participants (6.5 ± 0.3 versus 7.5 ± 0.5 μmol/g; P < 0.001). This difference between the two groups was maintained during exercise and recovery (Fig. 1). Moreover, this ratio remained stable over the exercise protocol in DS participants, whereas, in C, the ratio at the end of submaximal progressive test was decreased compared with ratio at rest. After 60 min of recovery, the ratio (thiols/total proteins) significantly increased, compared with that at end exercise, and reached resting values in C only.
Polysomnography
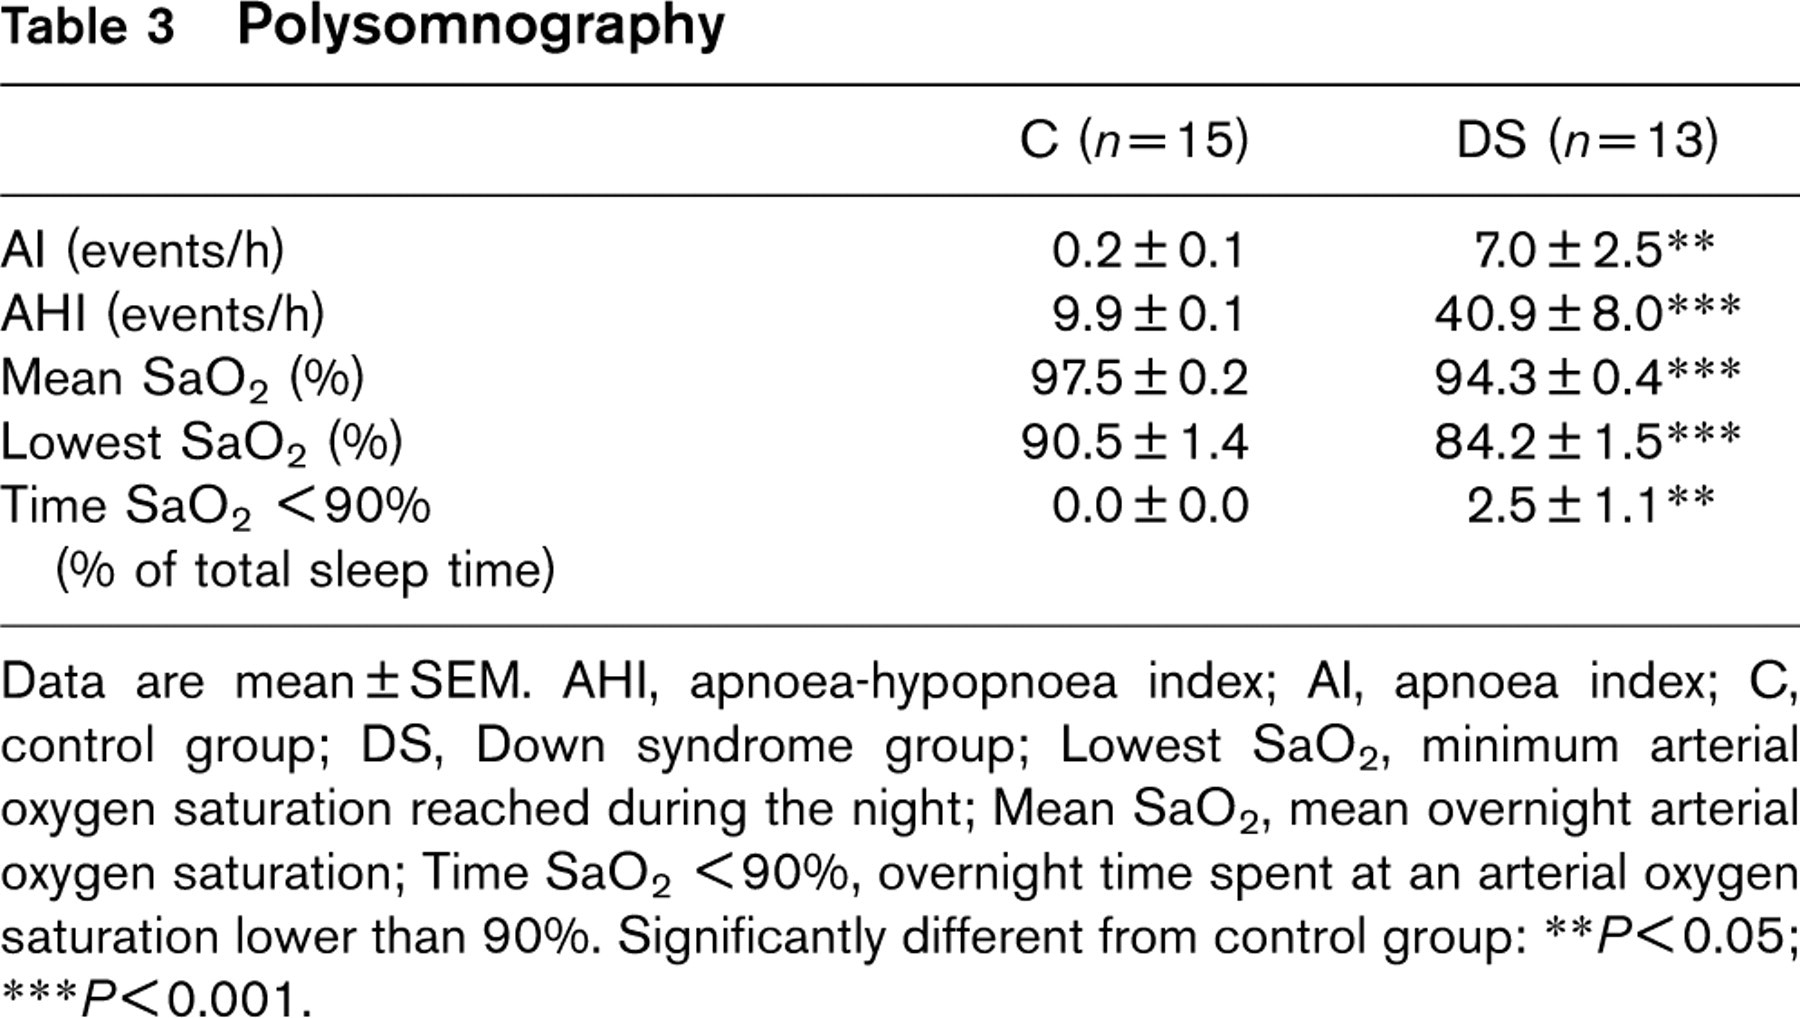
Data are mean ± SEM. AHI, apnoea-hypopnoea index; AI, apnoea index; C, control group; DS, Down syndrome group; Lowest SaO2, minimum arterial oxygen saturation reached during the night; Mean SaO2, mean overnight arterial oxygen saturation; Time SaO2 < 90%, overnight time spent at an arterial oxygen saturation lower than 90%. Significantly different from control group:
P < 0.05;
P < 0.001.

Mean ±SEM of the ratio (thiols/total proteins) in plasma obtained in a Down syndrome (DS) group and in a control group (C). Significant difference between the two groups: ∗∗∗P < 0.001. Significant difference between end exercise and rest in C group: +++ P <0.001. Significant difference between recovery and end exercise in C group: °°° P < 0.001.
We did not find any relationship between polysomnographic variables and the ratio (thiols/total proteins).
The ratio (thiols/total proteins) in plasma, obtained at the end of the third step of submaximal progressive exercise, was correlated with Vo2 max (r = 0.69; P < 0.001).
MDA, averaged over the entire submaximal graded protocol, confirmed the greater oxidative stress in DS participants compared with C (2.85 ± 0.07 versus 2.51 ± 0.07 μmol/l; P < 0.01).
The TAC of plasma at end exercise and during recovery was significantly greater in DS participants compared with C (P < 0.01 - Fig. 2), but not at rest (P = 0.35).
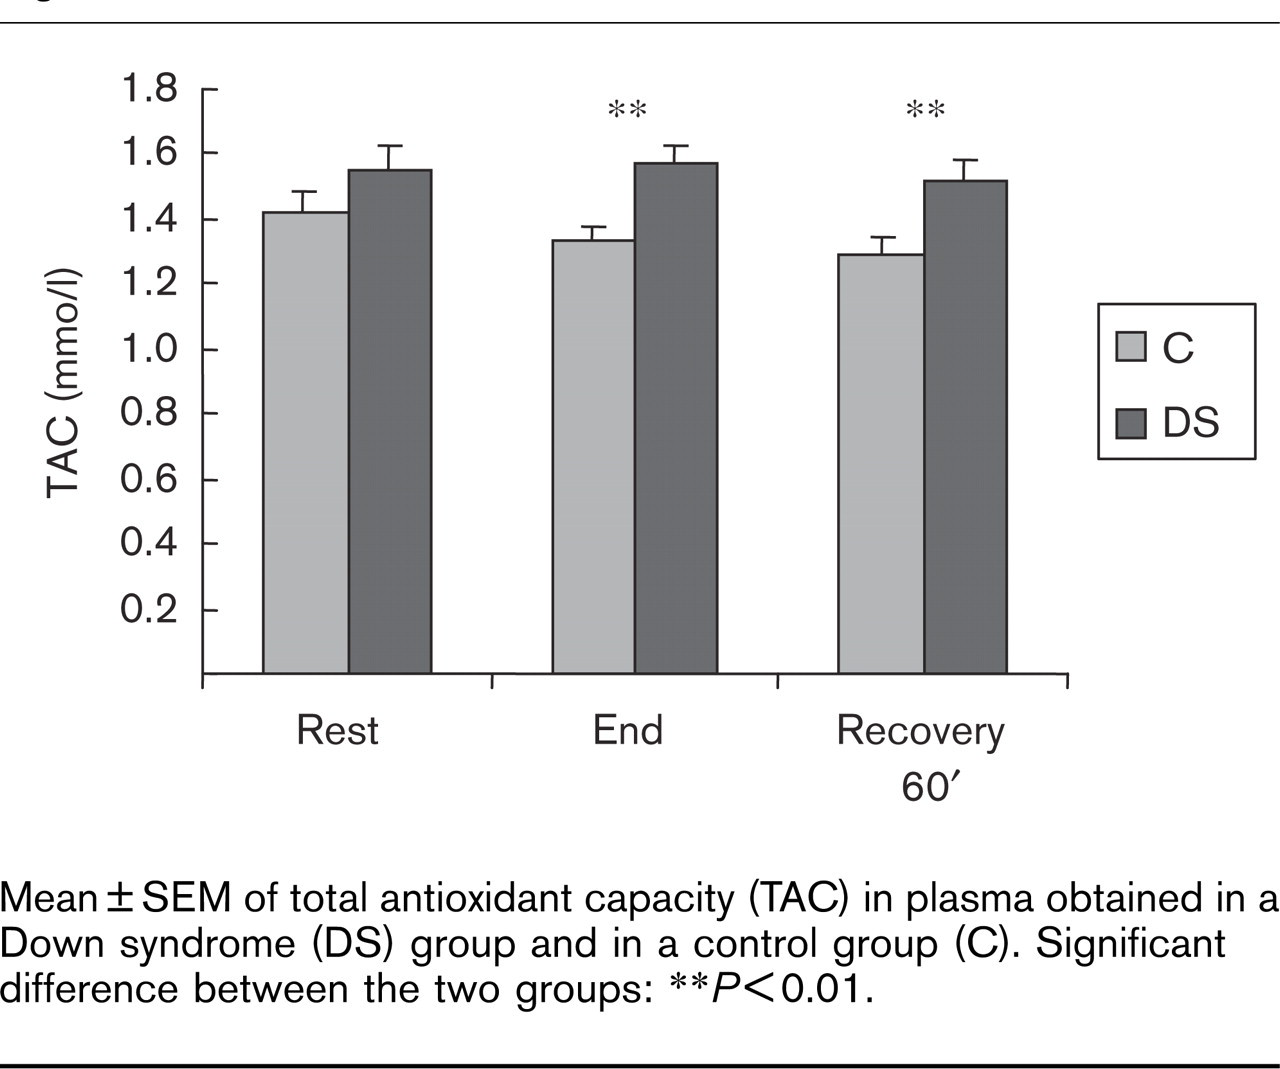
Mean ±SEM of total antioxidant capacity (TAC) in plasma obtained in a Down syndrome (DS) group and in a control group (C). Significant difference between the two groups: ∗∗P <0.01.
Associations between oxidative stress, lipid oxidation, insulin sensitivity and fat mass
Only when the two groups were pooled was oxidative stress (thiols/total proteins) correlated to fat mass (r =-0.61; P < 0.001), HOMA-IR (r = −0.61; P < 0.05) and Fatmax (r = 0.55; P < 0.01). In addition, HOMA-IR was related to MFO (r = −0.42; P < 0.05).
Discussion
The main result of this study is the absence of systematic metabolic syndrome and/or clear metabolic anomalies in a group of young adult DS participants, despite their greater oxidative stress and lower insulin sensitivity. In addition, the ability to oxidize fat, although slightly decreased, was preserved in this group, a state that is compatible with the absence of metabolic syndrome.
Study limits
Several limitations could explain the lack of increased occurrence of metabolic syndrome in our DS group. First, the number of DS volunteers was small because of the constraints of this study (number of clinical investigations and repeated blood sampling). Second, the group that volunteered to participate in this study was young and physically active. Consequently, the risk of occurrence of metabolic syndrome would have been limited, unless it was associated with obesity [29]. The expected oxidative stress could, nevertheless, be associated with several features of this syndrome such as IR or hypertension.
Redox balance
Validity of the markers of oxidative stress
The paradigm pursued through this study was that the greater oxidative stress often reported in DS might enhance metabolic abnormalities. We chose to assess oxidative stress by the decrease of the ratio (thiols/total proteins) in blood, as thiols rapidly react with radical oxygen species. Indeed, thiols are markedly decreased within few minutes of an oxidative stress induced by cigarette smoking [30]. Our results clearly showed a greater oxidative stress in DS participants, compared with C, at rest, end exercise, and during recovery. This result is sustained by the evolution of more classical markers of lipid peroxidation (MDA), although its validity has recently been challenged [31]. In addition, we found, in DS participants, a greater level of plasma fructosamines, a marker of protein glycation in diabetes, which is increased in case of oxidative stress [32]. Moreover, the greater oxidative stress reported at rest in our DS group is consistent with the results of numerous reports [9–11].
Oxidative stress and exercise
The excess of genetic information in patients with DS produces an increase SOD1 activity, an antioxidant enzyme coded on chromosome 21 [33]. This overactivity of SOD1 is not balanced, as the ratio of SOD1 to catalase plus glutathione peroxidase is also increased [34]. The H2O2 thus generated is more than the catalase and glutathione peroxidase can catabolize. The excess of the resulting H2O2 might react with O2 •− producing OH•, which is one of the most reactive oxygen species. This excess of oxidative stress has recently been supported by a multiple prooxidant state, which seems to play a major role in the DS phenotype and in the pathologies frequently seen in this syndrome [11], such as neurological disorders, atherosclerosis, diabetes, accelerated cell ageing and cellular mutagenicity [35]. Therefore, in this study, we tested the relationship between the features of metabolic syndrome and the increased oxidative stress. The latter stress is also thought to be responsible for premature fatigue during muscular exercise. To our knowledge, studies on oxidative stress during exercise in DS participants are scarce, and our results support its involvement as a limiting factor in performance.
Although not significantly different at rest (P = 0.35), TAC measured in DS participants at the end of submaximal graded exercise and during recovery was systematically greater than in C. Part of this observation might rely on the greater oxidative stress that is induced by exercise in C. This might be explained by the longer duration of exercise in C, compared with DS participants. In addition, the greater TAC in DS participants during exercise might have reflected a greater ability to mobilize blood-borne antioxidants due to chronic oxidative stress [31].
Metabolic characteristics and their relationship with physical fitness and oxidative stress
On the basis of our previous observations [7], which showed an impairment of the lipid profile in an adolescent DS group, we expected a greater prevalence of the metabolic syndrome. In our DS group, we did observe some markers of the metabolic syndrome. First, mean fat mass was significantly greater than in C, and slightly greater compared with the general population. Indeed, according to BMI, 23% of our DS participants were overweight; in comparison, 7% of the C participants, 16.5% of a young adult military French population [36] and 31.8% of DS adolescents [37] were overweight. Only one DS participant, however, approached a waist circumference of 100 cm; three participants had a waist-to-hip ratio of 1, threshold values from which cardiovascular risk increases [38]. Second, although no DS participant displayed IR, insulin sensitivity of these participants was lower than that of C. Owing to the relationship that we observed between fat mass and HOMA-IR, the greater fat mass of DS participants might have partly explained this lower insulin sensitivity. The stronger relationship between thiols and HOMA-IR, however, suggests an involvement of increased oxidative stress in DS participants.
The blood-lipid profile of DS participants involved in our study was not altered, whereas studies performed in adults below 40 years of age [2] or in adolescents [7] showed lipid-profile impairment, a factor that increased the risk of cardiovascular disease [39]. This is particularly true in participants with mild-to-moderate mental retardation, who live in the community setting [2]. It is thought that under such conditions, the DS participants receive less guidance and supervision than they would from caregivers in an institution. As in the general population, they tend, therefore, to choose lifestyles consisting of low physical activity and a high-fat dietary intake [40]. This was not the case for the current DS group. All the participants of our DS group lived with their parents and were affiliated to a local mental-deficiency association. We, therefore, postulated that a healthy lifestyle might have at least partially contributed to the quite normal metabolic profiles of our DS group of patients. In addition, the moderate-to-mild intellectual deficiency in this group might have accounted for a better understanding of what constitutes healthy behaviour.
The great attention paid by the parents of our DS participants to the diet might have contributed to the healthy metabolic profile of this group. This has been confirmed by the dietary enquiries carried out by our sports medicine department (result not shown), although the caloric ration tended to be greater than their needs.
The mean participation in physical activity (assessed by questionnaire) by the DS group was two effective sessions of 1 h each, at light-to-moderate intensity (40-60% of Vo2 max, or 3-6 METS). This level is compatible with benefits in cardiovascular health [41], and is supported by the normal Vo2 max of the DS participants, whereas a rather low value is generally reported [39, 42]. These results suggest that DS participants might benefit from the protective effects of regular physical activity on lipid profile, metabolic syndrome, diabetes and hypertension [43–47].
Regarding the greater level of oxidative stress in DS participants, however, we cannot definitively discard metabolic abnormalities and their consequences in the great and middle arteries. Indeed, an association between increased oxidative stress and coronary artery calcification in young healthy adults supports the hypothesis that oxidative damage is involved in the early development of atherosclerosis, independently of lipoproteins [48].
An association between oxidative stress and several features of metabolic syndrome, such as hyperinsulinaemia, diabetes [14, 15], atherosclerosis [16], hypertension [17] and obesity [18], has been consistently reported. The mechanisms underlying these associations are unclear. Owing to the generally reported tendency to obesity and the expected greater oxidative stress, DS participants might have presented insulin resistance. The relationship between fat mass and the markers of oxidative stress and HOMA-IR, when pooling the two groups, confirmed our paradigm. Insulinaemia and HOMA-IR were significantly greater in DS participants than in C; however, these parameters were far lower than the cutoff levels of 15 [27] and 4 μU/ml [22], respectively, to infer the presence of IR. Improving the antioxidant status has been shown to improve insulin sensitivity [15]. It can be speculated that the level of physical activity and the associated increase in TAC [31] of DS participants [49] might have helped to prevent insulin resistance.
Use of substrate during exercise
Metabolic syndrome, particularly IR, have been associated with a decrease in fat oxidation during exercise, in obesity [3] and in type 2 diabetes (unpublished personal data). Although a clear metabolic syndrome could not be evidenced in DS participants, insulin sensitivity was decreased. The relationship between the ratio (thiols/total proteins) and Fatmax, observed when pooling the two groups, suggests the involvement of the greater oxidative stress in the lower fat-oxidation rate of DS participants during exercise.
Although Fatmax did not significantly differ between our two groups, MFO was significantly lower in DS participants compared with C. Average MFO, as well as individual data of each participant, was well within the range (180-1001 mg/min) reported in a normal cohort of 300 participants [4]. Several factors can influence exercise lipid oxidation, among which are sex, Vo2 max and physical activity [4]. The difference in Vo2 max between our two groups and the relationships of Vo2 max with the indices of substrate oxidation (Fatmax and MFO) suggest that the lower level of MFO, which we observed in DS participants, is linked to their lower physical fitness level. The normal Vo2 max observed in our DS group is very encouraging. In DS participants, as in the general population, regular moderate physical activity can favour lipid oxidation and help prevent metabolic syndrome. DS persons have, however, been long considered a prematurely ageing people; hence, a follow up of the level of physical activity with age should deserve attention.
Sleep abnormalities
As expected, some DS participants presented abnormal polysomnograms. Indeed, five (30%) participants reached a level of severity sufficient to justify treatment (AHI >30 events/h), compared with 45% in the study by Marcus et al. [12], carried out in children with DS. Moreover, seven (58%) participants presented polysomnogram anomalies, which is a slightly lower proportion than that previously reported (77%) [12]. Anatomical reasons exist for these sleep abnormalities in DS participants, such as macroglossia, glossoptosis, recurrent enlargement of the adenoid tonsils and enlarged lingual tonsils [50]. Owing to the relationship between oxidative stress and intermittent hypoxic episodes linked to OSAS [13], the oxidative stress in DS participants might have been exacerbated. We, however, did not find any relationship between the markers for sleep abnormalities and oxidative stress. This result suggests that the greater oxidative stress in the DS participants involved in our study is linked to the previously described overexpression in SOD1 [9–11]. Metabolic syndrome, and particularly obesity, is generally associated with a greater prevalence of OSAS [51]. The absence of marked metabolic syndrome and obesity in our DS group might have explained the slightly lower prevalence of OSAS. As already stated, healthy habits might have contributed to this result and hence to a possible decrease in cardiovascular disease risk [52].
In conclusion, as expected, we confirmed the greater oxidative stress in DS participants. Despite a slightly greater fat mass, a lower insulin sensitivity and lipid oxidation during prolonged exercise, DS participants did not display significant metabolic abnormalities. Lifestyle benefits enjoyed by this group might have accounted for this apparently healthy metabolic status. These results must be confirmed by longitudinal follow-ups allowing for the assessment of the effects of ageing. Finally, it seems that efforts must be continued to promote participation in physical activity among persons with DS, to reduce the potential health risks associated with low fitness and sedentary behaviour.
Footnotes
Acknowledgements
The authors thank the ‘Association familiale de l'Isère d'aide aux enfants infirmes mentaux (AFIPAEIM)’ and the ‘Association de Recherche pour l'Insertion Sociale des Trisomiques (ARIST)’ for the recruitment of persons with DS. They also thank Professor J Mercier and Dr JF Brun (Laboratoire CERAMM, Montpellier, France), who lent the software for the automatic calculation of Fatmax; Mrs Deschaux for her help in statistical analyses and Veale and Pastor for English corrections. This study was supported by grants from the ‘Programme de Recherche Clinique du Centre Hospitalier Régional Universitaire Albert Michallon de Grenoble’ and the Fondation Jérôme Lejeune in Paris, awarded to A Favre-Juvin and Y Eberhard, respectively.
Conflict of interest: none declared.