
Abstract
Background and Aim
Cardiovascular disease (CVD) is the most frequent cause of death in nonalcoholic fatty liver disease (NAFLD). Insulin resistance, hepatic dysfunction, and chronic inflammation are factors interacting in explaining the increased CVD incidence in NAFLD. We aimed to evaluate the effects of insulin resistance and inflammatory biomarkers on asymmetric dimethylarginine (ADMA) levels, a predictor of CVD. We also investigated relationship between these markers and histological findings in patients with NAFLD.
Patients and Methods
Plasma ADMA, high-sensitivity C-reactive protein (hs-CRP), interleukin 6 (IL-6), and homeostasis model assessment of insulin resistance (HOMA-IR) were measured in 70 patients with histologically verified NAFLD (53 with nonalcoholic steatohepatitis [NASH], 17 with non-NASH) and 12 controls.
Results
The HOMA-IR (5.3 [3.9] vs 1.9 [1], P < 0.001), hs-CRP (5.6 [4.2] vs 2.2 [2.3] mg/L, P < 0.001), ADMA (0.81 [0.25] vs 0.48 [0.24] μmol/L, P = 0.005), and IL-6 (4.1 [1.2] vs 1.0 [0.4] pg/mL, P < 0.001) levels were all found higher in the NAFLD group than the control group. The ADMA levels were significantly higher in patients with NAFLD independent from HOMA-IR and body composition (P = 0.02). The IL-6 and HOMA-IR levels of the NASH group were found significantly higher than those of the non-NASH group. The only determinant significantly correlated to ADMA was HOMA-IR.
Conclusions
Our data suggested that although ADMA levels are independently higher in NAFLD, the only determinant correlated to ADMA is HOMA-IR and not inflammatory biomarkers (hs-CRP, IL-6) or presence/absence of NASH.
Nonalcoholic fatty liver disease (NAFLD) is the most common liver disease worldwide, affecting around one third of the western population with an increasing incidence because of the pandemicity of obesity and diabetes, and is becoming a serious public health burden even in other parts of the world. 1
In the last decade, it has become apparent that the clinical burden of NAFLD is not restricted to liver-related morbidity or mortality and that cardiovascular disease (CVD) is the most frequent cause of death in patients with NAFLD.2,3 A decrease in the CVD incidence and CVD-associated mortality can be achieved by identifying the NAFLD subjects who are at risk of developing CVD and providing an appropriate management to reduce risk.
Endothelium plays a critical role in the maintenance of vascular tone and structure. Nitric oxide (NO) is one of the major endothelium derived vasoactive substances and acts as a potent vasodilator. Its role has the prime importance in maintaining endothelial homeostasis, and low levels of NO are associated with impaired endothelial function. 4 Asymmetric dimethylarginine (ADMA) is an endogenous inhibitor of NO synthase that catalyzes the conversion of L-arginine to NO. 5 Elevated levels of ADMA are also established as a risk factor for endothelial dysfunction.6,7
For the last decade, substantial evidence has been acquired that ADMA is consistently related to cardiovascular complications and adverse clinical outcomes in different populations.8–10 Plasma levels of ADMA are related to its release from protein breakdown and to its disposal through its cleavage by the enzyme dimethylarginine hydrolase (DDAH). Although DDAH is present in various organs, it is the hepatic DDAH playing the dominant role in the removal of plasma ADMA. 11 Besides association of high plasma levels of ADMA with hepatic dysfunction due to defected removal,12,13 higher plasma ADMA levels are also reported in insulin resistance states 11 and in subjects with type 1 and type 2 diabetes.14,15 Nonalcoholic fatty liver disease as the hepatic component of metabolic syndrome is also known to be associated with systemic insulin resistance.
Nonalcoholic fatty liver disease itself includes varying degrees of inflammation in a wide spectrum ranging from simple steatosis to nonalcoholic steatohepatitis (NASH) with evidence of increased oxidative stress and inflammation. 16 There are studies suggesting that the intrahepatic inflammation associated with NAFLD may also be linked to systemic elevations in inflammatory biomarkers, such as high-sensitivity C-reactive protein (hs-CRP). It is also recently shown in human studies that interleukin 6 (IL-6), a major proinflammatory cytokine, has a prominent hepatic expression that is associated with the severity of NAFLD and the circulating plasma levels of IL-6 correlates well with the severity of the liver damage in patients with NAFLD. 17
To sum up, insulin resistance, possible hepatic dysfunction, and chronic inflammation are the major factors that may effect endothelial dysfunction and interact in explaining increased CVD incidence in patients with NAFLD.
With this background in mind, we aimed to evaluate the effects of insulin resistance and inflammatory biomarkers (hs-CRP and IL-6) on ADMA levels, a novel marker of endothelial dysfunction and a predictor of future cardiovascular events, in patients with biopsy-proven NAFLD. Besides, we investigated the interaction of these factors between each other and their relationship to varying degrees of pathologic findings such as hepatic steatosis, lobular inflammation, fibrosis, and presence of NASH.
Methods
In this observational case-control study, 70 patients with NAFLD (53 NASH and 17 non-NASH) and 12 healthy control subjects were enrolled. The study protocol was approved by our local ethics committee, and all subjects gave their written informed consent to participate in the study. Patients with NAFLD were seen consecutively at the outpatient clinics of Sisli Hamidiye Etfal Education and Research Hospital Department of Gastroenterology between May 2012 and December 2013. All had elevated alanine aminotransferase (ALT) and aspartate aminotransferase (AST) levels for at least 6 months together with steatosis at ultrasonography (US); they had no history of any hepatotoxic drugs, hormone replacement therapy or herbal products, no drinking of alcohol more than 20 g/d, and no viral hepatitis or autoimmune hepatitis, hemochromatosis, Wilson disease, alpha-1 antitrypsin deficiency, biliary disease, and malignancies. None of the patients had a known coronary artery disease, none had a history of angina or myocardial infarction. Liver biopsies were performed to the patients under US guidance. The control group was recruited from hospital staff members and relatives with normal liver function tests and completely normal liver US. The control group was negative for viral hepatitis serology tests, and they had no illness, no history of previous liver diseases, and no usage of alcohol, drug, or herbal substances. All patients and controls were of Turkish descent.
All subjects underwent physical examination, anthropometric measurements, and biochemical screening. The weight and height of the participants were measured with a calibrated scale after the patients had removed their shoes and any heavy clothing. Body mass index (BMI) was computed as body weight/(height)2. American Diabetes Association criteria 18 was used for diabetes mellitus diagnosis and the Adult Treatment Panel III 19 for metabolic syndrome diagnosis. The estimate of insulin resistance was calculated using the homeostasis model assessment of insulin resistance (HOMA-IR) index, with the following formula: insulin resistance = fasting plasma insulin (in microunits per milliliter) × fasting plasma glucose (FPG, in milligrams per deciliter)/405.
Routine blood chemistry analyses were performed at the central laboratory of clinical biochemistry of our center. Serum hs-CRP was measured by means of particle-enhanced immunonephelometry (using the Siemens BN II and BNProSpec System, Marburg, Germany). For ADMA and IL-6 analyses, all blood samples were collected from an antecubital vein, between 08:00 and 09:00 AM after an overnight fasting. Blood was drained to a tube containing ethylene diamine tetra acetate and samples were centrifuged for 15 minutes at 1000g. Then, the plasma was removed immediately and stored frozen at −80°C until analyzed.
Microplate ELx50 Strip Washer and Microplate ELx800 Absorbance Reader (BioTek Instruments Inc, Winooski, VT) were used for ELISA analysis. Plasma concentrations of IL-6 were assessed with AssayMax Human IL-6 ELISA Kit (Catalog No. EI1006-1; Assaypro LLC, St. Charles, MO) according to manufacturers’ instructions; the quantitative sandwich enzyme immunoassay was developed for the measurement of serum IL-6 concentrations. Intra-assay and interassay coefficients of variation were 4.9% and 7.5%, respectively. The minimum detectable value of IL-6 was 0.008 ng/mL. The ADMA serum concentrations were measured twice by using ADMA ELISA Kit (Catalog No. K7828; Immundiagnostik AG, Bensheim, Germany) according to manufacturers’ instructions; the assay is based on the method of competitive enzyme-linked immunoassays. The intra-assay and interassay coefficients of variation for ADMA were 0.27% to 0.78% and 0.33% to 0.79%, respectively. The minimum detectable value of ADMA was 0.05 μmol/L.
Liver biopsies were performed under guidance of US by using a 16-gauge Hepafix needle. All biopsy specimens were placed in formalin solution for fixation and embedded in paraffin blocks. Serial sections (sectioned at 4-mm intervals) were stained with hematoxylin/eosin and Masson trichrome. An experienced hepatopathologist blinded to subjects' details scored liver biopsy specimens using the National Institute of Diabetes and Digestive and Kidney Diseases (NIDDK) NASH Clinical Research Network scoring system. 20 Steatosis was scored from 0 to 3 with a 4-grade scoring system from S0 to S3 as follows: S0, no steatosis or less than 5%; S1, 5% to 33%; S2, 33% to 66%; and S3, greater than 66%. Lobular inflammation was graded as follows: stage 0, no foci; stage 1, less than 2 foci per ×200 field; stage 2, 2 to 4 foci per ×200 field; and stage 3, greater than 4 foci per ×200 field. Ballooning degeneration was scored as follows: score 0, no ballooning cells; score 1, few balloon cells; and score 2, many balloon cells or prominent ballooning. Fibrosis was staged as follows: stage 0, no fibrosis; stage 1, perisinusoidal or periportal fibrosis; stage 2, perisinusoidal and portal/periportal fibrosis; stage 3, bridging fibrosis; and stage 4, cirrhosis. The histological NAFLD activity score (NAS) was defined as the unweighted sum of the scores for steatosis (0–3), lobular inflammation (0–3), and ballooning degeneration (0-2), thus ranging from 0 to 8. Cases with scores of 5 or greater were accepted as definitive NASH. On the other hand, cases with scores of 0 to 2 were considered as having simple steatosis and cases with activity scores of 3 and 4 were considered to be borderline. We divided our NAFLD study group into 2 subgroups as NASH (definitive NASH) and non-NASH (simple steatosis and borderline) for statistical convenience.
Statistical Analysis
All analyzes were performed using SPSS Version 21.0 for Windows (SPSS Inc., Chicago, IL). The compliance of variables to the normal distribution was studied by visual (histograms and probability plots) and analytic methods (Kolmogorov-Smirnov/Shapiro-Wilk tests). Ordinal variables and numeric variables that do not have normal distribution were compared by Mann-Whitney U test by using medians. The Student t test was used to evaluate differences between the 2 study groups in normally distributed continuous variables. A P value of less than 0.05 (2 sided) was considered statistically significant. Correlations among the study variables were tested by the Pearson and Spearman correlation coefficient according to suitability of the data. Post hoc power analysis was performed by program JMP Version 11.2.0 (2013 SAS Institute Inc.). Power of study was found to be 79% when error α type 1 was taken 0.05. Analysis of covariance was used to reassess differences in plasma ADMA between NAFLD and control groups when adjusted according to factors such as age, HOMA-IR, and body composition that may cause confounding effects. Body composition is a variable formed by combination of BMI, waist circumference, and hip circumference by using factor analysis method and represents all of these 3 variables. Such a new variable was formed because sample size was not large enough to use these 3 variables separately. All analyzes were performed at the 95% confidence interval.
Results
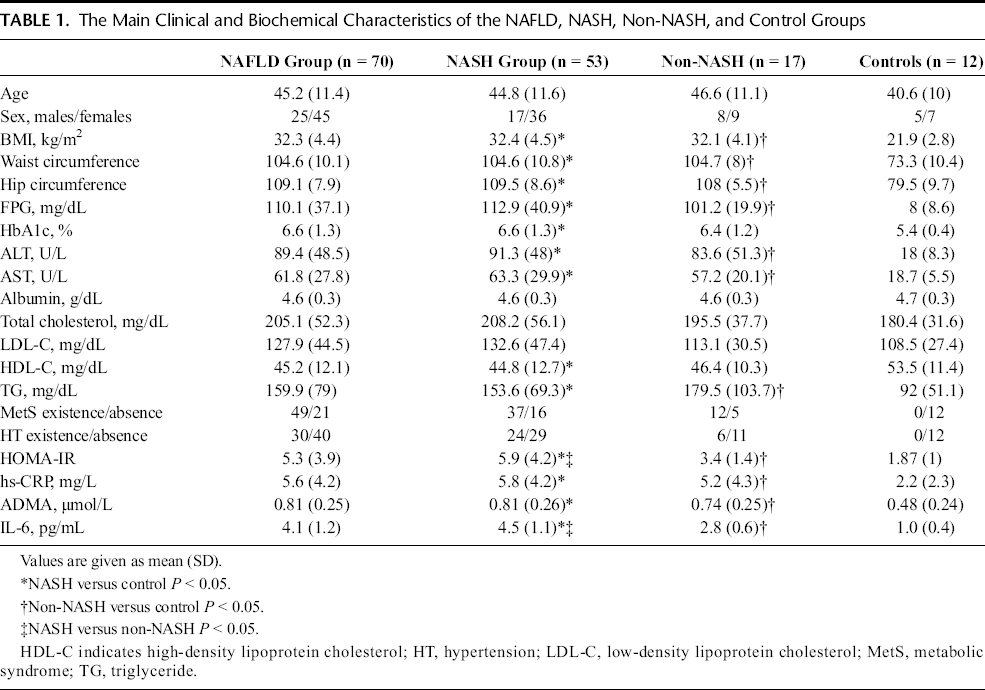
Patients with NAFLD were divided into 2 subgroups as NASH (n = 53) and non-NASH (n = 17) according to NAS. Non-NASH group was composed of 13 simple steatosis and 4 borderline patients. The clinical and biochemical characteristics of NAFLD, NASH, non-NASH, and control groups are shown in Table 1.
The Main Clinical and Biochemical Characteristics of the NAFLD, NASH, Non-NASH, and Control Groups
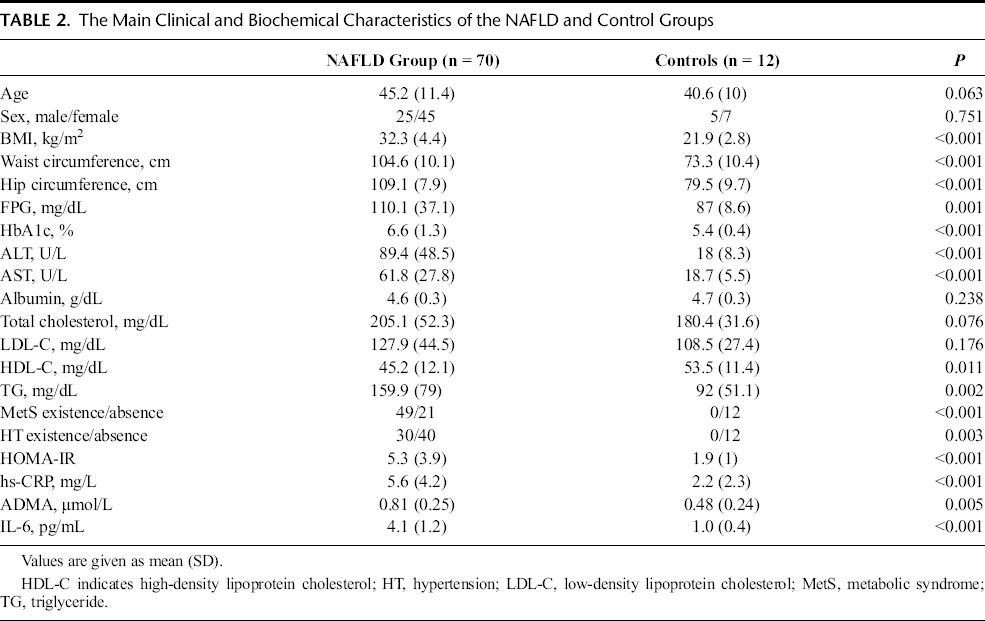
When patients with NAFLD and control subjects are compared as shown in Table 2, age, sex distribution, albumin, total, and LDL cholesterol levels were similar between NAFLD and control groups. Body mass index, waist and hip circumferences, FPG, hemoglobin A1c (HbA1c), ALT, AST, triglyceride levels, existence of metabolic syndrome, and existence of hypertension were significantly higher, and HDL cholesterol levels were significantly lower in patients with NAFLD compared with control group. The HOMA-IR (5.3 [3.9] vs 1.9 [1], P < 0.001), hs-CRP (5.6 [4.2] vs 2.2 [2.3] mg/L, P < 0.001), ADMA (0.81 [0.25] vs 0.48 [0.24] μmol/L, P = 0.005), and IL-6 (4.1 [1.2] vs 1.0 [0.4] pg/mL, P < 0.001) levels were all found significantly higher in the NAFLD group than the control group (Table 2).
The Main Clinical and Biochemical Characteristics of the NAFLD and Control Groups>
When the clinical and biochemical characteristics of NASH and non-NASH patients were compared, age, sex distribution, BMI, waist and hip circumferences, FPG, HbA1c, ALT, AST, albumin, total, HDL and LDL cholesterol levels, triglyceride, existence of metabolic syndrome, existence of hypertension, hs-CRP, and ADMA levels were similar and had a statistically nonsignificant difference. Only HOMA-IR (5.9 [4.2] vs 3.4 [1.4], P < 0.001) and IL-6 (4.5 [1.1] vs 2.8 [0.6] mg/L, P < 0.001) levels had statistically significant difference, and both were higher than the non-NASH group in the NASH group. Body mass index, waist and hip circumferences, FPG, ALT, AST, triglyceride, HOMA-IR, hs-CRP, ADMA, and IL-6 levels of both of the NASH and non-NASH groups were statistically significantly higher than the control group.
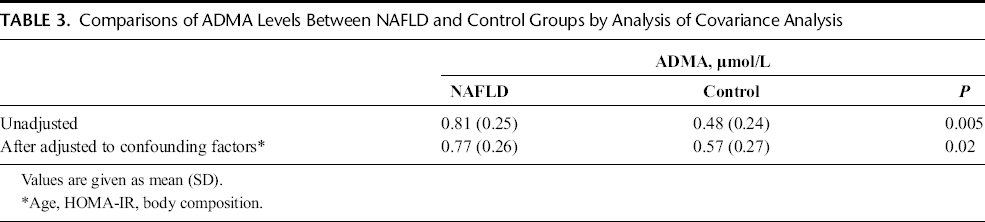
Because insulin resistance is accompanied by higher plasma levels of ADMA, we examined whether the increase in ADMA levels were related to insulin resistance or any other factor such as BMI, waist circumference, and hip circumference (body composition) that may cause confounding effects. When adjusted for all these factors including HOMA-IR score, the plasma concentrations of ADMA in patients with NAFLD were still significantly higher than the controls (P = 0.02, Table 3).
Comparisons of ADMA Levels Between NAFLD and Control Groups by Analysis of Covariance Analysis
Because plasma HOMA-IR, hs-CRP, ADMA, and IL-6 levels were significantly elevated in the NAFLD group compared with control group and HOMA-IR and IL-6 levels were significantly elevated in NASH patients compared with non-NASH patients, we investigated the relationship between stage of fibrosis and the plasma HOMA-IR, hs-CRP, ADMA, and IL-6 levels, but there was no significant relation detected.
There was a statistically significant correlation between NAS and HOMA-IR (r = 0.243, P = 0.042) and IL-6 levels (r = 0.721, P < 0.001). When the correlations of HOMA-IR with pathological findings were examined, HOMA-IR showed a weak but significant correlation with grade of steatosis (r = 0.295, P = 0.013), stage of fibrosis (r = 0.267, P = 0.025), but not with lobular inflammation (r = 0.057, P = 0.642) or ballooning (r = 0.007, P = 0.956). When the correlations of IL-6 with pathological findings were examined, the relation of IL-6 levels with the stage of fibrosis showed no significant correlation (r = 0.191, P < 0.114), although as an inflammatory biomarker, IL-6 levels showed significant correlation with the grade of steatosis (r = 0.497, P < 0.001), lobular inflammation (r = 0.457, P < 0.001), and ballooning (r = 0.376, P = 0.001). There were no statistically significant correlations between the hs-CRP or ADMA levels and NAS, stage of fibrosis, grade of steatosis, lobular inflammation, or ballooning.
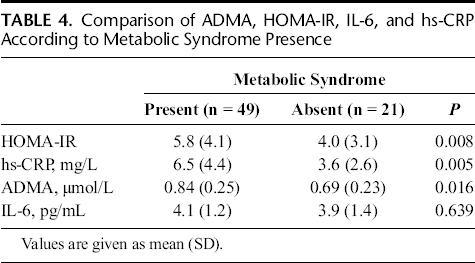
Patients with NAFLD were divided into 2 groups because of the ones that meet the criteria of metabolic syndrome and the ones that they do not, according to Adult Treatment Panel III. When compared, HOMA-IR, hs-CRP, and ADMA levels were statistically significantly higher in patients with metabolic syndrome than the ones that do not have metabolic syndrome (P = 0.008, P = 0.005, and P = 0.016, respectively). Interleukin-6 levels had no significant difference between 2 groups (Table 4). Forty of 70 patients with NAFLD had hypertension and 30 of them did not. Although ADMA levels of hypertensive patients (0.77 [0.26] μmol/L) were compared with the ADMA levels of patients without hypertension (0.83 [0.25] μmol/L), there was no statistically significant difference (P = 0.228).
Comparison of ADMA, HOMA-IR, IL-6, and hs-CRP According to Metabolic Syndrome Presence
When the correlations were investigated between ADMA, HOMA-IR, IL-6, and hs-CRP, HOMA-IR was the only determinant correlating to ADMA (r = 0.601, P < 0.001). The scatter graphs demonstrating HOMA-IR and insulin values plotted against ADMA levels in NASH, non-NASH, and control groups are shown in Figures 1 and 2, respectively. The only other significant correlation found, when all of the correlations were investigated between these 4 determinants studied in this trial, was between hs-CRP and IL-6 (r = 0.388, P < 0.001).
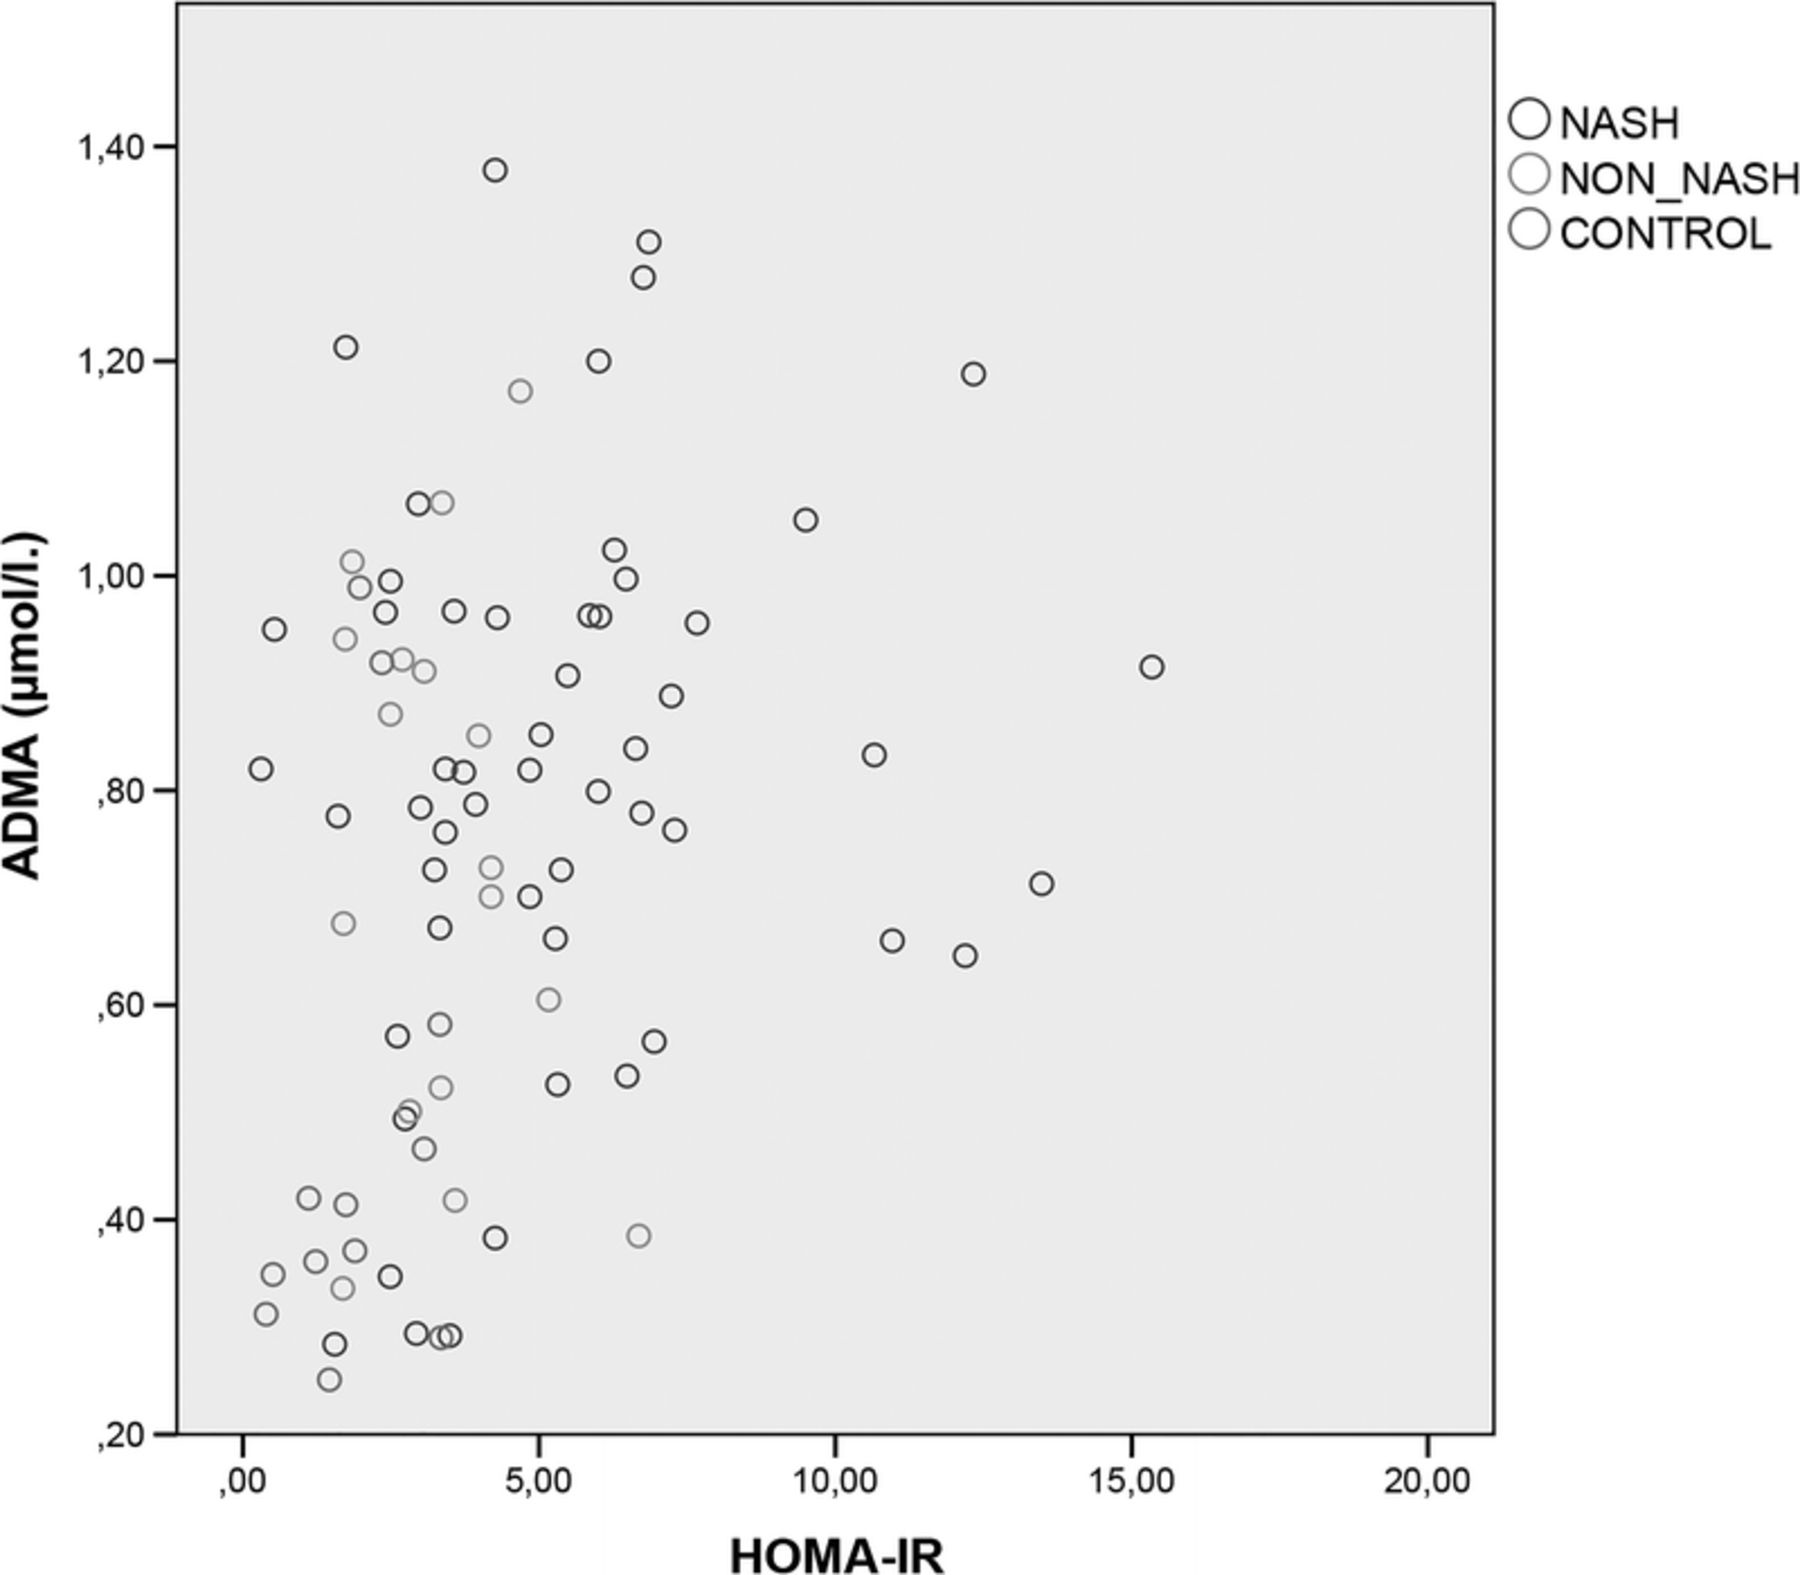
The scatter graph of HOMA-IR values plotted against ADMA levels in NASH, non-NASH, and control groups.
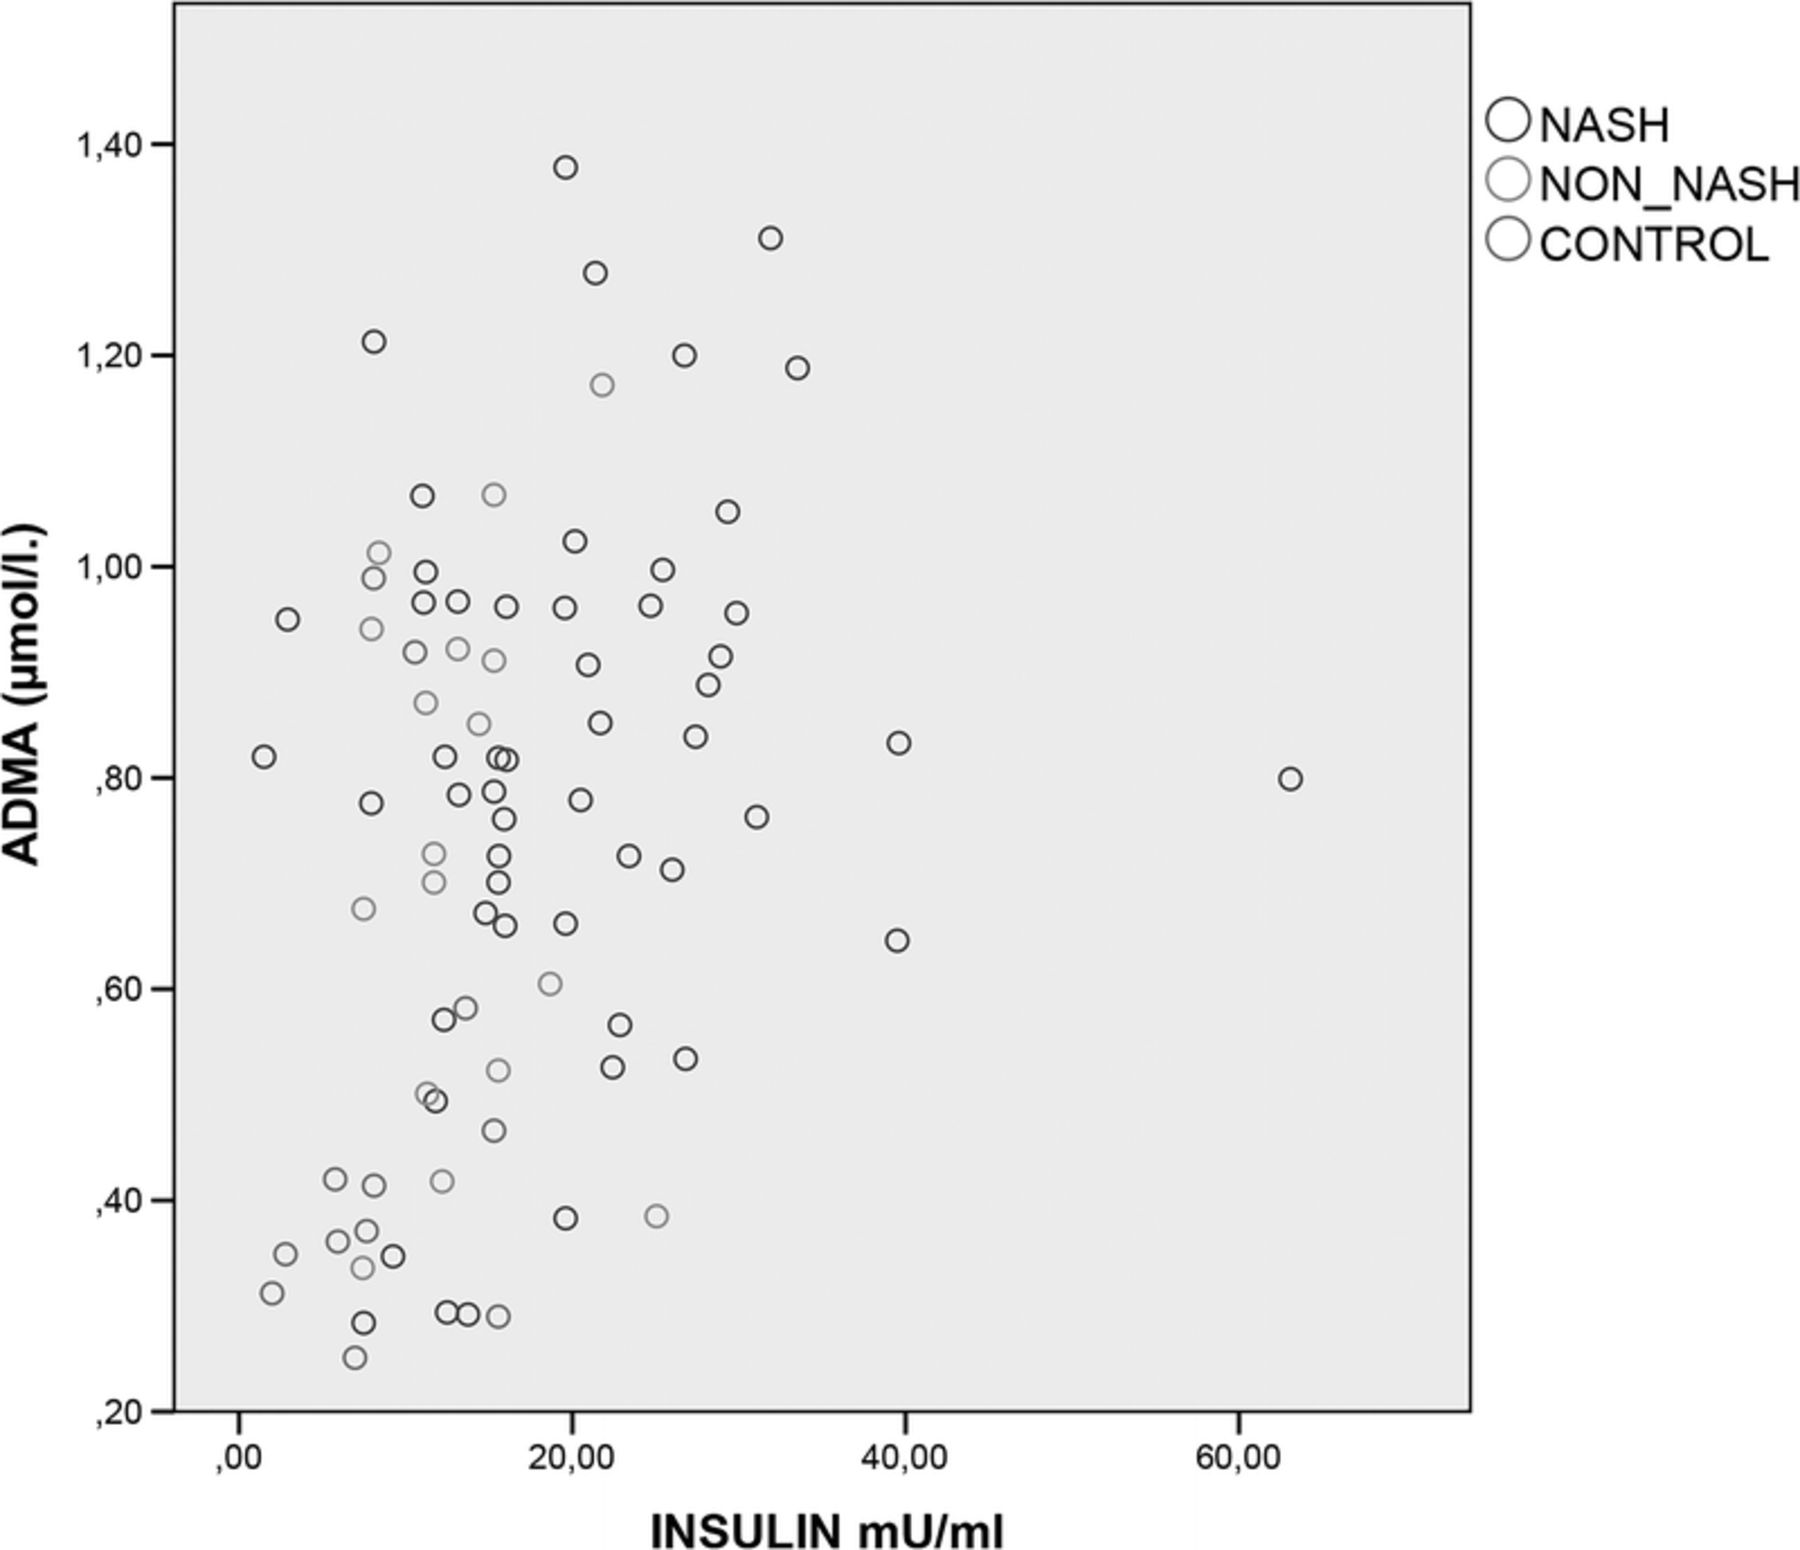
The scatter graph of insulin values plotted against ADMA levels in NASH, non-NASH, and control groups.
Discussion
To our knowledge, this is the first study evaluating the effects of insulin resistance and inflammatory biomarkers (hs-CRP and IL-6) on ADMA levels in patients with biopsy-proven NAFLD. Our study proved that as a novel marker of endothelial dysfunction and a predictor of future cardiovascular events, ADMA levels are increased in patients with NAFLD and ADMA levels have no significant relation with NAS, presence or absence of NASH, or any pathological finding such as stage of fibrosis, grade of steatosis, lobular inflammation, and ballooning. Although ADMA levels were found to be increased in patients with NAFLD and this increase was independent from HOMA-IR, the only determinant correlated with ADMA was HOMA-IR neither hs-CRP nor IL-6.
After the presentation of endogenous ADMA as a competitive inhibitor of NO synthase, 21 numerous numbers of studies showed that ADMA was an independent novel cardiovascular risk factor.22–24 Because NAFLD is a chronic inflammatory state related to insulin resistance and hepatic DDAH plays the dominant role in ADMA removal from plasma, there may be many possible factors effecting ADMA levels in NAFLD. Few studies conducted about this issue in the last 2 years reported conflicting results with normal 25 or elevated 26 ADMA levels in patients with NAFLD.
In our study, ADMA levels were significantly higher in patients with NAFLD; and after adjusting for age, body composition (BMI, waist and hip circumferences), and insulin resistance, this difference still remained significant suggesting that even though there is a significant correlation between ADMA and HOMA-IR, the increase in patients with NAFLD is not only due to the effect of insulin resistance and ADMA levels are independently increased in patients with NAFLD.
Because ADMA is primarily metabolized in the liver by DDAH, one can anticipate increased plasma levels of ADMA in NASH cases, more severe form of NAFLD, when compared with simple steatosis. Recently, Lluch et al. 27 found that elevated ADMA levels were correlated with the degree of liver failure in patients with alcoholic cirrhosis. Also, Vizzutti et al. 28 reported that ADMA levels in the hepatic veins of patients with compensated cirrhosis due to hepatitis C were significantly correlated with the degree of portal pressure. The lack of significant difference between NASH and non-NASH groups in our study may be due to the clinically compensated state of our study group, none showing any apparent hepatic dysfunction.
In their cross-sectional study, Stuhlinger et al. 29 reported that plasma concentrations of ADMA were showing a positive significant correlation with insulin resistance, a finding that is mostly agreed in review articles that are particularly focusing on this issue.11,30 This finding is also compatible with our study where HOMA-IR was found to be the only determinant correlating with ADMA. However, studies in the literature investigating ADMA levels in subjects with metabolic syndrome brought out contradictory results.31,32 Because increased ADMA concentrations in plasma are associated with conditions closely related to metabolic syndrome including hypertriglyceridemia, hyperglycemia, hyperhomocysteinemia, and essential hypertension,33–36 we hypothesized that ADMA levels should also be elevated in patients with NAFLD having metabolic syndrome. The result of our study showed significantly higher ADMA levels as well as higher HOMA-IR and hs-CRP in patients with metabolic syndrome, proposing elevated circulating ADMA as a pivotal link between increased rate of CVD and metabolic syndrome.
Tripepi et al. 37 investigated the interaction between CRP, IL-6, and ADMA to explain long-term mortality and CVD in 225 end-stage renal disease patients in a prospective study and reported that plasma levels of CRP and IL-6 were significantly related to ADMA levels. In our study, we did not observe any significant relation between hs-CRP, IL-6, and ADMA levels. We suggest that the discrepant findings of these 2 studies were likely due to differences in the populations of patients enrolled, specifically with respect to the age, number, and renal functions of patients. From inflammatory biomarker point of view, we found statistically significantly higher IL-6 concentrations in NAFLD compared with controls and in NASH compared with non-NASH. We also detected significant correlation of IL-6 levels with the grade of steatosis, lobular inflammation, and ballooning. In the study of Wieckowska et al., 17 hepatic IL-6 expression was prominent in patients with NASH compared with non-NASH and correlated well with the circulating IL-6 levels in patients with NAFLD. In addition, hepatic IL-6 expression was found significantly higher in patients with moderate or severe steatosis as well as moderate to severe lobular inflammation matching with the results of our study. Differently, they also reported a positive correlation between stage of fibrosis and IL-6 expression, which we did not observe in our study, instead HOMA-IR was the determinant in the present study showing a significant correlation with stage of fibrosis consistent with the literature. 38
Several limitations are inherent in this study. First, although there is no study about this issue with a larger scale, the relatively small sample size limits the generalization of our conclusions. Second, our patient group consists of subjects with Turkish nationality, so that results may not be extrapolated to populations with different ethnic backgrounds. Third, even though ADMA is a predictor of future cardiovascular events, following up these cases for a long period of time and recording any CVD occurred would provide valuable data about this issue.
In conclusion, a significant elevation of circulating ADMA levels was found in patients with NAFLD compared with control subjects. This is the first study in patients with biopsy-proven NAFLD evaluating the factors effecting ADMA, which is a predictor of future CVD, demonstrating that although ADMA levels are found independently higher in NAFLD, the only determinant correlated to ADMA is HOMA-IR and not inflammatory biomarkers. When remembered that NAFLD is the most common liver disease worldwide, further investigations in this issue by larger randomized clinical trials are unavoidably needed to identify NAFLD subjects who are at higher risk of developing CVD and try reducing cardiovascular risk by possible therapeutic modalities targeted to certain molecules.