
Abstract
Multiple studies have documented significant IQ gains over time, a phenomenon labeled the Flynn effect. Data from 20 industrialized nations show massive IQ gains over time, most notably in culturally reduced tests like the Raven's Progressive Matrices. To our knowledge, however, this is the first study to document the Flynn effect in a rural area of a developing country. Data for this project were collected during two large studies in Embu, Kenya, in 1984 and 1998. Results strongly support a Flynn effect over this 14-year period, with the most significant gains found in Raven's matrices. Previously hypothesized explanations (e.g., improved nutrition; increased environmental complexity; and family, parental, school, and methodological factors) for the Flynn effect are evaluated for their relevance in this community, and other potential factors are reviewed. The hypotheses that resonate best with our findings are those related to parents' literacy, family structure, and children's nutrition and health.
Significant gains in IQ over time, dubbed the Flynn effect, have been documented in 20 industrialized nations. These gains are most notable in tests that are reported to be culturally reduced, like the Raven's Progressive Matrices, although a rise in scores has also been observed in tests of crystallized intelligence (Flynn, 1987, 1999; Neisser, 1998). The average change—about 18 points (1.33 SD) over a generation, or 5 to 9 points per decade—has also been observed in children (e.g., Lynn, Hampson, & Millineux, 1987; Wheeler, 1970). No single explanation has satisfactorily accounted for the rise in measured IQ across the various data sets available, although numerous variables have been suggested to contribute to the Flynn effect.
One prominent explanation posited for the Flynn effect in developed countries is nutrition (Lynn, 1998). Better nutrition is hypothesized to affect brain function, and indicators of nutritional status are associated with improved cognitive performance. Mild to severely malnourished children show significantly compromised reasoning and perceptual-spatial functioning, poorer school grades, reduced attentiveness and concentration, unresponsive play behavior, and less activity and leadership behavior, as compared with their adequately nourished peers (Espinosa, Sigman, Neumann, Bwibo, & McDonald, 1992; Wachs, Bishry, Moussa, & Yunis, 1995). As nutritional status improves, malnourished children show significant cognitive gains.
Increased environmental complexity is a second previously hypothesized source of the Flynn effect. Individuals with intellectually stimulating and complex job conditions demonstrate increased cognitive flexibility (Schooler, 1998). Changes in technology, urbanization, and formal education paralleled a rise of IQ scores among rural children in eastern Tennessee (Wheeler, 1970). Specifically, youths' exposure to a more technological and complex visual world through toys, games, television, and computers may affect performance on IQ tests. Images typically seen on cereal boxes, restaurant placemats, and computer games resemble the patterns on tests such as the Raven's matrices, and exposure to these materials may improve performance on tests of visual-spatial abilities (Williams, 1998). Most recently, Flynn (2000) has argued that environmental and social factors serve as multipliers of certain cognitive skills and that a model of reciprocal causality therefore best accounts for the massive gains on IQ tests.
Family structure and parental factors also may contribute to the Flynn effect. A decrease in family size could increase resource (e.g., food, opportunities for schooling, educational materials) allocation per child (Downey, 2001). Increased parental literacy and education, greater income and resources, and migration from rural to urban areas also have been hypothesized to contribute to the Flynn effect (Schooler, 1998) by producing an overall IQ-enhancing, enriched environment for the child (Flynn, 1998). Greater exposure to urban areas and mobility between urban and rural environments also could lead to increased importance placed on schooling, and hence socialization practices that optimize cognitive performance.
School factors have been considered because increased years of school attendance could account for IQ gains in adults (Teasdale & Owen, 2000). For example, 1 year of schooling has a greater effect on both fluid and crystallized measures of intelligence than 1 year of age (Williams, 1998). Finally, methodological explanations of the Flynn effect focus on changes in tests, direct teaching to the test, and increased test sophistication that may bolster scores (Williams, 1998), for example, following strategies such as intelligent guessing and persevering through difficult items (Brand, 1987).
A major criticism levied against the Flynn effect research is that this phenomenon has been observed primarily in industrialized and urban countries, and has not been examined in a rural area of a developing country. In the current study, we attempted to fill this research gap. We focused on children in a relatively insulated rural area in order to sort out various proposed explanatory factors, using systematic data collected on the children's home and school environment. In this article, we have three goals: (a) to present (to the best of our knowledge) the first data on the Flynn effect from a rural area of a less developed country, Kenya; (b) to evaluate previously hypothesized explanations for the Flynn effect; and (c) to consider other factors that may have contributed to the rise in measured IQ in the community we studied.
METHOD
Participants and Procedure
This study was conducted in Embu District of Kenya. The study area is on the slopes of Mount Kenya, about 120 miles northeast of Nairobi. Embu District is an area of mixed agriculture, with mostly subsistence agriculture and some cash crops. The family structure is predominantly nuclear, with families living in homesteads scattered throughout the study area.
Data for this study were collected in 1984 and in 1998, allowing us to explore the Flynn effect over a 14-year period. The 1984 sample (Cohort 1) was composed of 118 children (mean age = 7.43 years, SD= 0.46), and the 1998 sample (Cohort 2) consisted of 537 children (mean age = 7.32 years, SD= 1.0). The two cohorts did not differ significantly in mean age, although children in Cohort 2 were more variable in age. The gender composition was comparable in the two cohorts (54.7% and 51.1% male, respectively). More than 95% of children in both samples were of the Embu tribe.
Child Measures
The cognitive battery contained the same three measures at the two time points. In the Raven's Colored Progressive Matrices (Raven, 1965), the child is presented with a matrix-like arrangement of symbols and asked to complete the matrix by selecting the appropriate missing symbol from a group of symbols. This test measures the ability to organize perceptual detail and to reason by analogy and form comparisons. The Verbal Meaning Test is similar to the Peabody Picture Vocabulary Test (Dunn & Dunn, 1981), but with culturally appropriate pictures developed with samples of urban children in Kenya, Tanzania, and Uganda. The child is presented with four pictures and asked to point to the one named by the tester. The Digit Span test requires the child to repeat a series of digits after the experimenter has said them.
For Cohort 1, food intake was assessed on 2 successive days each month over a 3-month period. Fieldworkers watched the mother cooking, measured the volume and weight of ingredients, and weighed the food eaten from 7:00 a.m. to 6:00 p.m. each day. The child and mother were interviewed on the following mornings about foods they ate during the observer's absence, and the child was asked about food eaten outside the home. Cronbach's alpha was .72 for kilocalories consumed and had similar values for other measures of food intake (e.g., protein, animal source protein, vitamin B12). For Cohort 2, food-intake data were obtained through 24-hr recall of food intake on 3 nonconsecutive days and a 1-week food-frequency measure. The 24-hr recall procedure involved asking parents what was eaten during a 24-hr period, measuring quantities using household utensils, and estimating how much was lost during cooking. For the 1-week food-frequency measure, parents indicated how many times in a given week each person ate a particular food. At both time points, we used standard recipes and an extensive nutrient database, for which more than 50 local foods had been analyzed through biochemistry and physical means (see Espinosa et al., 1992, for details about this measure).
Information on the children's health (anemia, hookworm, and ascaris) at both time points was obtained from laboratory results of blood and stool samples taken from the children by trained fieldworkers. Biochemistry at both time points was analyzed in Kenyan laboratories.
Parent and Household Measures
Demographic information obtained included parents' age and marital status, composition of the household and age of each member, amount of time parents were away from the household, and number of years of parents' schooling. Parents' literacy was also assessed with a series of 11 passages extracted from the English reading textbooks from Standard 1 through Form 4 (roughly 1st through 11th grade). The passages were translated into Kiembu by bilingual speakers, and respondents chose whether to be tested in English or Kiembu.
Design and Procedure
In Cohort 1, sampling occurred at the household level; households were selected for inclusion on the basis of the presence of family members of different ages (see Espinosa et al., 1992, for detailed explanation of this procedure). Participants in Cohort 2 were obtained through 12 schools in the region that had been selected to participate. Schools were selected on the basis of their size and location: They had to have between 15 and 90 children in Standard 1 classrooms in the 1st year of the study (1998) and to be accessible to a vehicle traveling on one of the dirt roads in the area. Families were invited to participate through community meetings, and no families declined participation.
Some exclusions were made to minimize bias due to differences in the recruitment procedures for the two samples. Thirteen children from Cohort 1 were excluded because they were not attending school at the time of the data collection. Also, to avoid possible inflation as a result of age, we excluded from all analyses 18 Cohort 2 children who were 11years or older.
Cognitive testing took place in June and July of 1984and June through August of 1998. The tests were administered in the local language (Kiembu). The same supervisor trained all six testers for each cohort, and three of the testers conducted the cognitive battery for both cohorts. Children were tested individually at their school or after school at their home. For the Raven's and Verbal Meaning tests, all items were administered to each child, and the total number correct on each test was calculated. For the Digit Span test, the number of digits the child had to recall was increased until he or she failed on three consecutive attempts. In 1984, repeat reliability for the Digit Span test was significant, r(128) = .68, p < .0001. In 1998, approximately 15% of the cognitive testing was observed simultaneously by two testers, and the interrater reliabilities were between .990 and .997. These three measures are intercorrelated. Construct validity was assessed by calculating the correlation between a composite of the Verbal Meaning and Raven's scores and the mean school examination scores; the correlations were significant for both cohorts, r(102) = .56, p < .0001, in 1984 and r(531) = .33, p < .0001, in 1998.
A local, trained fieldworker obtained demographic information during a home visit. The six child cognitive testers administered the adult literacy testing at parents' homes. For Cohort 1, 29 adults were tested simultaneously by two examiners, and the scores agreed perfectly. Approximately 15% of the parents in Cohort 2 were tested simultaneously by two testers, and the interrater reliability for both mothers' and fathers' reading and writing tests was .99.
RESULTS
Analysis of the Flynn Effect
We conducted t tests to compare the children on the three cognitive measures. The Flynn effect clearly emerged, as there were significant increases on the Raven's, Verbal Meaning, and Digit Span tests. On the Raven's test, the increase of 4.5 points over a 14-year period is consistent with findings from industrialized countries. To control for the greater variance in age in Cohort 2, we also ran analyses comparing 294 children from this cohort who matched the age of Cohort 1 exactly. There was virtually no change in the significance or magnitude of the effect for the Raven's and Verbal Meaning tests, but the gain seen on the Digit Span test was eliminated in this analysis. Results for the two cohorts and the 1998 restricted-age sample are presented in Table 1.
Mean raw scores on the three cognitive tests
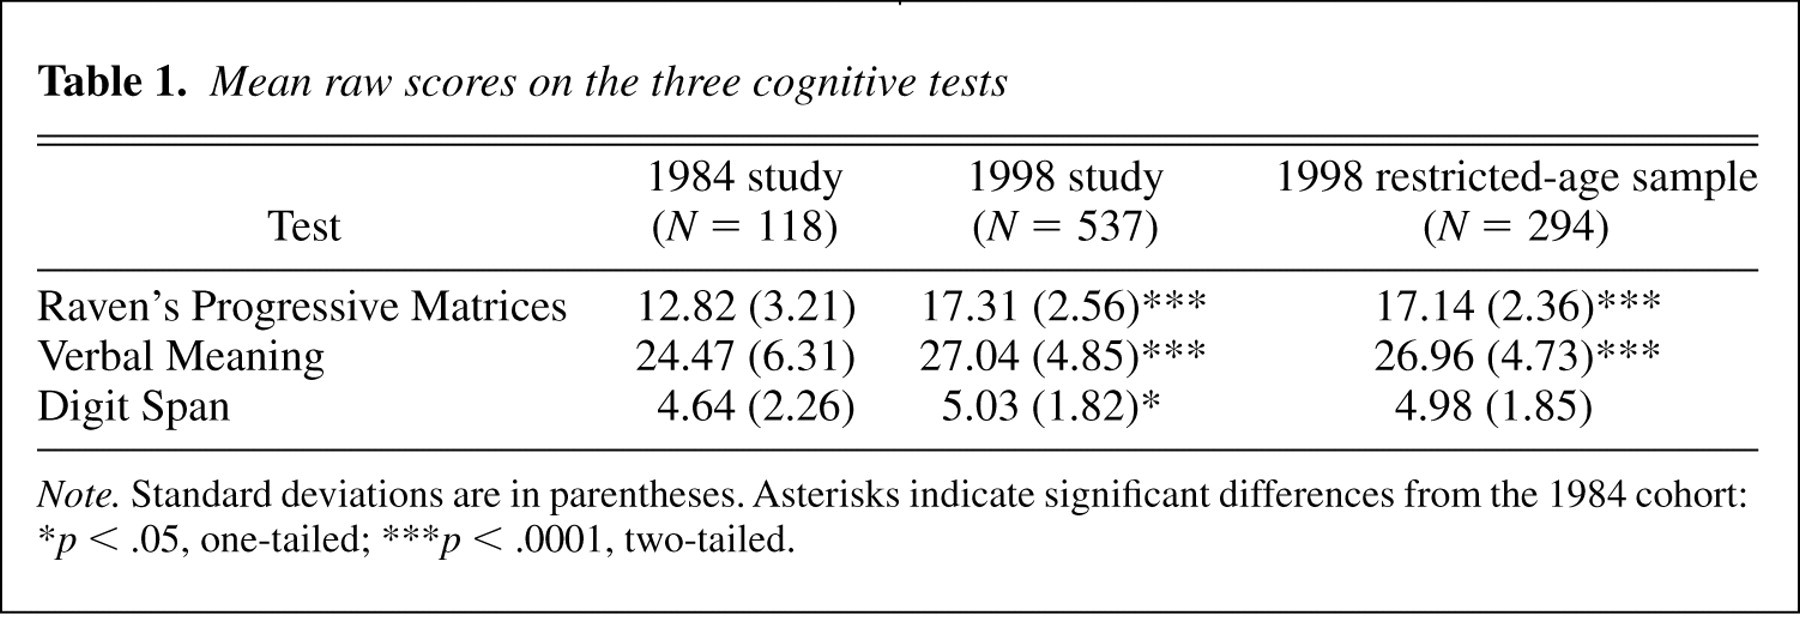
Note. Standard deviations are in parentheses. Asterisks indicate significant differences from the 1984 cohort:
∗ p < .05, one-tailed;
∗∗∗ p < .0001, two-tailed.
The equivalent gain in IQ points on the Raven's test can be calculated using the standard deviations of the raw scores shown in Table 1 (J. Flynn, personal communication, May 22, 2002). This calculation yielded a gain of 1.75 SD, or an IQ gain of 26.3 points over the 14 years. This would correspond to a gain of 56 points over a 30-year period, much higher than any other gain recorded. However, calculating the gain using a raw score standard deviation of 6 points, which is typical of industrialized nations, yielded a gain of about 0.748 SD or 11.22 IQ points, or 24 points over 30 years. This gain is still higher than what has been observed in industrialized nations. The increase on the Verbal Meaning Test, though smaller in magnitude, suggests the changes go beyond fluid intelligence.
Potential Explanatory Factors
Nutrition
Analyses of kilocalories and protein demonstrated differences between the diets of children in 1998 and 1984 (see Table 2). Specifically, children in 1998 had significantly more kilocalories, t(633) = 5.26, p < .0001, and protein, t(633) = 5.80, p < .0001, than did children in 1984. No differences were seen in animal source protein or Vitamin B12. In addition, in 1984, the caloric intake of 55.5% of the children was insufficient; by 1998, only 35.8% of the sample had insufficient caloric intake.
Comparison of nutritional and health data between cohorts
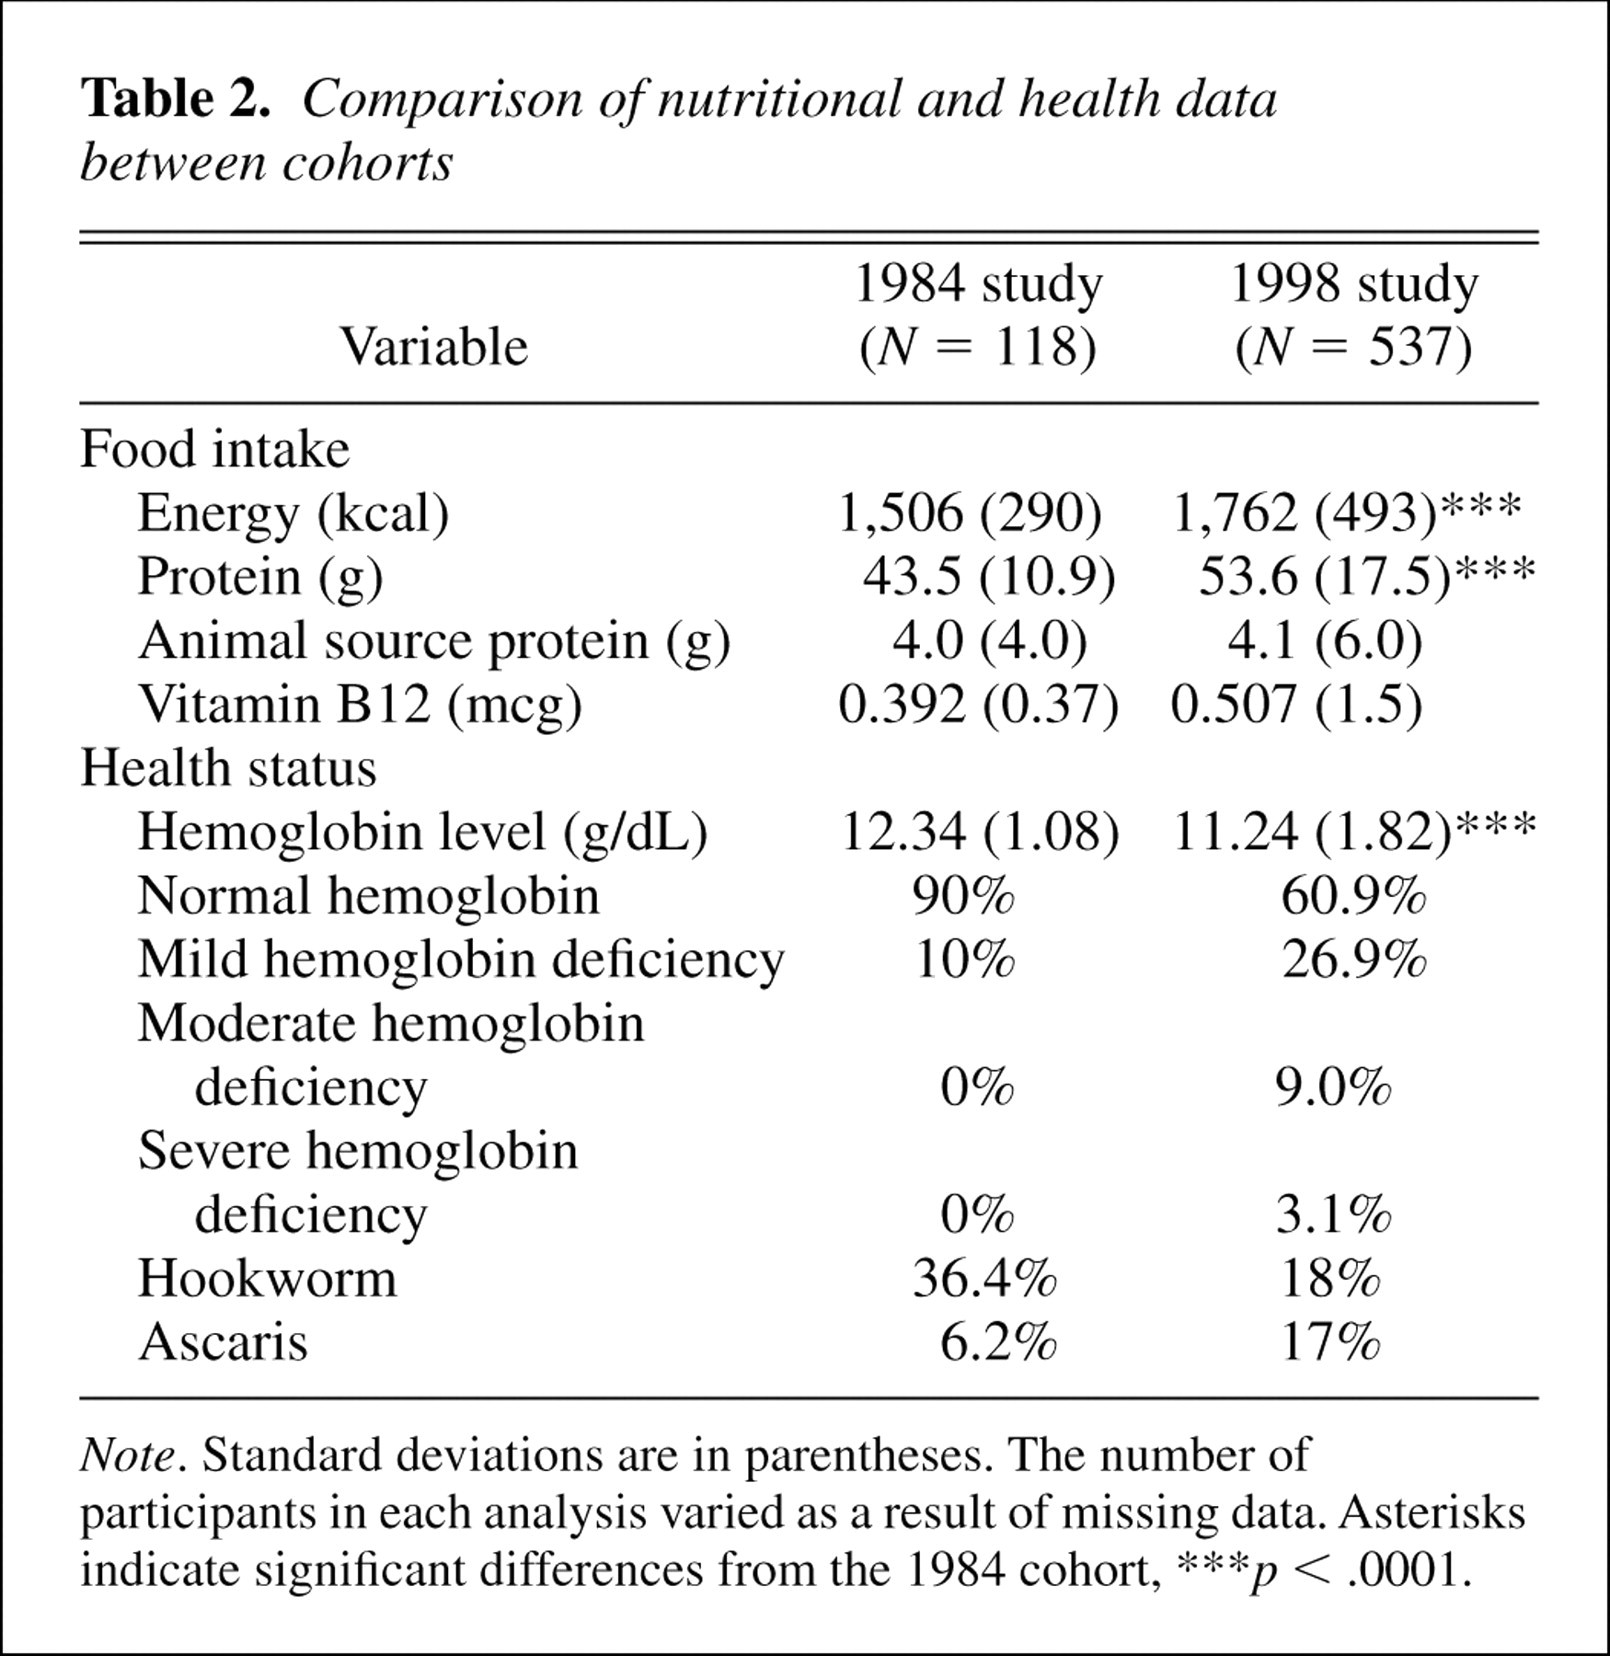
Note. Standard deviations are in parentheses. The number of participants in each analysis varied as a result of missing data. Asterisks indicate significant differences from the 1984 cohort,
∗∗∗ p < .0001.
Environmental complexity
Prefabricated toys and games, placemats from fast-food restaurants, and cereal boxes were scarcely seen by the 1998 cohort. Such artifacts were therefore unlikely to have had the effect on these children that video games might have on Western children. Television, however, did add complexity to this community. In 1984, no family was known to own a TV set, but by 1998, 9% of households reported owning a TV. Exposure to print material (e.g., newspapers) was not measured in 1984. In 1998, 66% of parents reported reading a newspaper or magazine at least once a week, and these materials may have been in household areas where children would have had access to them. More distal forms of visual complexity, for example, an increase in billboards on the main roads and elaborate visual images on packaging of household items, could not be measured in this study and remain an unknown influence.
Family factors: Family size and family structure
Despite the population rise in Kenya over this period, family size significantly declined from an average of 9.2 household members in 1984 to 6.7 in 1998, t(612) =−7.39, p < .0001. If this decrease in family size meant that families were able to spend more money on each child in the family, the 1998 sample may have been leading a more comfortable life than the 1984 cohort.
Comparison of birth order also revealed a significant difference between cohorts. Children in the 1998 cohort were significantly more likely to be firstborns than were children in the 1984 cohort, χ2(4, N= 613) = 11.001, p= .001. However, the Flynn effect observed in this study cannot be attributed to the preponderance of firstborns in Cohort 2 because scores on the three cognitive measures did not differ significantly between firstborn children and later-born children for either cohort. These findings, then, do not support the resource-dilution hypothesis that earlier-born children have certain material advantages that can contribute to higher cognitive performance.
Another possible source of a family-level contribution to the Flynn effect relates to older siblings. Given that sibling caretaking continues to be common in Kenya, as in much of Africa (Weisner, 1997), perhaps older siblings of the 1998 cohort promoted their young charges' cognitive development by either organizing activities for them or directly teaching them. This explanation might be particularly likely if a greater number of older siblings were attending school in 1998 than in 1984. However, a comparison between the cohorts showed that a significantly higher percentage of older siblings in 1998 had attended no school rather than the reverse, χ2(4, N= 1,266) = 18.77, p= .001.
Changes in family structure occurred during this 14-year period. In 1984, the Embu population was stable, and out-migration was low. Only about 4% of the fathers were away from home for more than two thirds of the year. By 1998, this figure had doubled, with many fathers seeking employment in Nairobi. In addition, a dramatic shift in mothers' marital status occurred during these 14 years. Whereas 100% of the mothers reported being married or cohabiting in 1984, this figure dropped to 82% in 1998, χ2(4, N= 579) = 23.17, p < .0001.
Parental factors: Education and literacy
There was a clear rise in reported parental education and literacy. In 1984, 26% of the mothers reported having no schooling at all, and only 6.8% reported having more than a Standard 8 education. In contrast, in 1998, only 8.7% of mothers reported having no schooling, and 17.5% reported having more than a Standard 8 education, χ2(5, N= 565) = 33.05, p < .0001. Fathers in 1984 received more education than mothers at that time, and fathers in 1998 clearly attained higher educational levels than fathers in the 1984 sample, χ2(5, N= 485) = 21.07, p < .001.
Consistent with this increase in reported parental education, literacy testing revealed that parents of the two cohorts differed in their level of fluency in reading and writing. Although both reading and writing scores were higher for both mothers and fathers in the 1998 sample than in the 1984 sample, these differences were significant only for mothers. In just a 14-year period, mothers' reading ability increased from 4th Standard to almost 7th Standard, t(215) = 4.82, p < .0001, and writing scores increased from 4th Standard to 5th Standard, t(197) = 2.4, p= .018. In addition, data from the 1998 sample indicated fairly high levels of literacy exposure; in addition to reading the newspaper, 34% of heads of households or wives in the households were listening to the radio or watching TV. Although these are not direct measures of beliefs about school, 31% of households in 1998 reported belonging to a parent or school group, and parents reported that 16% of the total household budget was spent on school-related expenses.
School factors
Children in both cohorts attended school and were tested just 4 months after starting their 1st year. School attendance itself is therefore unlikely to be related to achievement in these samples. Although we have no empirical data to document a change in the quality of the schools, the impact of school quality on cognitive performance is also unlikely to be a significant factor, given the short time these children had attended formal school. However, we were able to consider an additional factor: preschool attendance. Examining the preschool-age younger siblings of the target children in this study, we found a significant increase in nursery school attendance; 7.3% of the younger siblings attended in 1984 and 15.2% attended in 1998, χ2(1, N= 489) = 7.58, p= .006. In a French sample, Flieller, Saintigny, and Schaeffer (1986) demonstrated that 3.75 points out of a 24-point gain in measured IQ could be attributed to more preschool education. Perhaps the 1998 cohort was academically more prepared than the 1984 cohort.
Sunday school attendance may be another source of increased education. Embu is a very religious community, and parents reported a significant increase in Sunday school attendance, from 90.2% in 1984 to 98.6% in 1998, χ2(1, N= 616) = 21.07, p < .0001. Thus, Sunday school served as an extra day of schooling for many children.
Methodological factors
One methodological issue often raised in research on the Flynn effect is whether children are now being specifically taught to test well. Given that the cognitive tests in this study are unlike Kenyan standardized exams and unfamiliar to Embu teachers, teaching to the test is an unlikely explanation for the observed Flynn effect. Other methodological concerns related to changes in IQ tests over time are readily addressed in this study: Identical versions of the tests were used at the two time points, and the two cohorts were tested under the same conditions, during the same months (June–August) and 4 months into the beginning of their 1st year of formal schooling. Moreover, half the cognitive testers were the same at the two time points, and all were trained by the same supervisor. The Flynn effect demonstrated in this study is especially compelling given the virtually identical testing conditions.
Health status
In a country where infectious diseases, poor nutrition, and poor socioeconomic conditions are synergistically related (Neumann, McDonald, Sigman, Bwibo, & Marquadt, 1991), changes in childhood illness may also contribute to changes in cognitive performance, such as the Flynn effect. Blood tests taken during the early months of the study in both cohorts showed that hemoglobin counts, an indicator of anemia, became significantly worse over this time period, t(597) =−7.92, p < .0001 (see Table 2). In addition, no children in 1984 were found to have severe anemia, whereas 3% of the 1998 sample did. Comparisons of intestinal parasites suggest that 6.2% of the 1984 sample had ascaris ova in their stool, compared with 17% of the 1998 sample. However, hookworm infestation, which can cause severe anemia, was lower in 1998 (18% of participants) than in 1984 (36.4% of participants).
DISCUSSION
The current study establishes the presence of the Flynn effect in a rural area of a developing country. The dramatic gain in Raven's scores surpassed that found in previous studies, and scores on the Verbal Meaning Test also showed significant improvement. The larger size of the effect for the test of fluid intelligence (the Raven's test) than for the test of crystallized intelligence (the Verbal Meaning Test) is similar to other findings (Flynn, 2000).
We also explored possible causal factors for the Flynn effect. The hypotheses that resonate best with our findings are those related to parents' literacy, family structure, and children's nutrition and health. As reported, maternal education increased from 1984 to 1998. In addition, family structure shifted in that mothers were more likely to be unmarried. Perhaps these more educated and independent mothers recognized a strategic advantage gained through education, and thus emphasized school-related skills to their children through everyday socialization practices. This explanation is consistent with Buchmann's (2000) finding that rural Kenyan parents who held the belief that children had an obligation to provide financial help to them in the future were more likely to send their children to school than were parents who did not have this belief. In Embu specifically, parents in 1995 reported more emphasis on education in the community than 10 years prior (Swadener, 2000). Thus, a shift in values toward an emphasis on schooling may have occurred during the period of our study as a result of a combination of increased parental education and an emphasis on school-related skills and knowledge. This explanation, though not wholly satisfactory, appears more compelling than others.
Changes in children's nutrition and health may have also contributed to increased cognitive scores. Over this 14-year period, a significant increase in energy and protein intake was observed, suggesting that children in 1998 had both more food and higher-quality food available than did children in 1984. Nutrition alone, however, is unlikely to account for the significant gains in IQ scores. Nutritional gains are likely to enable broad environmental factors rather than to have a direct effect.
The many children infested with hookworm in 1984 may have been iron deficient, and iron deficiency is associated with decreased cognitive abilities (Grantham-McGregor & Ani, 2001), even in the absence of anemia (e.g., Halterman, Kaczorowski, Aligne, Auinger, & Szilagyi, 2001). Other sources of anemia in this population are deficiencies in Vitamins A and B12, and malaria. Our findings are consistent with Embu parents' reports, in another study (Swadener, 2000), that children's health is better than it was 15 years ago. Thus, the information on health status in this population can provide an avenue of inquiry that has not been systematically examined in research on the Flynn effect.
Our study is the first we are aware of to examine the Flynn effect in a rural population of a developing country. We have presented preliminary evidence, using the most directly comparable data available to us, related to each of the previously hypothesized causal factors of this phenomenon. Our analyses suggest that it might be profitable to pay less attention to environmental complexity and more attention to the role of nutrition, parental education, and children's socialization, although our results may not necessarily be applicable to the industrialized world. We encourage researchers to take up the challenge to isolate social and economic contributions to the Flynn effect in other rural communities.
Footnotes
Acknowledgements
This work was supported by the Global Livestock Collaborative Research Support Program, funded by the Office of Agriculture and Food Security, Global Bureau, U.S. Agency for International Development, under Grants DAN 1309-G-SS-80, DAN 1309-A-00-9090-00, and PCE-G-98-00036-00. The opinions expressed do not necessarily reflect the views of the U.S. Agency for International Development. We gratefully acknowledge Terry Au and Thomas Weisner for their helpful comments and revisions, and James Flynn and two anonymous reviewers for their thorough review and suggestions for this article.