
Abstract
We use the Great British Class Survey to examine the association between social background, university attended and social position for over 85,000 graduates. This unique dataset allows us to look beyond the very early labour market experiences of graduates investigated in previous studies and to examine the outcome of attending particular institutions. We find strong evidence of distinct stratification of outcomes by university attended, even within the prestigious Russell Group. There are marked differences in entry to elite positions for graduates of different universities, with sharp gradients in levels of economic capital in particular. The ‘golden triangle’ of Oxford, Cambridge and certain London institutions emerges as a distinct elite. However, even within that grouping there are striking differences, with Oxford ahead of Cambridge on several measures. These findings underline the importance of a geographically concentrated set of elite universities in channelling access to top positions in British society.
Over recent decades, there has been increasing academic and policy interest in the impact of higher education on social mobility and entry to elite occupations. These concerns are fuelled by the marketization of the higher education sector and recognition that its dramatic expansion requires a more fine-grained analysis, distinguishing between the fortunes of graduates from different universities. Although the proliferation of league tables has generated strong recognition of pecking orders, status and funding hierarchies, these have rarely been linked to systematic social scientific studies of social reproduction or elite recruitment. We address this deficiency by using the BBC's Great British Class Survey (GBCS). This provides a uniquely granular account of attendance at specific universities, and studying specific subjects, in facilitating access to socially advantaged positions, situating this analysis in the context of other contributory factors.
In addition to unusually detailed questions on the social background and economic, cultural and social capital of 161,000 respondents, the GBCS also captures the specific universities respondents attended. Previous large-scale analyses of the relationship between social background, attendance at university and subsequent outcomes relied on data undifferentiated by institution or institution type attended, 1 where sampling error meant insufficient graduates from whom to draw conclusions about individual institutions; or where data refers to very early points in graduates' careers. Studies of graduate outcomes for particular institutions have focused on the most elite institutions only (eg Oxford and Cambridge) frequently drawing on historical data, sometimes into the nineteenth century (eg Joyce, 2013). The absolute size and rich detail of the GBCS provide novel evidence on the capitals of and outcomes for those with higher education qualifications, with hundreds of respondents for individual universities across the working-age population.
In our analysis of the GBCS, attending specific elite universities is associated with advantaged economic positions, even controlling for known influential factors (eg attending independent schools, coming from advantaged class backgrounds). We conduct this analysis recognizing that the GBCS is a complex, non-representative dataset, needing careful interpretation and reflection to allow inferences to be made. Even recognizing these cautions and caveats, we demonstrate several original findings. With respect to subject choice, we show (taking other relevant variables into account) that social science and law graduates are systematically advantaged over those in the natural sciences and engineering who might be thought also to be relatively advantaged. Graduates of arts and humanities subjects are shown to be especially relatively disadvantaged.
With respect to attendance at specific universities, we show (a) clear advantages accruing from attending Russell Group (RG) universities compared to other kinds of higher education institution; (b) that the RG is highly striated amongst its own members; (c) more specifically that there is a strong regional bias in which RG members in London (especially) and south-east England considerably out-perform RG universities in other parts of the UK; and finally, and most specifically (d) that Oxford graduates are clearly advantaged over any other university, including Cambridge. These findings, we believe, indicate the need to understand the effects of higher education on social and economic outcomes as strongly internally stratified, so that we need to pay attention less to the role of university education in general in affecting outcomes, and more towards their differentiated role.
We proceed by reviewing the different literatures on the relationship between universities and elite recruitment. Currently there is little bridging ground between (a) studies using national survey data with insufficient sample size to disaggregate particular university outcomes; and (b) studies of graduate outcomes for particular universities. Based on its large sample size and its comprehensive questions, the GBCS offers considerable potential for sociological analysis of the relative institutional significance of different universities in affecting outcomes across various measures of social advantage.
Having made this point, the second section examines the serious methodological problem of sample selection bias within the GBCS (see further, Devine and Snee, this volume). We consider whether graduates of particular universities are more predisposed to have completed the GBCS and reflect on whether this may affect our findings. Linking GBCS response rates to Higher Education Statistics Agency (HESA) data, we show that the most elite institutions report higher response rates. This is itself interesting, but because there are relatively muted differences in response rates between RG universities, we feel able to use the GBCS to compare outcomes between them. Our third section considers the relationship between qualification levels and membership of class 1 from the seven-class National Statistics Socio-Economic Classification (NS-SEC) schema and the ‘Elite’ class distinguished by Savage et al. (2013). This section shows that the proportion of NS-SEC1 in the GBCS and representative sample surveys is reasonably close and reassures us that the dataset is usable for our purposes, with caution.
Fourthly, we move onto the key issues of our paper. We examine the gross patterns of association between attending specific universities and different indicators of advantage, including measures of ‘economic’, ‘social’ and ‘cultural’ capital, and entry to NS-SEC class 1, and the ‘Elite’ class defined by Savage et al. (2013). Here we show systematic, and considerable, inter-university differences within the RG. This is strong, prima facie evidence for internal stratification between even the most prestigious universities.
The fifth section develops a regression model to see whether the association between attending particular universities and certain measures of advantage remains when controlling for other salient variables, including subject discipline. Even with these controls included, striking variations between universities remain. Finally, we conclude by considering the implications of our findings for understanding how the stratification of the British higher education system intersects with the production and reproduction of advantage.
Universities and social advantage
The power of educational qualifications to convey social advantage is unquestioned. It has been established by scholars of different persuasions and through all relevant methodologies. In Britain the older tradition of research on elite education is generally cast within a ‘sociology of professions’ framing in which the focus is on dynamics of elite recruitment. In relation to universities, this includes Kelsall et al. (1972) on graduates, Wakeford and Wakeford (1974) on vice chancellors, and Halsey (1992) on academics. This literature grew out of debate about the hold of the ‘establishment’ and was marked by concern with the power of private education and Oxbridge in permitting privileged routes into these positions. Recent research by the UK's Social Mobility and Child Poverty Commission confirms that such concerns endure, finding massive over-representation of the independently schooled and Oxbridge-educated among 4,000 leading individuals in politics, the armed forces, the media, business and sport (Social Mobility and Child Poverty Commission, 2014).
Within the UK, early studies of educational advantage across the whole population focused on school effects, especially the different prospects of children from independent and different types of state schools in attaining middle-and upper-class positions (see, notably, Halsey et al., 1980). As the school leaving age and the proportion of children going to universities rose, there was increasing recognition that later stages of educational attainment might become decisive. Roberts (2010) contends that higher education is now a central aspect of middle-class formation in Britain, particularly in distinguishing an upper-middle class.
Higher education's role in generating advantage in terms of status, occupational entry and earnings is widely attested in survey analyses in the political arithmetic tradition (eg Breen and Jonsson, 2005; Halsey, 1993) and by education and labour market economists (eg Macmillan and Vignoles, 2013; Walker and Zhu, 2013). This tradition has focused on the simple contrast between graduates and non-graduates. An exception is comparative research on ‘institutional stratification’ addressed at the ‘persistent inequality’ (Shavit and Blossfeld, 1993) debate. Here the ‘effectively maintained inequality’ thesis maintains that educational expansion does not reduce inequality since within-education-level inequalities replace between-education-level differences (Lucas, 2001). Once those from relatively disadvantaged class positions are present in higher education in large numbers, the type or status of the institution attended accrues much greater salience and systems tend to diversify. Shavit et al. (2007) address institutional stratification cross-nationally, concluding optimistically that expansion of higher education has been primarily a process of inclusion rather than diversion of lower-status students to lower-status tracks or institutions. However, the data presented in respect of the UK (Cheung and Egerton, 2007) is quite old and with insufficient sample size or detail to distinguish individual universities or even groups of institutions.
Studies in the discipline of higher education increasingly recognize inequalities and diversity within the university field, both in the UK and internationally (Marginson, 2006). These attest to differences in funding, status, and the qualifications and background of students. In the UK, recognition of these differences has inspired research on the nature of unequal entry to universities, especially amongst the elite. Studies of the fairness of admission to university show stark differences between institutions of different type, although they rarely distinguish between individual universities. Thus expansion has not improved the relative odds of disadvantaged groups entering high-status institutions and there remain advantages for privately educated, white, and higher class students in university enrolment, even allowing for prior attainment (Boliver, 2011, 2013; Raffe and Croxford, 2013). Studies focusing on particular institutions have tended to use just one or two universities as case studies (eg Bathmaker et al., 2013; Tholen et al., 2013; Zimdars et al., 2009).
Few studies examine how attending particular universities is related to graduates' prospects. In the UK this is principally due to difficulties in finding adequate, granular data. Conventional large-scale surveys such as the Labour Force Survey and cohort studies such as the 1958 National Child Development Survey hold insufficient detail about institution attended and would be subject to large sampling error in any case. Researchers have been limited to data on graduates' early careers, typically six months to three years after graduation (eg Macmillan et al., 2013; Purcell et al., 2012). The exception is Walker and Zhu (2013) who, using the British Household Panel Survey, found higher earnings for RG graduates, controlling for father's education and A-levels.
Our investigation thus contributes to the field in two ways. First, it provides a more detailed and granular analysis of differential outcomes by institution than has been attempted with British data. Secondly, it allows us to look beyond graduates' early labour market experiences to investigate the longer-term outcomes associated with particular institutions and types of institution.
Data and analysis
The GBCS was a web survey, launched in January 2011, obtaining 161,000 responses by summer 2011, when it was delivered to the research team to analyse. 2 Its focus was on developing detailed questions to map cultural and social capital, alongside some questions on economic capital (see the general discussion in Savage et al., 2013).
The GBCS contains over 85,000 UK-based graduates. 3 It contains information not only on the specific universities respondents attended, but also their field of study and type of secondary school. There are no comparable UK datasets (including the Labour Force and General Household Surveys, Understanding Society, or the Census). Because of the very rich information in the GBCS on cultural, social and economic capital, it allows unprecedented ways of linking university attendance to a range of sociologically pertinent outcomes.
However, we must immediately address a fundamental question of the sample skew of the GBCS, which is towards the well-educated, affluent and those in professional and managerial occupations (see Savage et al., 2013). It has been argued that this skew disables the GBCS as a source from which inferences can be drawn about representative patterns (see Mills, 2014). Whilst we fully recognize these problems in using the GBCS, we take the pragmatic view that cautious assessment of the nature of the skew can allow inferences to be drawn regarding the role of sample selection bias so that it remains possible to draw out findings which are, at the very least, suggestive. We therefore seek here to provide careful presentation of the response rates across different variables, considering not only the ‘macro-skews’ towards the well-educated and affluent, but also the micro-skews towards particular occupations and graduates from specific institutions. Such exercises will not remove the risk that the patterns may be associated with sample bias linked to unobserved factors (Mills, 2014) but nonetheless, they make plain the nature of the skew so that judgements can be made about whether they are likely to affect the findings. Whilst our conclusions can only be provisional, in the absence of other data on these issues, we believe that they nonetheless should command interest.
The first part of our work therefore assesses whether the macro skew towards the well educated as a whole is repeated across graduates of different universities. To be specific, we need to establish whether graduates from different types of universities are more likely to have completed the GBCS. We can do this by considering the responses from graduates of different universities, benchmarked against the size of the universities as measured by official HESA data. We only include graduates aged 25 to 34 in order to (mainly) exclude current students, and to provide a 10-year cohort which can be benchmarked against HESA data on the size of universities in 2002. 4 The resulting details are necessarily elaborate, and are therefore listed in Appendix 1.
We can be reassured that the two distributions in Appendix 1 (HESA and GBCS) correlate strongly (r = 0.82), so we can be confident that the GBCS gives a reasonable coverage of graduates from different universities. However, over-representation is not constant across all graduates: marked inter-university variances are evident. This differentiation, we suggest, is intrinsically interesting in pointing to the possibility of university effects themselves. There are several dimensions to this institutional ‘micro-skew’. In general, we can detect a clear ‘elite effect’. Most over-represented universities are RG or 94 Group institutions. Almost all the under-represented institutions are new universities. The most over-represented ‘new university’, Portsmouth, appears 36th in the ranked list.
Within the RG we see further ‘micro-skews’. Most obviously, the largest over-representation – by some margin – comes from the elite universities of Oxford and Cambridge, and to a lesser extent Manchester. The over-representation of such graduates is twice that for only the fifth university in our rankings. Nonetheless, careful scrutiny of Appendix 1 reveals that these patterns of over-representation are more complex than a simple ‘elite’/non-elite binary. A few prestigious universities are under-represented – most notably Queen's University Belfast and Queen Mary, University of London. Leaving aside the special cases of Oxford and Cambridge, it is the large urban universities of Scotland, the North and Midlands of England which tend to have the highest over-representation. Thirteen of the top 20 most over-represented institutions are from outside the south-east of England.
This exercise implies that we should be cautious in using the GBCS to compare all UK universities. Any differences identified between RG and ‘new’ universities, for instance, might reflect the different response rates between them, and the possibility that respondents from the new universities are less typical of their peers than those from the RG. However, we can, cautiously, use the GBCS to compare differences amongst the RG itself since response rates from RG institutions differ less, though we should also bear in mind some important variations within the RG. In particular, we have to note the special Oxbridge factor, which probably means that differences observed between Oxbridge and other RG universities could be underestimated in our analysis. This is because one might expect the larger proportion of Oxbridge graduates responding to be somewhat more representative than the smaller proportion of RG respondents who, qua GBCS respondents might be relatively more likely to have higher amounts of economic, social and cultural capital than their peers.
Finally, we consider whether certain disciplines are over-represented. Figure 1 below uses data on graduates aged 25–34 to compare GBCS respondents against national benchmarks. The patterns do not show major discrepancies. Arts and humanities, and science graduates are somewhat over-represented amongst GBCS respondents compared to the HESA benchmark (32 per cent GBCS compared to 24 per cent HESA for arts and humanities, and 26 per cent GBCS compared to 19 per cent HESA for science). By contrast there is under-representation of (especially) medical students (5 per cent GBCS compared to 12 per cent HESA), business and management (8 per cent compared to 14 per cent), and social science graduates (16 per cent compared to 19 per cent). Given that GBCS was a sociological ‘experiment’, the relative under-representation of social science graduates is worthy of note. It is possible that these differences are associated with the institutional skew we have discussed above, given the relative strength of arts and humanities and natural sciences at Oxbridge and other RG universities.
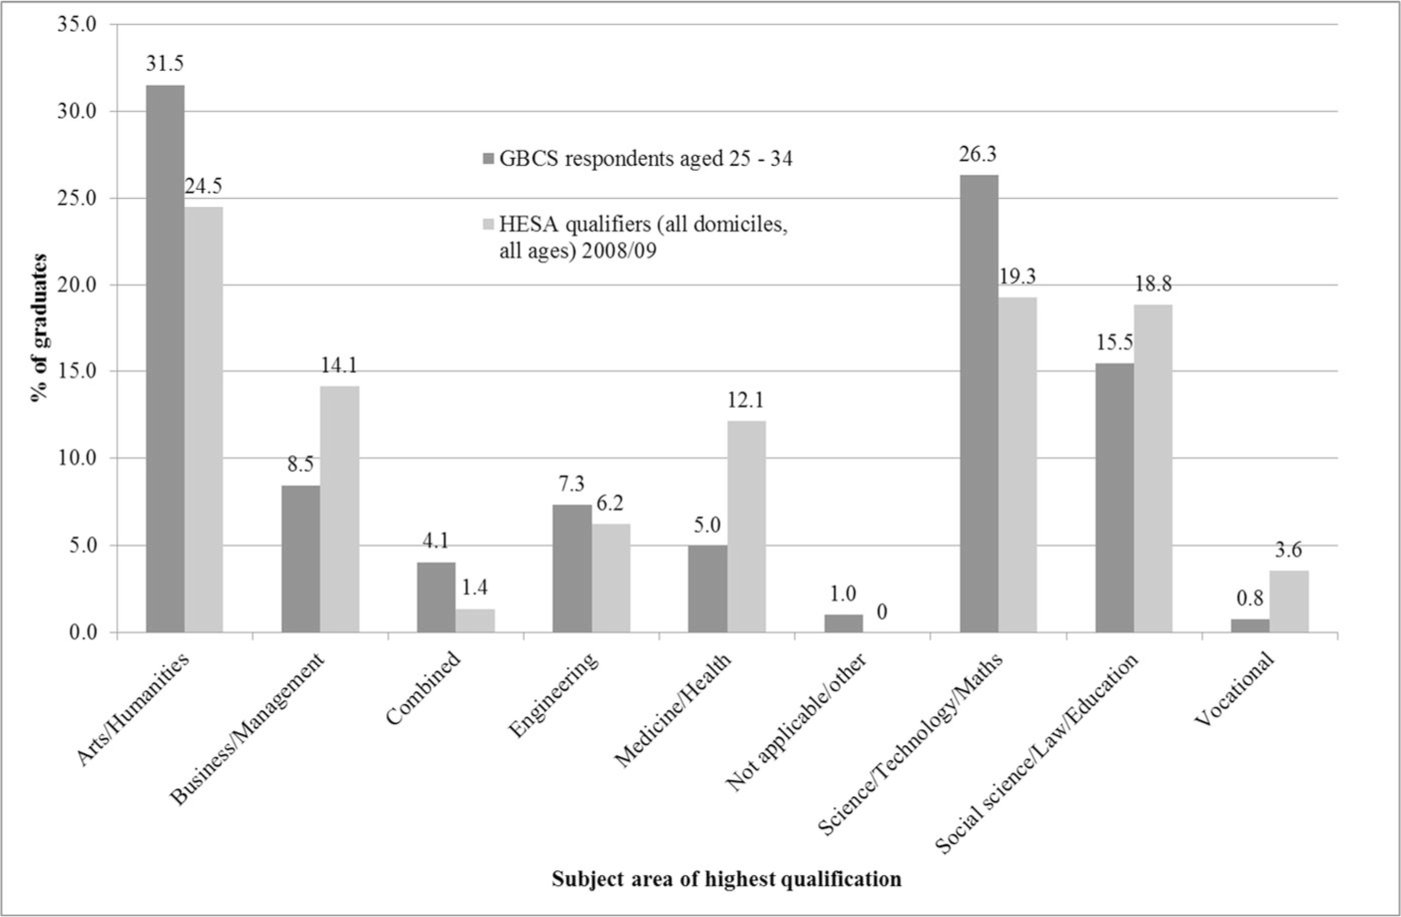
Over- and under-representation of subject areas in GBCS compared to HESA first-degree qualifiers
What general implications do we draw from these patterns for our analysis? There are clearly complex micro-skews to be borne in mind when interpreting the results. We can be relatively reassured that the data is appropriate for comparing differences between RG universities. However, we do think it is necessary to be cautious about using the data to compare graduates from new universities with those from the RG, as it is possible that GBCS respondents from new universities are less representative of their peers (in being more likely to have economic, cultural and social capital). Even within the RG, and especially in drawing comparisons between different universities, we need to be aware of how particular university results may be affected by different response rates.
Patterns of graduate representation amongst NS-SEC1 and the ‘Elite’
Having clarified the extent of institutional micro-skews, we now consider what GBCS data indicates about the relationship between possessing undergraduate and postgraduate qualifications and being in advantaged social positions. In conducting this exercise, we contrast two different measures of defining ‘elite’ classes, first, the ‘Elite’ class 5 defined by Savage et al. (2013) in their latent class analysis of the small, nationally representative GfK dataset, and secondly the more conventional NS-SEC measures which allows us to pull out Class 1. In this analysis we deliberately explore both these approaches, in order to reflect on differences between them.
NS-SEC Class 1 comprises those in senior managerial and professional positions and encompassed about 14.9 per cent of those in employment in the UK in April 2011 (ONS, 2012). The ‘Elite’ class, as used in Savage et al. (2013) is around 6 per cent of the population aged 16+, and is defined by high levels of highbrow cultural capital, strong social capital, as well as very high levels of household income, savings and house price. The two analytical classes, NS-SEC1 and the Elite, derive from fundamentally different conceptions of social class. Whereas NS-SEC uses employment conditions and relations as the basis for deductively demarcating social classes, the GBCS scheme inductively identifies classes based on economic, social and cultural capitals. These differences in measurement are grounded in distinct ontologies of social class, whereby class is employment relations (NS-SEC and its antecedents); or class is economic and cultural, with both material and symbolic aspects (see the general discussion in Savage et al., 2013, 2014).
Although it has been criticized for failing to distinguish the most advantaged groups (eg Savage et al., 2013) one of the practical advantages of working with NS-SEC1 is that we can compare the distributions with nationally representative datasets to gain additional insight into possible skews within the GBCS. 6 Figure 2 provides some benchmarks across different datasets regarding the proportion of NS-SEC1, or the ‘Elite’ class holding different kinds of university qualifications. It suggests that the proportions of GBCS respondents with postgraduate qualifications who are in NS-SEC1 are very similar to the proportions revealed by a nationally representative survey (the Labour Force survey). However, there is an apparent over-representation in the GBCS of those in NS-SEC1 with a first degree. This suggests that the GBCS skew towards the well educated is compounded by an additional skew towards the NS-SEC1 members of such groups – the opposite of the case for the GfK survey. It is worth noting that educational credentials are more likely to lead to membership in NS-SEC1 than with membership of the ‘Elite’ class.
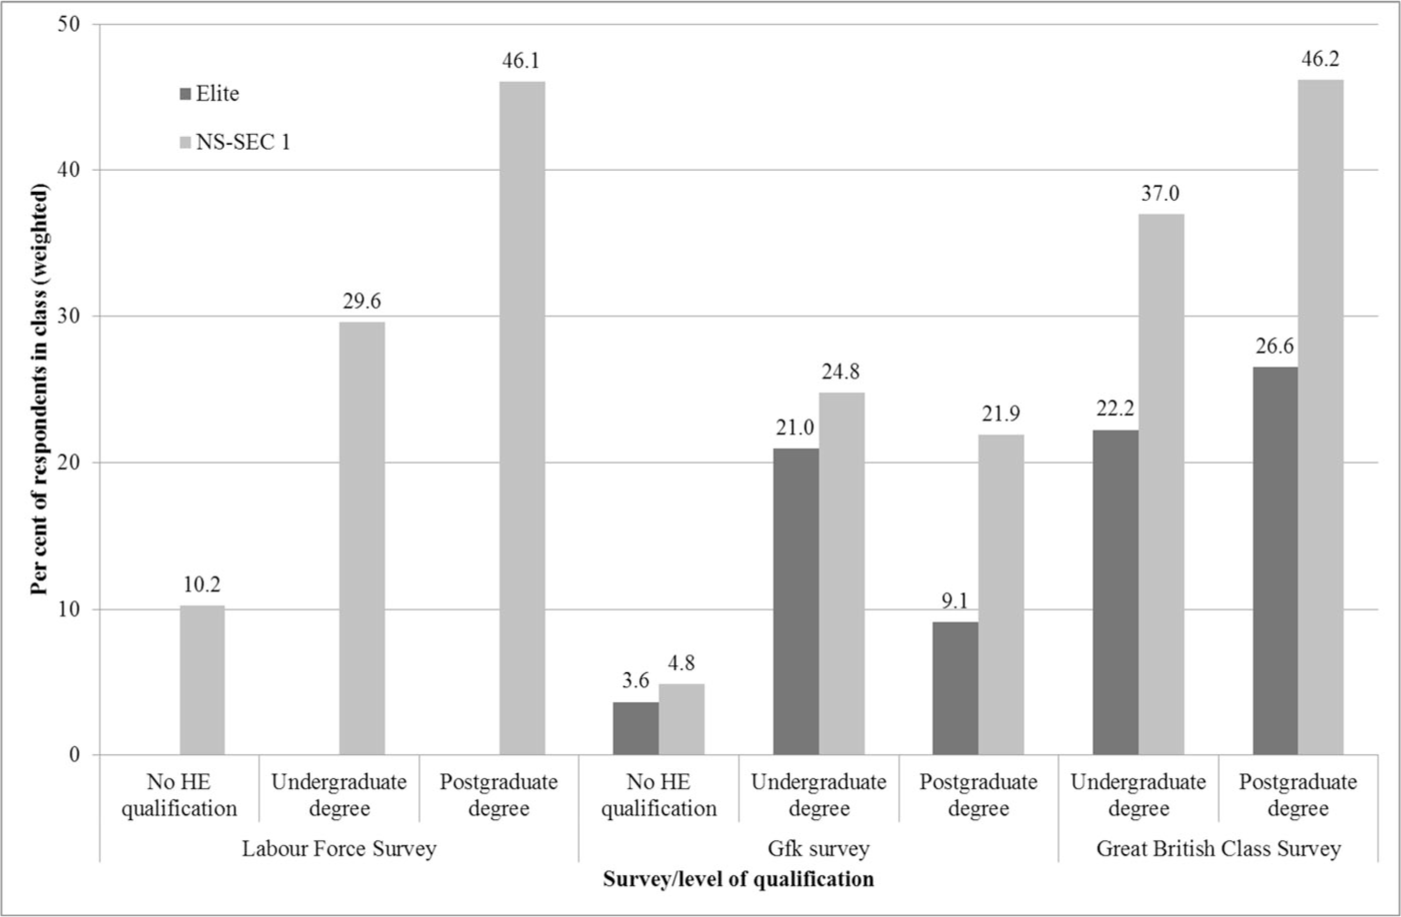
Per cent membership of Elite/NS-SEC1 classes by level of qualification in Quarterly Labour Force Survey April–June 2012, GfK survey and GBCS (respondents aged 25–64)
Figure 3 provides further detail on the association between higher education credentials and membership of NS-SEC1 and the Elite class, broken down by age groups. This allows us to assess whether the skew of the GBCS is relatively constant over different age groups. Figure 3 is reassuring in showing little additional age skewing in this relationship: there is a clear over-representation of NS-SEC1 graduates in the GBCS compared to the Labour Force Survey (LFS) amongst all age groups. It also shows a trend for members of NS-SEC1 to be more likely to be graduates amongst younger age groups, both within GBCS and in the nationally representative LFS.
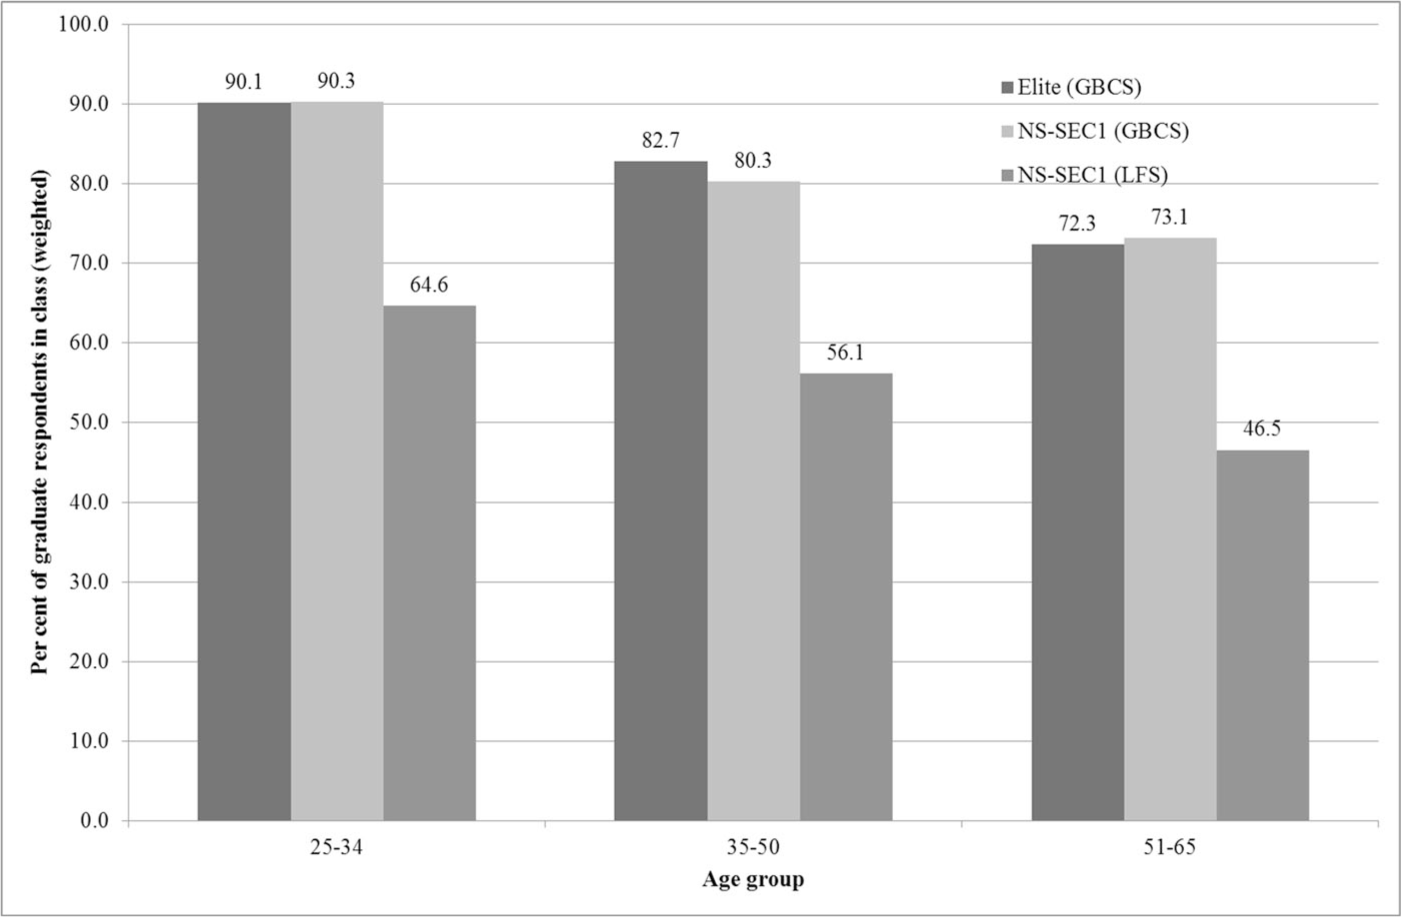
Graduates as per cent of age group among Elite/NS-SEC1 classes in Quarterly Labour Force Survey April–June 2012 and GBCS
Finally, Figure 4 examines the association between attending different school types and being in NS-SEC1 and the Elite among graduates aged 25–65, information not available through government surveys. Here we can benchmark against data about recent graduates and school type (and higher education institution type) via the Destination of Leavers from Higher Education (DLHE) survey. Macmillan et al. (2013) found privately educated graduates were more likely to enter high-status occupations than state-educated graduates from similar backgrounds, with much of this difference down to the university attended. Figure 4 also finds an advantage in attending independent schools, but the main cleavage is between independent/grammar schools and the rest. Here again, the differences in entry to the Elite are starker than for entry to NS-SEC1, possibly because Elite membership is associated not only with income but also with house value and savings linked to age. In any respect, the GBCS Elite appears a more socially selective group than NS-SEC1.
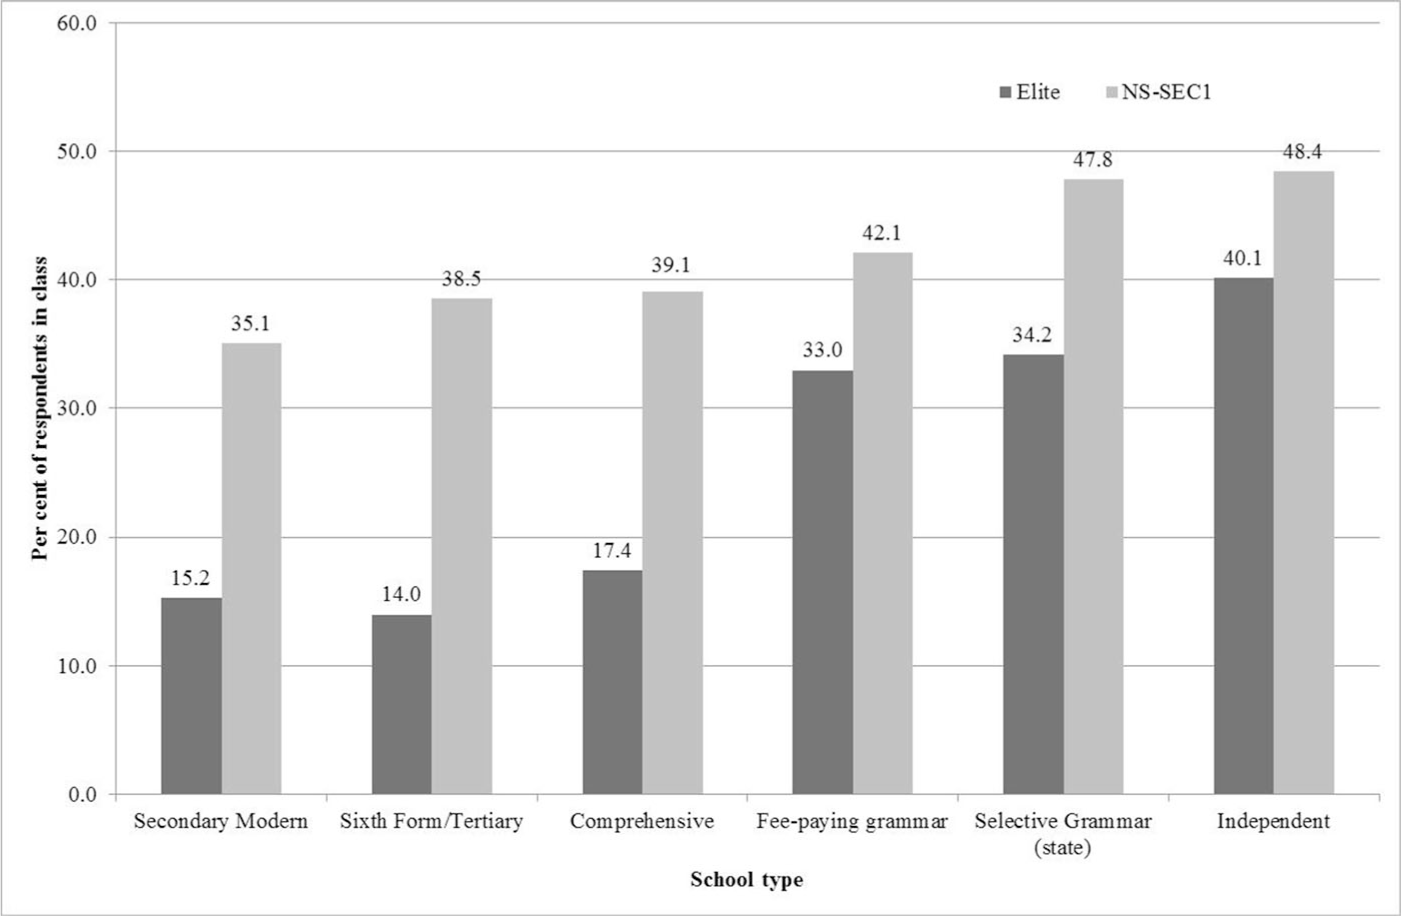
Graduates' per cent membership of Elite/NS-SEC1 classes by category of school last attended, GBCS (respondents aged 25–65 only)
Entry into elite positions
About 6 per cent of the total GfK sample fall into the Elite class, rising to 16 per cent of those with degree-level qualifications. This is clear – though hardly surprising – evidence that higher education is associated with entry to the Elite. However, this association should not be overemphasized: around two-fifths of the (GfK) Elite have not been to university. We can also note that the proportion of graduates is greater if an occupational measure of elite class is used. Thus about 9 per cent of the sample aged 25–64 are large employers, higher managers or higher professionals, but 23 per cent of those with at least an undergraduate degree are in this class. The GBCS measure of the Elite – being less based on occupational criteria which might be expected to prescribe strict entry qualifications – thus suggests somewhat more openness.
Looking in detail at how the structuring of higher education may be associated with entry to elite positions, we now take advantage of the unusual sample size to provide more granular information than is usually possible. Here we switch to the large GBCS survey, where 22 per cent of those with undergraduate degrees and 27 per cent of those with postgraduate degrees are in the Elite, slightly more than in the GfK dataset. As already noted, the GBCS is systematically skewed towards well-educated elites, and we have an under-representation of non-graduate elites. A further twist is that whereas in the national survey postgraduate degree holders are less likely to be in the Elite than first-degree graduates, this is not true in the GBCS. We can infer from this further evidence that the GBCS appeals to the extremely well qualified.
We begin our analysis of whether there are specific university-level differences in outcomes by considering how scores for different capitals (economic and cultural) are associated with attendance at particular RG universities. The patterns are revealing. Table 1 shows a sharp gradient in all the measures of economic capital amongst the top RG universities. This pattern is largely predictable but striking even so, with graduates from the top university, Oxford, reporting a 50 per cent higher household income than the University of York. The gradient for house prices and savings is even steeper. This is prima facie strong evidence about the significance of internal differentiation amongst even the ‘elite’ RG universities.
Reported economic capital for graduates of RG institutions - institutional means, GBCS
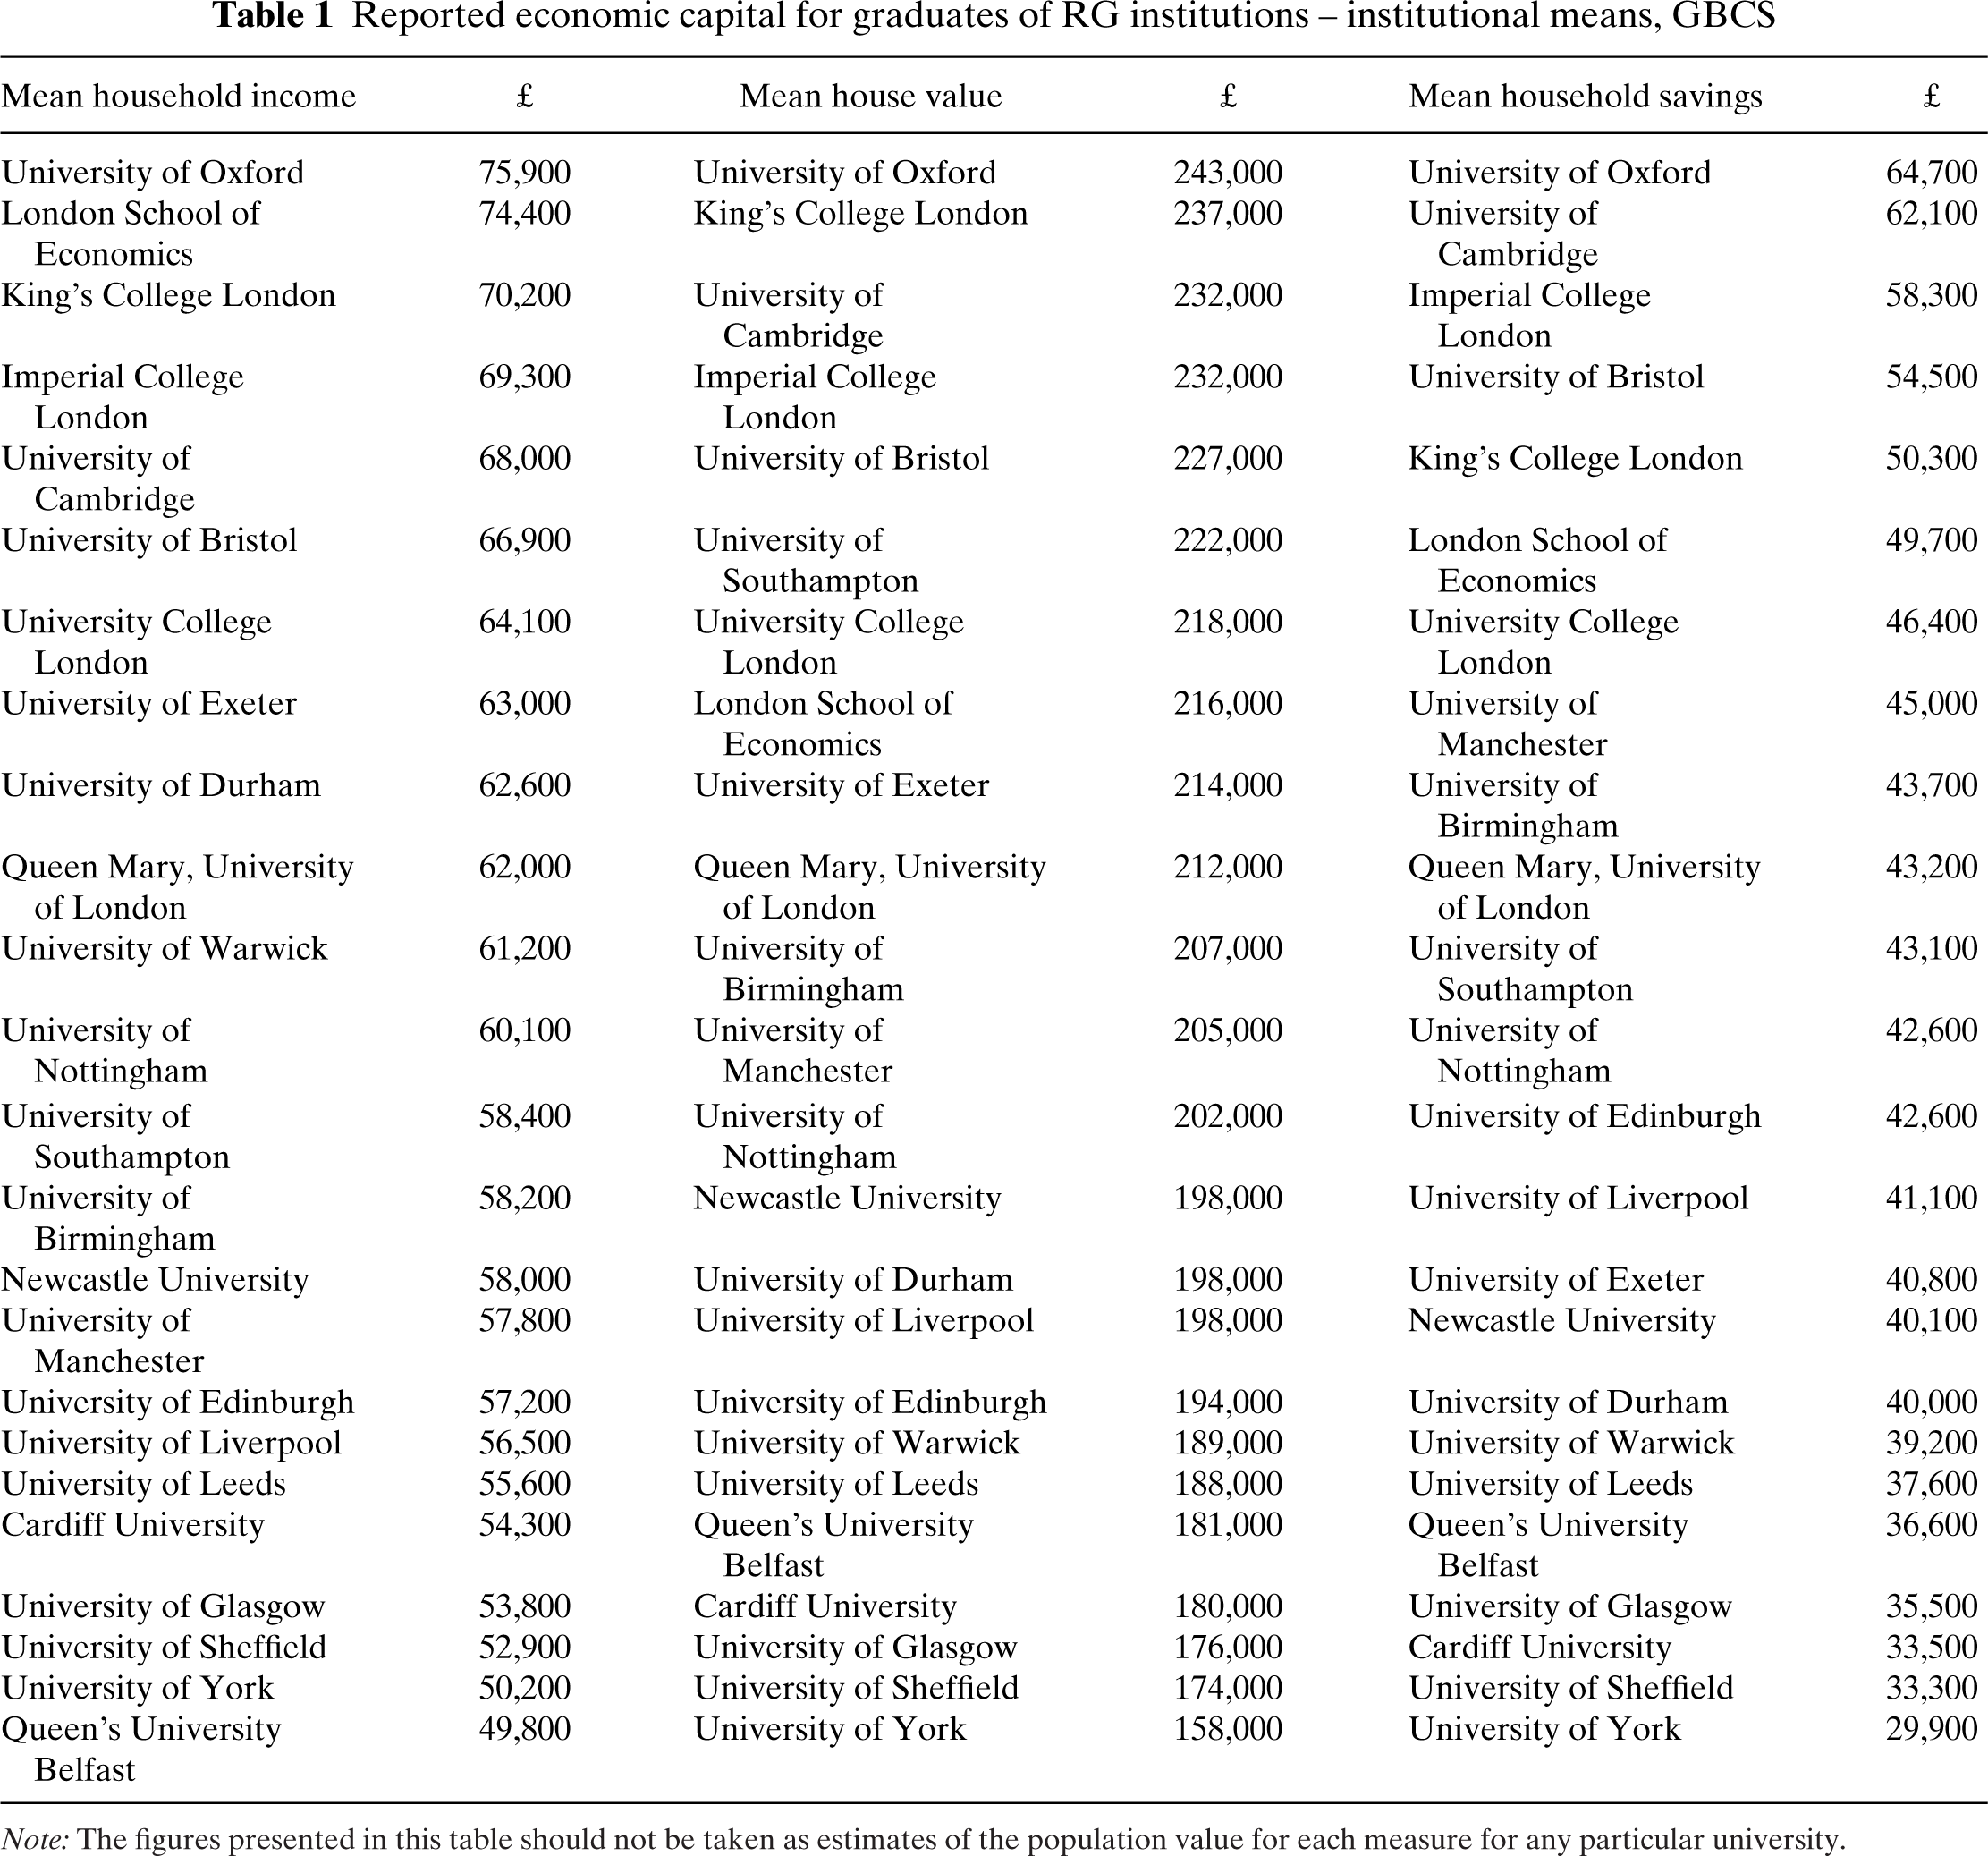
Note: The figures presented in this table should not be taken as estimates of the population value for each measure for any particular university.
Table 1 also shows that graduates from the top eight universities with highest reported household income are all in the south of England, the top ten of those with the highest house values, and the top seven of those with the highest household savings. Oxford is ranked first on all measures, and interestingly Cambridge is eclipsed by several of the London colleges for household income. Here we should note our earlier observation that the sample skew towards Oxbridge is likely to underestimate the differences between Oxbridge and other RG universities. Thus the relative advantage of Oxford graduates may be even larger than revealed in our analysis here.
By contrast, Table 2 shows that cultural capital varies little by institution and it is difficult to find clear institutionally specific differences. This having been said, Oxford, UCL, Kings, LSE and Cambridge stand out insofar as their graduates are more likely to possess ‘highbrow’ cultural capital 7 than other universities. Thus, to some extent a distinctive highbrow institutional cluster seems evident, albeit confined to only a few universities. Once again, Oxford is well ahead of Cambridge (which is also behind King's and UCL) on these measures.
Mean cultural capital scores for graduates of RG institutions, by institution, GBCS
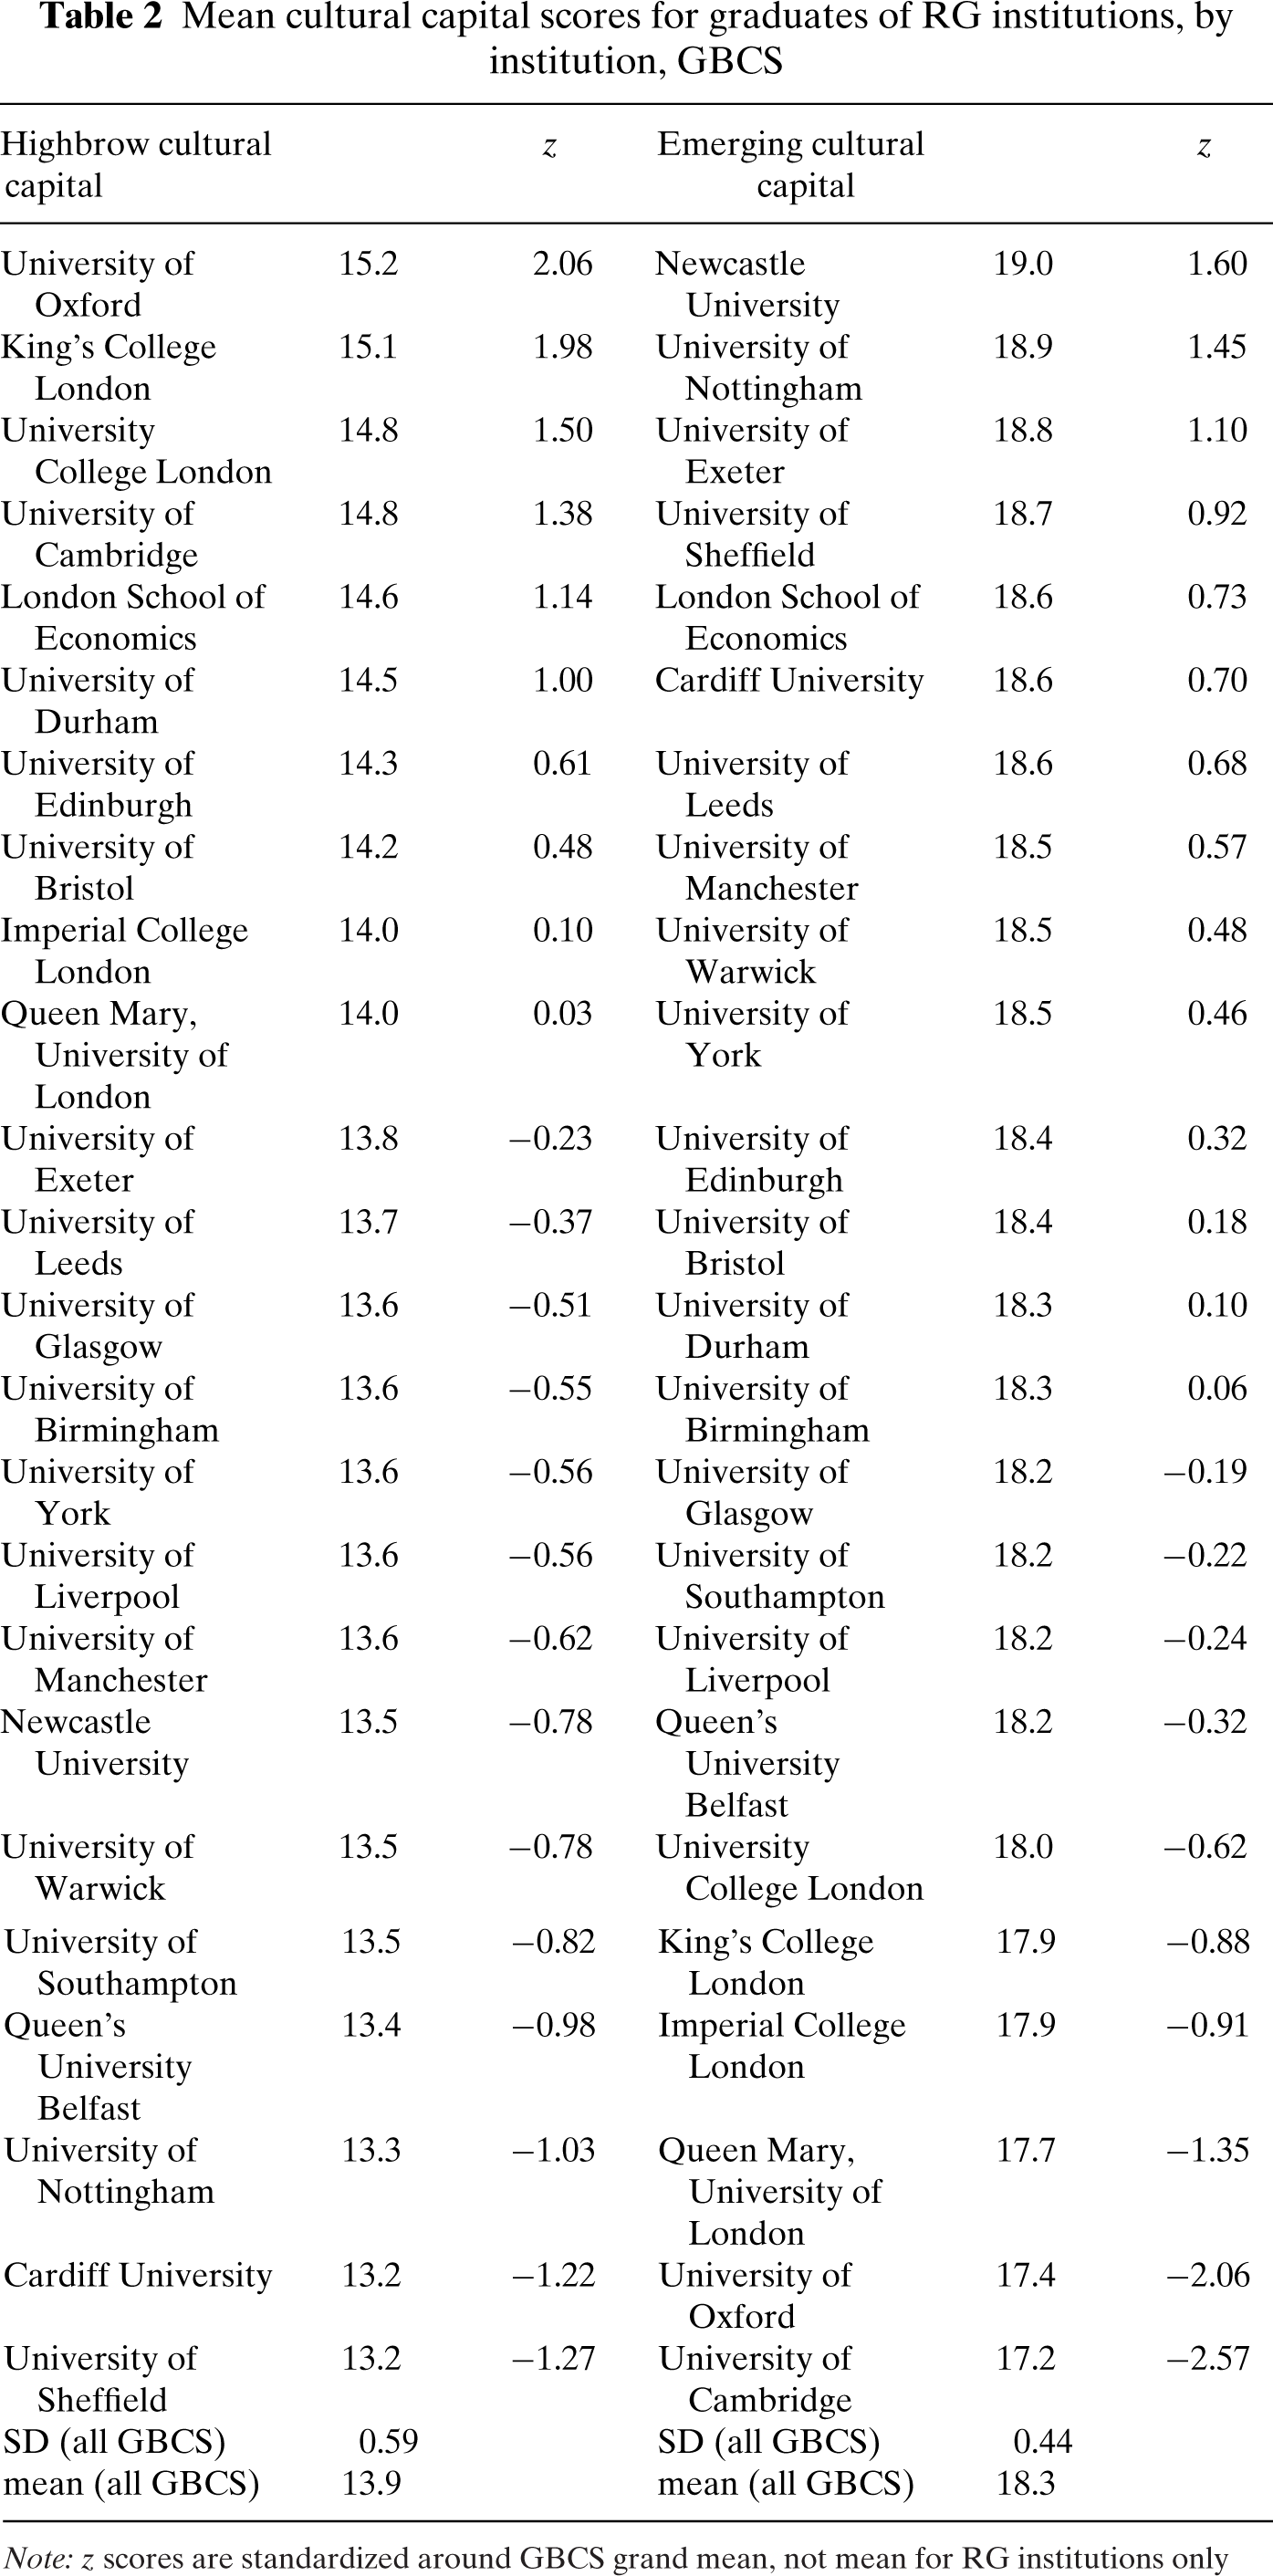
Note: z scores are standardized around GBCS grand mean, not mean for RG institutions only
The story for ‘emerging’ cultural capital is somewhat different, with Oxford, Cambridge and UCL well below the mean. Only the LSE also predisposes its graduates to emerging, as well as highbrow cultural capital. The two universities registering the highest scores are Nottingham and Newcastle, both cities known to have lively music and student cultures. This is intriguing evidence of a differentiation between attendance at different kinds of university in predispositions towards highbrow and emerging cultural capital.
Having recognized the significance of these intra-group differences, let us now consider how Elite recruitment appears linked to university attendance. Figure 5 provides details of the relationship between university type and elite membership. Graduates of RG and non-UK institutions 8 are considerably more likely to be found in the Elite class and in NS-SEC1 than graduates from other institutions. We can also see that non-British universities score highly in this ranking, indicating the possible role of ‘cosmopolitan cultural capital’. Moreover, with the exception of the non-university institutions, the ranking across mission groups is consistent across the Elite and NS-SEC1.
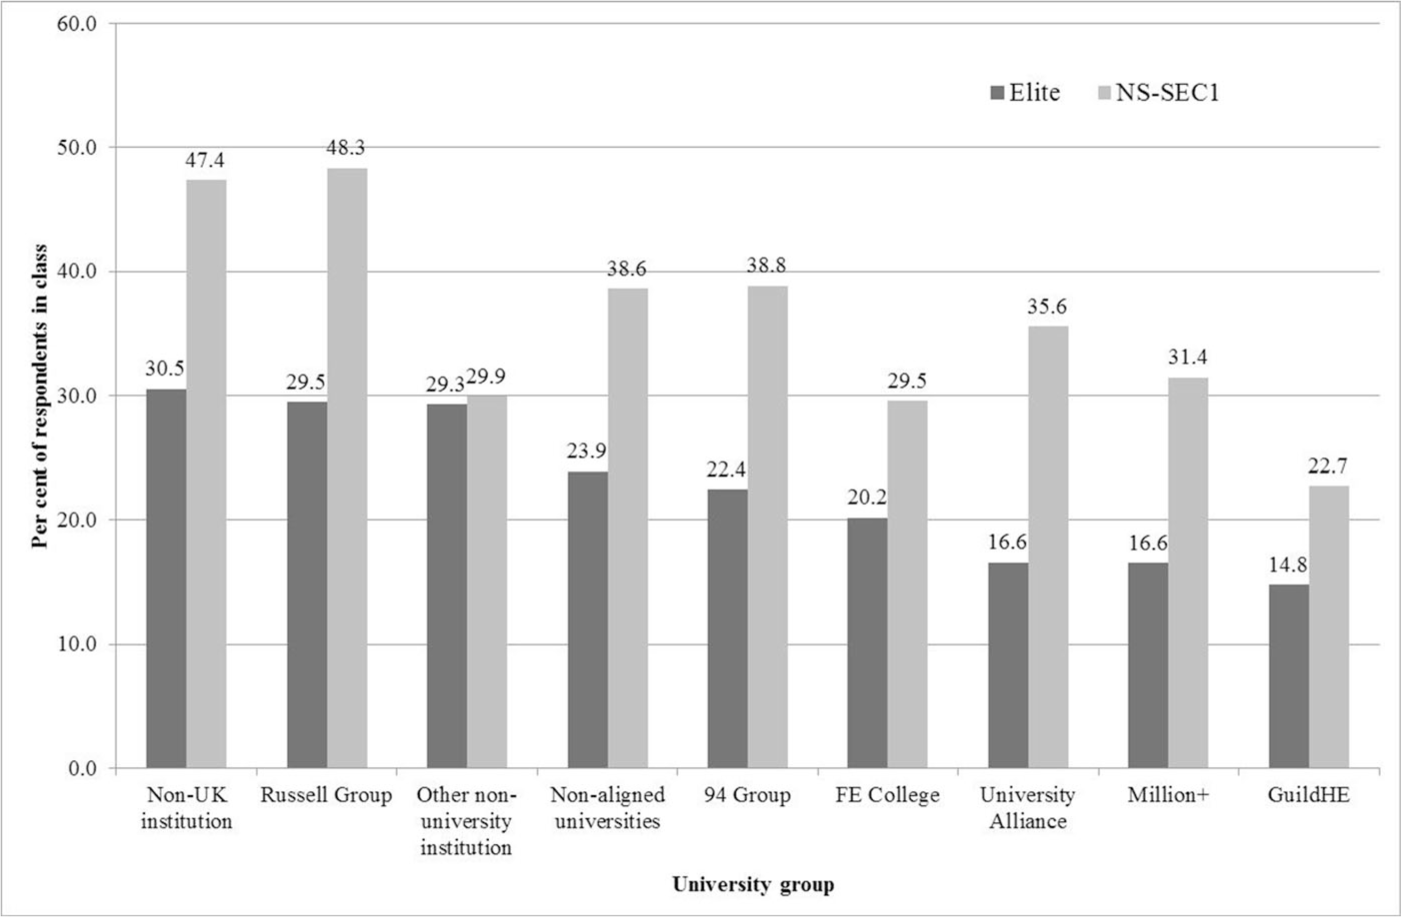
Percentage of graduates in NS-SEC1 and Elite by university ‘mission’ group/type, GBCS (respondents aged 25–65 only)
Figure 6 examines the differences between graduates of RG universities in being in the Elite and NS-SEC1. Here, there is a predictable and very marked ‘pecking order’ with the traditionally most prestigious universities dominating the top positions. Comparing Elite with NS-SEC 1, there is an intriguing pattern: whilst the 24 RG institutions differ little according to the proportion of their graduates in GBCS found in NS-SEC1 (the range is 41–59 per cent), they differ considerably according to membership of the Elite. Here the proportion in the Elite at Oxford is more than twice that of Glasgow, Queen's Belfast, Cardiff, Sheffield and York. There is a strong southern England skew to the distribution, with the Oxbridge and London ‘golden triangle’ featuring heavily among the most Elite.
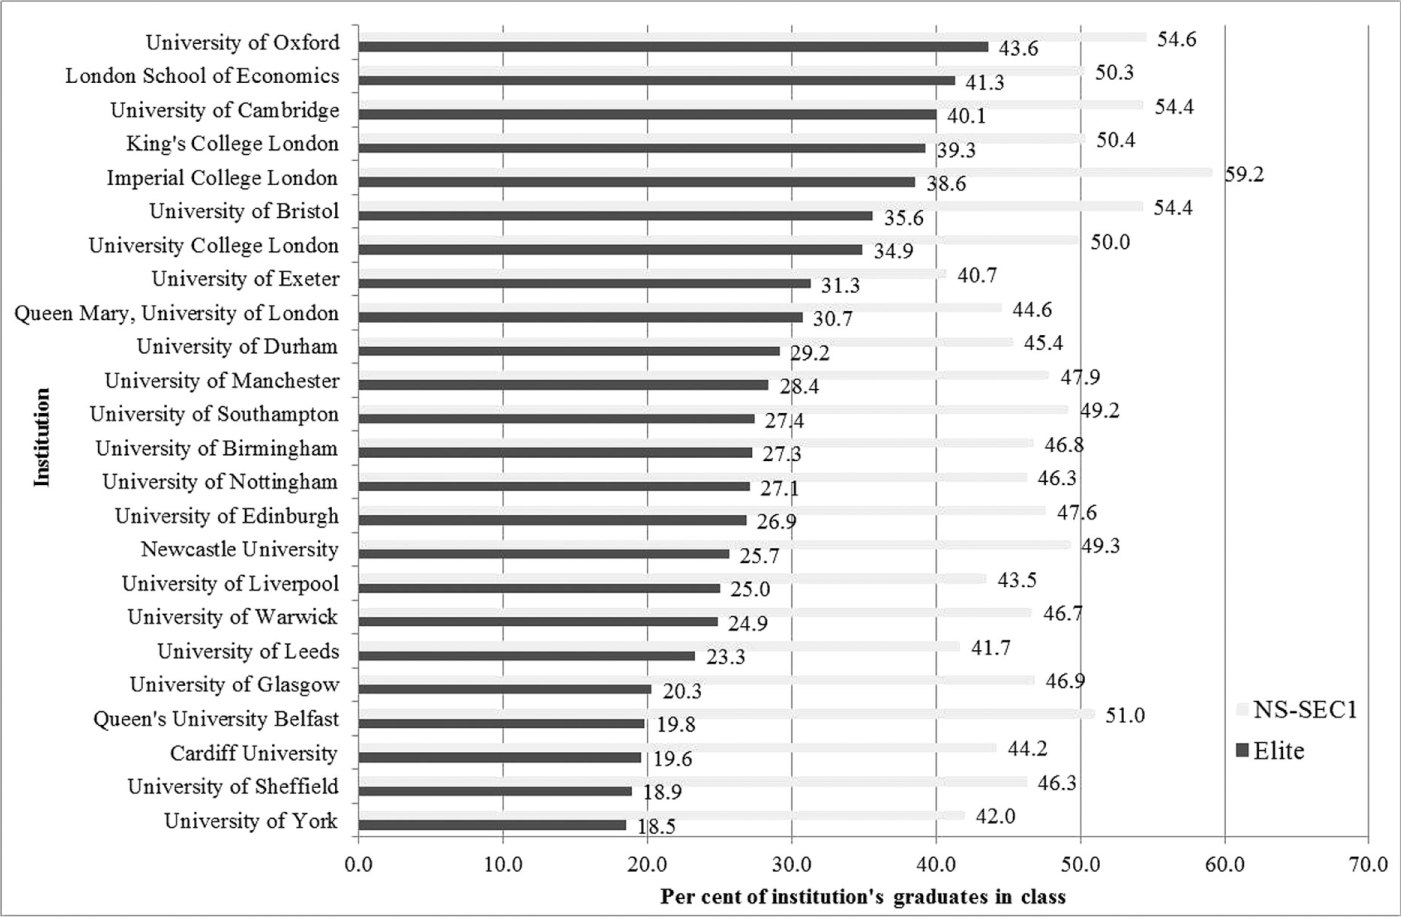
Percentage of RG graduates aged 25–65 in NS-SEC1 and Elite by institution, GBCS
Multivariate models
In this final section, we go beyond bivariate associations between attending specific universities and respondents' capitals, to assess whether the association between particular universities and advantaged outcomes remain when considered alongside other salient factors such as parental class, age, type of school attended, and so forth. Since the GBCS is not a representative survey, our models should be seen as exploratory and descriptive. Fundamentally, our concern is to see whether or not controlling for age, sex, parental class, ethnicity, type of school attended, mission group of university, and subject area removes the university-level differences indicated in Figures 5 and 6.
Accordingly our first set of models seeks to predict household income, which as we have shown, appears to demonstrate strong prima facie inter-university differences. Clearly, this measure is far from perfect, as household income will be influenced by factors other than the respondent's earnings. Model A produces results mainly as anticipated, though with striking twists (Table 3). Age and sex coefficients are predictable, with men, and older groups, reporting higher household incomes. Parental class reveals clear differences which are not straightforwardly split between ‘service’ and working class'. Those coming from senior managerial classes (the reference categories) are best off, with professionals falling behind them. Notably, those from middle and junior manager backgrounds score considerably worse, very close to the clerical and intermediate workers, and indeed routine workers as a whole. Even controlling for education, parental class background matters insofar as it distinguishes senior managers, from professionals, with all other social classes being well behind.
Regression models of household income (linear, Models A and B), membership of NS-SEC1 (logistic, Models C and D) and membership of Elite (logistic, Models E and F) (respondents aged 25-65 only)
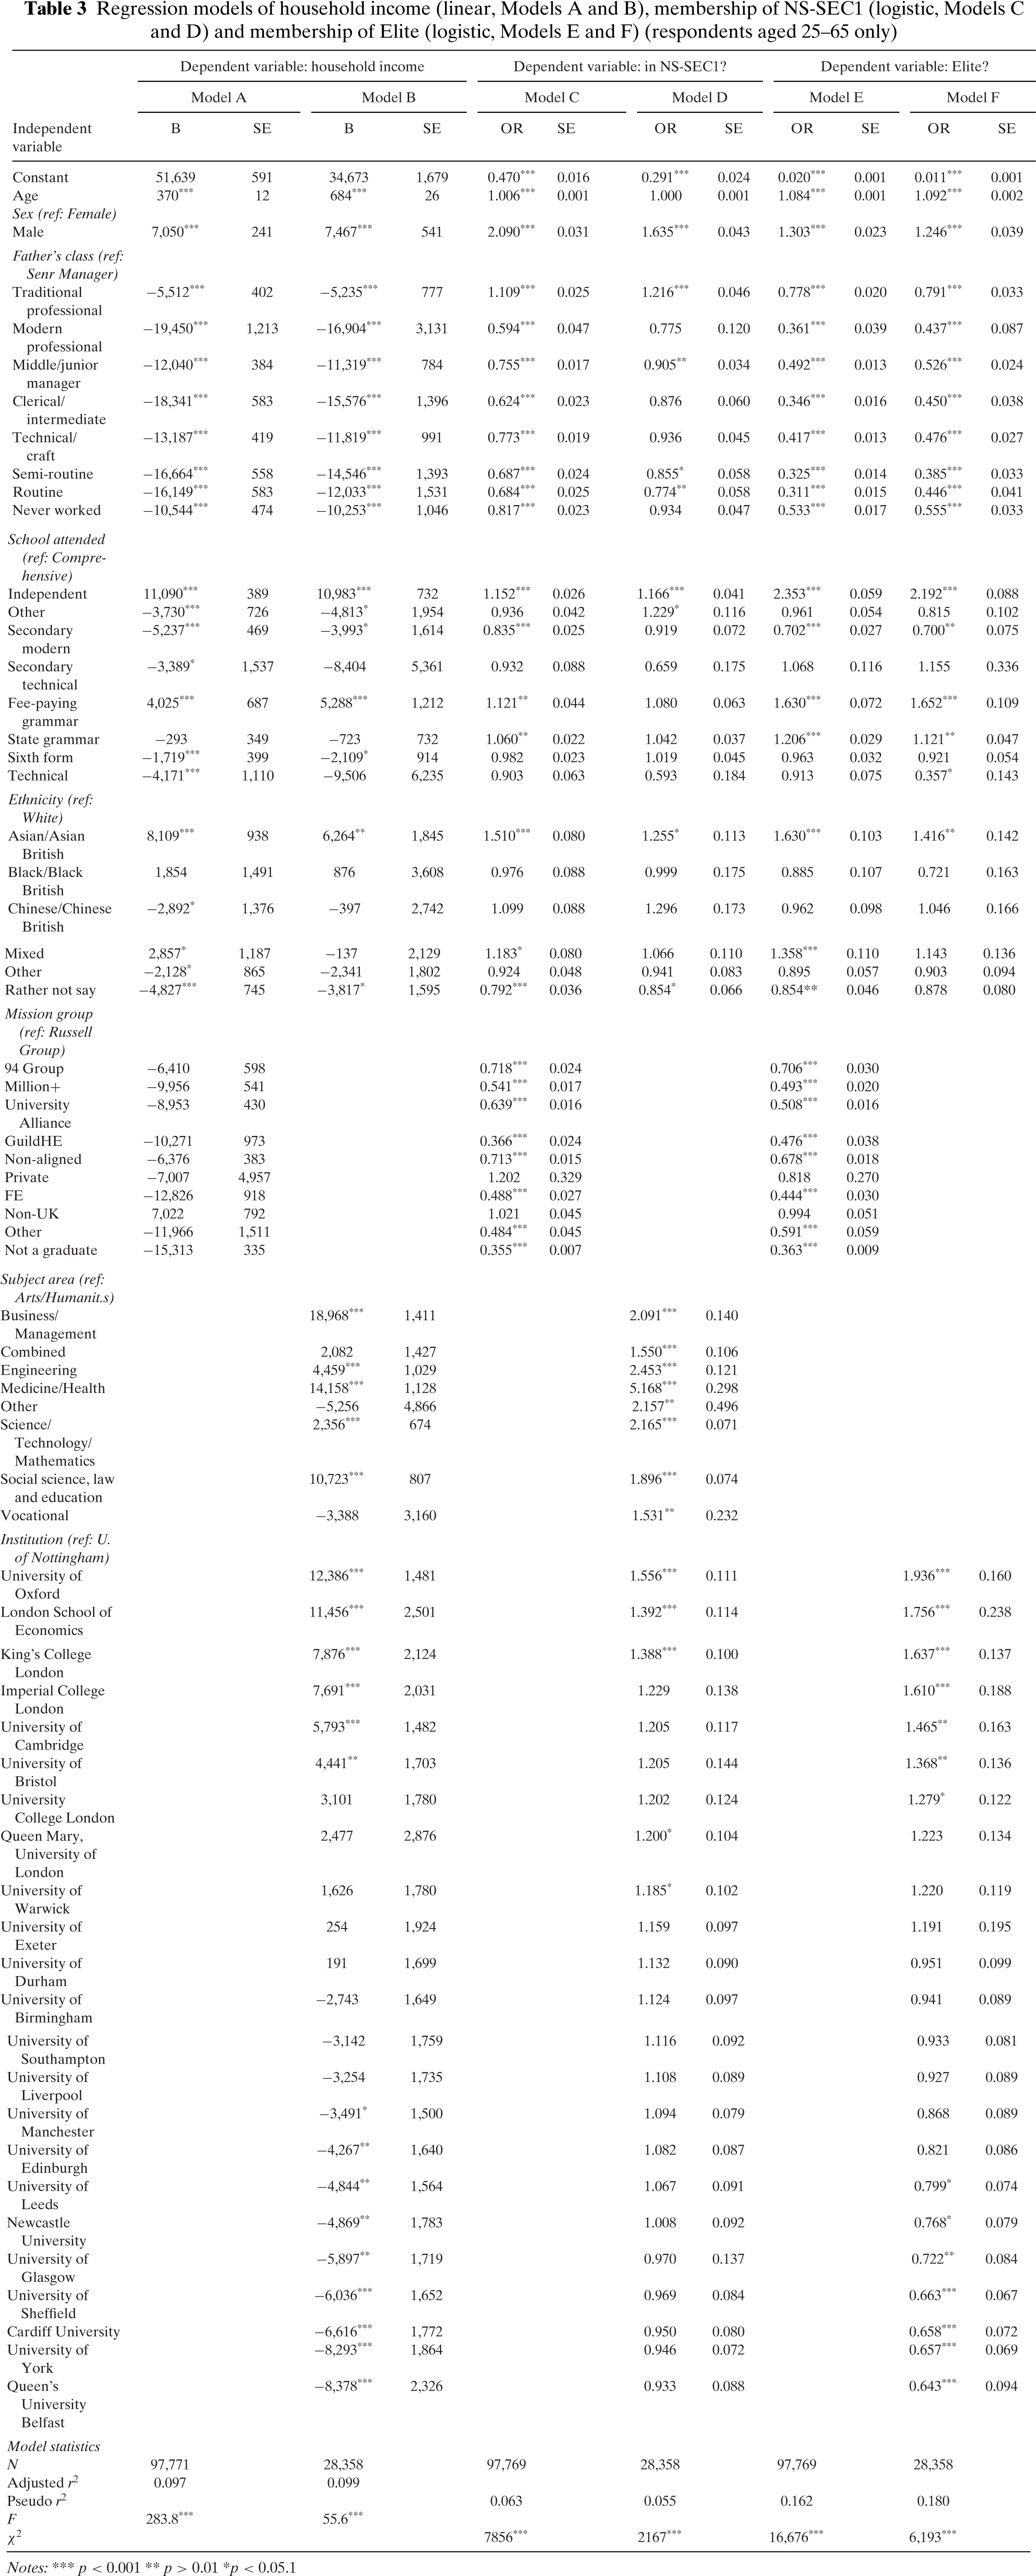
Notes: p < 0.001
p > 0.01
p < 0.05.1
Household income varies by ethnicity, with Asian and Asian British respondents considerably outperforming the White group. Schooling is again prominent, showing the persistent power of private schooling to be conducive to higher household incomes, even controlling for other factors. Finally, university mission group has clear further importance, with the RG being well ahead of any other group, and the Million+ and Alliance groups bringing up the rear. Subject discipline also emerges as important, with business and management, medicine and health, and the social sciences all linked with higher household income.
Model B provides a similar regression but this time amongst RG graduates only, as a means of assessing whether we can detect specific university-level differences. It tests whether the patterns revealed in Figure 6 remain once associated factors are considered. Model B also shows that even amongst RG graduates alone, there continue to be parental class differences, and the relative advantage for Asians and Asian British remains, though somewhat reduced. There are striking subject differences within the RG, with business and management well ahead of arts and humanities graduates, followed by medical and social science students. The advantages of attending independent schools, even within the RG are once again evident. Thus, it is not the case that advantages of independent schooling are equalized for those who attend RG universities. In fact, sustained advantages continue to be seen.
Model B shows three distinct university groups when controlling for other factors. At the top, the relative lead of Oxford over every other university is marked and distinct. Rather than ‘Oxbridge’ factors pre-disposing higher income, our analysis suggests that Oxford is clearly alone at the top. Behind Oxford, closely bunched, come the LSE, Cambridge, Imperial College and King's College. The power of the elite London universities is clear here. Finally, some way behind, we can identify a third group which is associated with distinct advantages beyond the RG norm. These include Bristol, UCL and Warwick. However, the graduates of all the northern universities score well below the reference university (Nottingham). 9 The intersection between geographical location of universities and their association with economic advantage is manifest. We are also able to make more sense of the bivariate analyses reported in Table 1. This shows, for instance, that some of the LSE's advantages are due to exclusively having business and social science students, but that even taking this into account, there is still a distinctive LSE factor (its institutional relative advantages being second only to Oxford).
Let us now consider how far different universities are associated with entry to the two measures of advantaged positions that we have used in our analysis, the GBCS Elite, and NS-SEC1. We performed a logistic regression predicting NS-SEC1 membership, looking at the entire sample aged 25–65 (Models C and D). The results show that senior managers and traditional professional parents have considerable advantages over other classes, but only a slight ethnic premium for Asian respondents. There is a distinctive, but relatively muted advantage in going to private schools, but the difference in the type of university attended is very marked. RG graduates have sustained advantages over graduates from the 94 group, the Million+ group, the University Alliance, GuildHE and non-aligned institutions. Within the RG, university-level differences are evident, but muted. Here Cambridge is closer to Oxford in having higher prospects of entry to NS-SEC1, and most other RG universities are similar to each other. There are, however, substantial differences across subject specialisms, with medical graduates, and those in science, engineering, and social science (in that order) having significantly greater chances of entering NS-SEC1 than graduates in arts and humanities.
Finally, Models E and F shows an equivalent logistic regression for Elite membership. Looking at the full sample (Model E) shows much greater rates of Elite membership for those coming from senior managerial backgrounds, attending private schooling, and going to RG universities. Access to the Elite is evidently more selective than entry to NS-SEC1. Differentiating within RG graduates alone (Model F), highlights striking patterns of differentiation, with greater evidence for institutional compared to subject differences, as against entry to NS-SEC1. Attendance at Oxford, LSE and Cambridge, respectively, is strongly associated with access to the Elite, even taking into account other factors in the model. Attendance at independent schools is also strongly associated with entry to the Elite among RG graduates. By contrast, subject differences are smaller, though business and management, medical and (to a lesser extent) social science graduates have an apparent advantage.
Discussion and conclusions
This paper has used the unusually large sample size of the Great British Class Survey to investigate distinctive university level differences in advantage at the higher levels of British society. In the absence of other datasets large enough to have sizeable samples of graduates from specific universities with comprehensive questions on social, cultural and economic measures, this is a potentially important contribution.
We need to emphasize – again – the caveats in using the GBCS as a non-representative sample. Inferences drawn from our analysis are tentative and suggestive. We have argued that it is difficult to compare RG universities with new universities, but even within the RG there are differences in response rates, and it is important to consider whether these might affect the findings. Nonetheless, we are confident that a number of significant conclusions can be drawn, both about the role of institutional stratification, and in terms of developing a sociological perspective on contemporary elite formation.
Our first conclusion is to recognize that there are striking differences in whether one operationalizes elite positions using an employment-based measure of social class, or through using the multi-dimensional approach of Savage et al. (2013). Analysis of entry into NS-SEC1 is associated with parental class, attendance at RG universities, and university subject choice, but less so with independent schooling or attending specific RG universities (though attendance at Oxford, Cambridge and Bristol has some significance). There is here some evidence of ‘meritocratic’ entry into this class of senior managers and professionals.
By contrast, entry into the Elite class is more socially selective, on several dimensions. Parental class is more strongly associated with entry than for NS-SEC1, attending independent school has a substantial role, and RG universities obtain much better outcomes than others, especially the Million+ group. Furthermore, once we focus only on RG graduates, we also see striking institutional differences, with six universities (Oxford, LSE, Cambridge, King's College London, Imperial and UCL, respectively) particularly strongly associated with Elite entry, even controlling for other key factors.
In short, the Elite is more socially selective and exclusive than NS-SEC1. This process appears to work in general terms (through the significance of parental class and schooling, for instance) and also through specific factors, notably the role of specific elite universities. Such greater exclusiveness is likely to be due to the way that the GBCS Elite measure is more attuned to differences in economic capital than is NS-SEC1, that it includes measures for cultural and social capital which are also likely to be associated with elite formation, and also that the Elite is smaller than NS-SEC1. This is a subtle – even if not surprising – indication that more refined measures of social advantage show up more specific and defined kinds of exclusion than do broad brush ones. This is strong evidence that a sociological analysis of elite formation cannot simply draw on NS-SEC occupational measures of class.
If we turn to consider what our analysis shows with respect to the role of specific universities in generating advantage, there are two main points we wish to emphasize. First, that even controlling for important variables (such as subject choice, school type, etc.), there are clear university-level differences at the top end. Secondly, our findings suggest there are important institutional differences within the RG, which turns out not to be a very sociologically unified grouping. A much smaller group of elite universities are shown to have clear advantages within the broader RG. The often-evoked ‘golden triangle’ of universities appears to be a palpable entity in terms of its graduates' entry to elite positions, but even with this select grouping there is differentiation. Perhaps most strikingly, Oxford outperforms Cambridge, sometimes considerably, on every measure which we have used in this paper. The existence of these inter-institutional differences in graduate outcomes fits the ‘effectively maintained inequality’ thesis (Lucas, 2001). However, the revealed institutional hierarchy is far more fine-grained than other analyses have countenanced. Our data do not allow us systematically to track >change across cohorts, so we cannot be certain that these differences are caused by higher education expansion, although it remains a strong possibility. Beyond this, we can also see that the London-based elite universities outperform elite institutions outside of south-east England (Bristol being a partial exception). These findings suggest a subtle interplay between geographical, occupational and educational processes, in which elite institutions in south-east England are part of a wider ‘London vortex’ which conveys advantage to those caught up within it.
Footnotes
Acknowledgements
We would like to thank Sam Friedman, Helene Snee and three anonymous referees for helpful comments on earlier versions of this article; and Katharina Hecht, Daniel Laurison and Mark Taylor for help in coding and managing the GBCS dataset.
1
Among the major British surveys, only Wave 12 of the British Household Panel Survey and the 1970 Birth Cohort Study contain the type of institution attended.
2
Wave II doubled the sample size, but was unavailable for analysis at the time of writing.
3
Almost 103,000 hold an undergraduate degree or higher. However due to a technical error details of institution attended are missing for all second batch records (approximately 11,000 cases). Wave 1 second batch records are omitted from our analyses. Details are missing through item non-response for around a further 7,000 cases in the first batch.
4
We also examined over-representation of 21–24 year olds, indicating some striking ‘local’ effects, notably the over-representation of York graduates (where Mike Savage worked when the survey was made live), where the mean age of GBCS respondents is considerably lower than for other universities. The University of York's promotion of GBCS on its website probably helped generate additional responses amongst its own students. A similar though less marked effect applies at Manchester (where Fiona Devine worked and where CRESC was based).
5
6
The Wave 1 second batch data has erroneous values for the respondent's job title. This results from the same technical error as identified in note 2 above. These cases are omitted from any analysis involving either institution attended or NS-SEC.
7
‘Highbrow’ cultural capital is based on respondents' engagement with cultural forms such as classical music, art galleries, museums and haute cuisine; ‘emerging’ cultural capital relates to engagement with, inter alia, video games, social networking, sport and popular music.
8
We lack data to determine whether graduates of non-UK institutions are returning foreign-educated Britons or rather immigrants born and educated abroad. We suspect the latter, indicating a highly selected group both educationally and in terms of their pre-existing economic, social and cultural capital.
9
Nottingham was selected as the reference category since it appears close to the midpoint on the household income variable.
Appendix
Calculation of over-representation of graduates from different universities -GBCS compared to HESA data