
Abstract
Which neighborhood conditions foster the growth of ethnic organizations? This paper explores how changing unemployment, homeownership, and immigration in neighborhoods shape the growth of ethnic organizations in San Francisco from 1940 to 1970. Using hierarchical linear modeling, this paper analyzes the growth of white ethnic and racial minority organizations as postwar neighborhood changes took form. Results indicate that white ethnic and racial minority organizations experience very different growth trajectories. Findings indicate that the growth of racial minority organizations was negatively affected as foreign–born population size grew and unemployment rose. White ethnic organizations, however, were impervious to these same neighborhood changes. These results suggest that social heterogeneity and economic uncertainty stall the growth of racial minority organizations, whereas white ethnic organizations are unaffected by these conditions.
On a typical walk around most urban neighborhoods, an individual might come across a church, retail shop, or some other organization signaling the history of local values, resources, and cultures. Whether these organizations are in the process of revival, reconstitution, or abandonment, social scientists tend to explain their presence with arguments about resident consumption and demand. Indeed, research suggests that when present and vibrant, organizations are the heart of community social life because they serve as gathering places for residents (Oldenburg 1989). When organizations are in decline, urban scholars surmise that residents have fled neighborhoods and left only organizational relics behind (Wilson 1996). And, when organizations are in transition, other research suggests that residents are actively transforming residual organizations or establishing new organizations to fulfill unmet needs (Waldinger 1989).
It is convention to view the presence of organizations in neighborhoods as a consequence of resident action, especially when focusing on ethnic organizations. Research on urban neighborhoods, for example, suggests that ethnic organizations are more likely to occur where racial and ethnic populations are geographically concentrated (Alba et al. 1997). This claim is grounded in classic Chicago School arguments about the ecological process of competition that sorts racial and ethnic groups in cities. This model proposes that the distribution of ethnic organizations in neighborhoods follows assimilation processes such that ethnic organizations rise and decline as racial and ethnic populations adapt to new environments (Janowitz 1952; Park 1915). In plain terms, ethnic organizations are thought to reflect the ethnicity of current or former residents in a neighborhood.
Economic sociologists share this assumption when explaining the rise of ethnic enterprises. The crux of the enclave economy thesis is that geographically bounded social networks shape the opportunity structures of racial and ethnic groups and facilitate the formation of ethnic economies (Aldrich and Waldinger 1990; Wilson and Portes 1980). Social scientists have since debated what constitutes an ethnic economy, gives rise to it, and its location (Aldrich et al. 1985; Logan et al. 1994; Sanders and Nee 1996; Waldinger 1993), but most of this literature focuses on the opportunities and constraints that racial and ethnic group residents encounter as they build an economy that allows them to become economically mobile.
This paper shifts the analytic focus to the favorable and unfavorable conditions faced by organizations. The advantage of this approach is that it complements what we know about how neighborhoods interface with organizations. For example, urban sociologists have long recognized that ethnic identity and practices link ethnic organizations to specific neighborhoods. Also, recent studies of poor neighborhoods using cross–sectional data show that neighborhood racial and ethnic composition impacts the presence and number of institutions such as retail establishments, childcare facilities, and employment agencies (Murphy and Wallace 2010; Small and McDermott 2006; Small and Stark 2005). Neighborhood deprivation is also linked to the propensity of organizational presence for some organizational types but not others (Murphy and Wallace 2010).
Previous research establishes a link between ethnicity, organizations, and location. However, less understood is how these associations are reproduced in formal organizations over time. This paper therefore examines the growth of ethnic organizations in San Francisco neighborhoods from 1940 to1970 as a means of understanding “the sustained and continual expression and validation of ethnicity” (Barth 1969:15). In order to do this in a way that contributes to the growing number of studies examining organizational processes in the context of neighborhoods (Cimino 2011; Marwell 2007; McQuarrie and Marwell 2009; Olvera (in press); Sanchez–Jankowski 2008; Small 2009), this paper adopts a macro–organizational perspective.
Specifically, this paper applies a well–established principle proposed by organizational ecologists to ethnic organizations in neighborhoods, namely, those organizations that fit well in a niche will multiply and those that are not good matches will fade or disappear (Hannan and Freeman 1977). An organizational niche is the set of environmental conditions in which organizations struggle to survive (Hannan et al. 2003). I draw on organizational ecology precisely because it purports that the environment influences the density and diversity of organizations over time. I pay special attention to the role of economic decline, immigration, and homeownership since previous research suggests that these conditions should foster or curb ethnic organizational growth. As such, this paper is distinct from recent studies that employ the organizational ecology framework to explore the interplay between gentrification and congregations (Cimino 2011) and restaurant organizational forms in communities (Carroll and Torfason 2011). Whereas this article is focused on organizational growth, those studies explore organizational niches and thus, seek to explain how organizations in geographically dispersed markets attempt to capture the center of a market (Carroll 1985).
Perspectives on Ethnic Organizations in Neighborhoods
The theoretical link between ethnicity, organizations, and urban neighborhoods is founded in studies of ethnicity in urban communities. For more than 80 years, the human ecology model has dominated our understanding of how ethnic organizations locate in particular neighborhoods. Rooted in the study of white ethnic assimilation in 20th–century American cities, early ecologists argued that neighborhoods contextualize ethnic cultural adjustment through the process of competition between households and businesses over territory (Park et al. 1925). This process resulted in the making of immigrant enclaves located in the most impoverished sectors of cities. These natural “colonies” or “mosaics of small worlds” were viewed as temporary place–holders made more livable by the presence of ethnic organizations (Wirth 1938). Ethnic organizations were thus established “for the purpose of giving expression to local sentiment” (Park 1915:580). For example, ethnic fraternal organizations were established to support ethnic language, culture, and tradition and thereby foster the symbolic side of ethnicity. Organizations such as ethnic newspapers, on the other hand, operated as centers of information and used ethnicity in instrumental ways (Janowitz 1952; Park 1922). Immigrant neighborhoods with a diverse set of organizations were characterized as stable, self–sufficient, and institutionally complete places where residents created and nurtured community life as they gained footing in the new country (Breton 1964).
In essence, this perspective stressed the symbiotic dependency between ethnic interests, relationships, and sentiments and argued that they were inextricably tied to location. This interdependency made ethnic organizational formation more likely in ethnically concentrated neighborhoods. Research on ethnic enterprises supports this assumption. Light (1972) finds that Chinese and Japanese businesses locate in predominantly Chinese and Japanese neighborhoods, respectively. Fong et al. (2008) also find that Chinese restaurants concentrate in Chinese neighborhoods. Wilson and Portes (1980) show that Cuban businesses cluster where there are high concentrations of Cuban residents.
However, ecologists anticipated that competition for territory would inevitably change neighborhoods as new ethnic groups replaced outgoing groups. This dynamic of “ethnic succession” described a residential process where new arrivals “invaded” and replaced groups that were “moving up and moving on” to new neighborhoods (Duncan and Lieberson 1959). Ethnic succession was expected to have consequences for ethnic organizations. In neighborhoods where groups no longer demanded ethnic goods and services and developed a growing adoption of dominant culture, ethnicity was a less likely motivation for association or co–location (Massey 1985). Consequently, urban sociologists expected that ethnic organizations would have difficulty surviving neighborhood ethnic succession. Studies offer evidence of ethnic organizational decline in white ethnic enclaves. For example, research shows that white ethnic businesses in predominantly white neighborhoods decline in number with the arrival of new racial groups (Aldrich and Reiss 1976; Schmidt and Lee 1978).
The human ecological model has been influential in linking ethnic organizations to place as well as the group processes (e.g., assimilation) that could potentially threaten ethnic organizations. For organizational ecologists, the human ecological approach was limiting. In his review of organizational ecology research, Carroll (1984) outlines the ways in which organizational ecologists improved upon the human ecology model. First, he points out that rather than view organizational changes occuring in stages and in symbiosis with neighborhoods, the organizational ecological model argues that organizations have their own dynamics and processes. Specifically, organizational ecologists contend that organizations grow and decline through selective replacement of existing organizations rather than in developmental stages. They further posit that the mechanism that specifies whether an organizational form is a good fit for an environment is competition for resources, not symbiosis between organization and communities. They also argue that organizations emerge and grow when environments are in disequilibrium rather than in equilibrium. And finally, organizational ecologists argue that organizations are best understood when examined as organizational forms over the long term. Organizational forms refer to organizational types that form under comparable environmental conditions, are structured similarly, and rely on similar resources to survive (Hannan and Freeman 1989).
The Neighborhood Environment of Ethnic Organizations
The core of organizational ecology theory is to understand the long–term processes that facilitate the emergence and disappearance of organizational forms. A key aspect of this perspective is that most organizations, once founded, will follow a general pattern of growth and decline due to two forces—legitimation and competition (Hannan and Freeman 1989). In fact, organizational ecologists argue that pattern is best explained by the theory of density dependence. According to this theory, organizational density is achieved over time as organizations compete for resources such as members, money, volunteers, and space (Hannan and Freeman 1977). However, beyond a certain limit, if organizational density is too low, then an organizational form lacks legitimacy or a “taken–for–granted” quality. When organizational density is low but not too low, organizations legitimate each other and increase the standing of an organizational form. In turn, when organizational density gets too high, organizations will compete with each other for survival.
Density dependence theory has implications for understanding ethnic organizations in neighborhoods. First, it suggests that neighborhoods with some ethnic organizations have an advantage over those with many ethnic organizations. Second, it implies that when a neighborhood reaches carrying capacity, new ethnic organizations will be crowded out by competition. The strength of this argument is that it offers a theoretical explanation of how the intensity of ethnic organizational life is produced in neighborhoods that can support them. A second advantage of this perspective is that it provides a frame for understanding diversity in ethnic organizations or distinct types of ethnic organizations. For purposes of this paper, diversity within ethnic organizations is manifested as white ethnic and racial minority organizations.
Because organizational ecology argues that external factors have an important role in how organizational forms are distributed over time and across space, there is a research agenda centered on identifying how the environment interacts with the founding, growth, and death rates of different organizational types. To be sure, the environment is composed of similarly structured organizations that rely on similar resources (i.e., internal environment or organizational field) as well as external social and political conditions (i.e., external environment).
Typically, organizational ecology researchers examine organizational dynamics in industries such as banking, auto, labor unions, breweries, and newspapers, to name a few. These studies have successfully demonstrated that environmental conditions—institutional politics, political turmoil, national industry regulations, and consumer tastes—affect the birth, growth, and death rates of a number of organizational forms over time (Britton and Ocasio 2007; Carroll and Hannan 1989; Carroll and Swaminathan 1991; Greve 2002; Hannan and Freeman 1988; Lomi 1995; Lomi 2000). However, this framework is also used in studies of ethnic newspapers to explore the effects of immigration, ethnic conflict, and economic decline (Olzak and West 1991; West 1995). Similarly, it has been applied in a study of Chinese businesses in Toronto to show that there is a matching process between the locational demands of Chinese businesses and business environments in Chinese neighborhoods (Fong et al. 2008). 1
I focus on three environmental conditions that promote and suppress ethnic organizational growth. Studies of ethnic newspapers at the national level during the late 19th century indicate that increasing immigration rates were consequential for the growth of white ethnic newspapers (Olzak and West 1991; West 1995). West (1995) in particular argued that immigration changed an important organizational resource—as the number of immigrants climbed, potential readers grew and diversified. In her study of ethnic presses, she found that indeed as the size of the foreign–born population increased, the number of immigrant presses did too.
Olzak and West (1991) show, second, that declining economic conditions produced a negative climate for organizations, yet interestingly led to a rise in the growth of African–American newspapers. They reasoned that ethnic presses share features of social movement organizations that emerge when economic conditions worsen. That is, economic declines present an opportunity for racial minorities to coalesce, mobilize, and organize formally. Guided by the findings of these national studies of ethnic newspapers, I expect that an increase in the size of the foreign–born population in neighborhoods will similarly change the mix of organizational resources and contribute to growth in white ethnic organizational density. I also anticipate that as neighborhood economic conditions worsen, the density of racial minority organizations will increase.
While the size of the foreign–born population and economic conditions may change available organizational resources, historical accounts of postwar urban changes related to housing should also have meaningful effects on ethnic organizations. As Sugrue (1996) notes, middle– and working–class white homeowners mobilized against the entry of Blacks in their neighborhoods. They often defended neighborhoods by forming organizations along ethnic lines. In San Francisco, Brooks (2009) finds similar evidence of organized white mobilization to contain Chinese residential patterns. These historical findings are consistent with social (dis)organization theory which argues that residential stability, often indicated by homeownership, produces greater social interaction within neighborhoods and participation in organizations that protect community interests (Sampson and Groves 1989; Shaw and McKay 1942). If indeed homeownership serves as the basis for ethnic organizations to thrive, I hypothesize that rising homeownership rates will lead to increasing densities of white ethnic organizations.
Data and Analysis
To study ethnic organizational density in neighborhoods over time, this paper uses data for the city of San Francisco from 1940 to 1970. This 30–year period is intended to cover the evolutionary process of ethnic organizations. In other words, these data measure the pattern of growth and decline that ethnic organizations experience across time. In constructing these data, my goal was to capture the fluctuating neighborhood conditions that constrain and promote the ability of ethnic organizations to proliferate and grow in number over time rather than in a specific historical period.
To create an organizational database that would reflect changes in the number of organizations, I used census data and the City Directories of San Francisco (published by R.L. Polk & Co.). These directories provide the name, address, and telephone numbers of local businesses, city and county offices, public and private schools, banks, churches, incorporated institutions, and private citizens. As a source of historical organizational data, these directories are useful because they have been published from 1870 to 1982.
Because the directory is not digitally available, I constructed an ethnic organizational profile for each census tract, a convenient proxy for neighborhoods in San Francisco. In essence, I created a database containing the name and address of ethnic churches, presses, and voluntary associations. I define these organizational types as “ethnic” in the sense of being symbolic and instrumental in the production of ethnicity. Indeed, studies find that ethnic presses translate daily events, report news from the homeland, and connect coethnic residents to each other (Janowitz 1952). Voluntary associations facilitate the celebration of cultural traditions and creation of interpersonal relationships (Zhou 2005). Churches facilitate the exchange of information about local community events (Drake 1940). Though these organizations are distinct in structure and purpose, at the neighborhood level they represent the legitimate organizational forms that sustain ethnicity or promote group integration. Moreover, in neighborhoods they often share resources such as members, volunteers, and location. Examples in the data of these organizational types include the First Chinese Baptist Church, AME Baptist Church, and Iglesia Bautista Mexicana, voluntary associations such as the Italian Family Club and Chinese Benevolent Association, and ethnic presses such as the Manila Chronicle, Serbian Herald, and Imparcial.
While city directories are widely used as sources of organizational data(Polk, R L & Co. 1940–1970), they nevertheless have limitations. Information regarding organizational size, membership, and type of activity is not available. Moreover, these directories are unlikely to list secret societies established by communities that facilitate participation in the informal economy, protection from discrimination, and promotion of charitable activities (Light 1977; Lyman 1974). City directories are also not ideal for identifying formal organizations that are very small or new. For example, an established Protestant church is more likely to appear in a directory than a storefront church. Directories are likely to undercount organizations in immigrant communities, an issue that official government agencies also find challenging. Last, these directories were no longer published after 1982. Despite these limitations, roughly 1,600 organizations were identified overall.
With regard to the coding procedures, ethnic organizations are coded on the basis of an organization's name. That is, organizations with a title signifying an association affiliated with a racial or ethnic group were included in this count. For example, the Italian Family Club, Ying Fat Yuen Club, or Manila Chronicle fit the criteria and thus were assigned a value of “1.” Some churches were difficult to categorize based solely on their organizational title (e.g., The Third Baptist Church of San Francisco). To ensure that a complete set of ethnic churches was included in the database, I referred to the U.S. Department of Commerce's Census of Religious Bodies (1936). It says The Third Baptist Church of San Francisco, for example, is a black church, which was therefore coded as a racial minority church.
Geocoding procedures were used to link all organizations to their respective census tract. A drawback of using census tracts is that boundaries often change as cities grow. New boundary lines were fortunately not a problem given San Francisco's geography. The city lies between the Pacific Ocean and San Francisco Bay leaving little room for geographic expansion. Consequently, the U.S. Census made few boundary changes between 1940 and 1970 (US Census 1940–1970).
In a few cases, census tracts were split due to population increases. To render all census tracts comparable to their 1940 form across the four wave panels, tracts were rejoined using the ArcGIS tract joiner tool. After rejoining census tracts, the total number of tracts in each panel year was 118. Of those, seven were identified as outliers or tracts with very small populations (e.g., less than 100 residents), those containing large parks (Golden Gate Park) and military bases (The Presidio), and one census tract that contained more than 100 organizations in each census year. These outliers were excluded from the analysis of 111 remaining organizations.
Variables
There are three dependent variables: (1) number of ethnic organizations per 100 residents; (2) number of white ethnic organizations per 100 residents; and (3) number of racial minority organizations per 100 residents. These variables are aggregates of ethnic churches, ethnic newspapers, and ethnic voluntary associations in each census tract to approximate the level of “institutional completeness” over time (Breton 1964). To be clear, white ethnic organizations and racial minority organizations are distinguished by using the same coding procedure described above (i.e., an organization associated by title with a white ethnic group is coded as a white ethnic organization, while an organization with a racial minority group in its title is coded as a racial minority organization).
Though this distinction cannot reveal how the ethnic organization of a particular racial or ethnic group is linked to neighborhood change processes, these variables provide insights into how white and nonwhite neighborhoods shape the densities of white and nonwhite organizations. Moreover, it is a difficult to match an Italian, Chinese, or Mexican organization to an Italian, Chinese, or Mexican neighborhood. Early census tract data report “white,” “negro,” and “other” as racial categories, making it a challenge to identify a particular ethnic group in a neighborhood. In the case of San Francisco, “other” is likely to represent groups such as the Chinese, Japanese, and Mexicans.
Time–Varying Independent Variables
In order to explore the effects of changing neighborhood conditions on ethnic organizational density in each period within each neighborhood, this study distinguishes between time–variant and time–invariant independent variable. To do this, data are separated into two files. The first data file includes three time–varying independent variables: time, number of racial minorities in a tract per 100 residents, and number of whites in a tract per 100 residents. The time variable is given values of −2, −1, 0, and 1 to indicate each decennial year (i.e., 1940, 1950, 1960, and 1970, respectively). This coding procedure permits us to use time as a covariate in the three dependent variables in order to detect the average growth pattern in the density of ethnic organizations across census tracts, the average growth pattern in the density of white ethnic organizations across census tracts, and the average growth pattern in the density of racial minority organizations across census tracts. I use 1960 as the reference year (i.e., time is equal to 0) since 1960 marks the period when San Francisco began its decline in population and shift away from manufacturing to service–based industries (Godfrey 1988).
Time–Invariant Independent Variables
The second data file contains five variables measuring various neighborhood attributes. Neighborhood attribute variables reflect the changes that occurred in each neighborhood condition over the entire time period. For example, the first variable is percent foreign–born in tract. This variable represents the change in percent foreign–born between 1940 and 1970 to account for the shift in the percentage of foreign–born residents in neighborhoods. This measure is included to control for the possibility that neighborhoods with growing percentages of foreign–born residents will experience increases in ethnic organizational density over time.
Also in the model is a variable measuring neighborhood unemployment. This variable is intended to measure the economic climate in the neighborhood. As noted earlier, past studies have found that declining economic conditions create opportunities for the growth of ethnic organizations.
Though past research on ethnic organizations gives less attention to housing indicators, this paper controls for changes in the percent of homeowners in a neighborhood. I do so to evaluate the impact that increased homeownership promotes competition between white and racial minority groups and thus growth in white ethnic organizations.
Last, I include two control variables. The first control is change in the number of all voluntary associations (e.g., total number of benevolent associations, neighborhood organizations, and voluntary associations per 100 residents). Voluntary associations are a separate category in the SF City directory and thus serve as an indicator of nonethnic organizations in a tract. The second control is neighborhood affluence. Neighborhood affluence is a factor created by combining percent employed, percent residents with college education, and percent professionals and managers.
Method of Estimation
This study uses multilevel modeling techniques to account for the nested relationship of these data (i.e., time nested in census tracts; Raudenbush and Bryk 2002). Since the dependent variable is a count variable, some tracts will contain no ethnic organizations in one or more years and other tracts will reveal repeated occurrences. For this reason, this paper uses hierarchical general linear models. The models are specified such that the count of ethnic organizations in a particular year and census tract is conditioned on population size in that year (i.e., population size is the exposure variable). Including population as an exposure variable adjusts for the fact that neighborhoods with larger populations may have more opportunities to accumulate ethnic organizations. There are a number of advantages offered by this modeling technique: (1) observe whether a trend exists in terms of ethnic organizational density over time; (2) evaluate the different neighborhood change effects on the observed trend; and (3) determine if ethnic organizational density and neighborhood change increase in a linear fashion (Garson 2013).
Since these models often violate the normality assumption (i.e., mean of the dependent variable is equal to its variance), all analyses control for overdispersion in the level–1 variance. This multilevel model thus has the following form at level 1:


where Yti is the expected number of ethnic organizations at time t in neighborhood i, mti is the exposure variable, and λti is the event rate in a tract. In other words, the event rate is the expected value of an ethnic organization occurring in tract i at time t, ηti (the log event rate in a tract) is a function of time plus a nuisance parameter (eti), β0i is the log event rate in 1960, while β1i is the growth rate in tract i.
At level 2, I model the variation between neighborhoods in their log occurrence rates as a function of changing neighborhood conditions. A note about level–2 equations—all predictors are grand–mean centered and β0i and β1i are allowed to vary across census tracts.


To clarify, since neighborhoods are nested within time, the level–1 model estimates the expected value (or event rate) of ethnic organization occurring in a neighborhood in each decade as well as the growth rate of ethnic organizations. The level–2 model produces estimates to explain variation in organizational growth rates over the entire period of observation.
Separate models are estimated for the count of white ethnic organizations and racial minority organizations. When estimating the count of white ethnic organizations, I use the number of whites in a tract per 100 residents as the exposure variable. In the model where the count of racial minority organizations is the dependent variable, the number of nonwhites in a tract per 100 residents is the exposure variable.
Describing Postwar San Francisco
World War II was a catalyst of growth that spurred wartime industries and created a convergence of newcomers to cities. San Francisco was no exception—demographic and economic shifts following the war reorganized the entire city (Daniels 1980; Broussard 1994; Miller 2009). Neighborhoods changed as new arrivals concentrated in some areas and long–time residents dispersed to others. Between 1941 and 1945, San Francisco emerged as the country's foremost center for American merchant and war shipbuilding and repair (Boyden 1991). Largely a consequence of public and private partnerships, the rise of the shipbuilding industry stimulated the local economy. As critical as shipbuilding was to San Francisco's growing economy, census data reveal that most major industrial sectors were growing between 1940 and 1950. Specifically, employment in heavy industry grew by 64 percent, retail and wholesale sector increased by 93 percent, transportation expanded by 8.7 percent, and, of the major sectors, the service industry experienced the largest increase (110 percent) in employment. After the war, San Francisco's industrial base shifted away from manufacturing and toward service. Between 1950 and 1960, employment in service industries grew by 10 percent. In 1960, the service sector was the largest sector in the city, with transportation industries beginning their ascendance as well (up 41 percent between 1960 and 1970). As these industries grew, manufacturing declined to prewar figures.
Like in most American cities, industry shifts occurred alongside massive demographic shifts. In 1940, 95 percent of the city's population was white. By 1950, the percentage of whites fell to 89 percent and two decades later, whites represented 60 percent of the population. Each decade the white population declined, the black population steadily increased. According to census data, the most dramatic increase occurred between 1940 and 1950. In 1940, blacks comprised less than 1 percent of the city population. Ten years later, the African–American population climbed to 43,502 (or 5.6 percent). This number of black residents in the city continued to rise each decade thereafter. By 1960, African Americans were 10 percent of the total city population and 13.4 percent in 1970.
As the black population steadily increased, other population changes were simultaneously occurring. For example, groups with much longer histories in the West, but particularly the Chinese, grew consistently each decade. Largely due to the forging of a U.S.–China alliance, the repeal of the Chinese Exclusion Act in 1943, and the extension of the War Brides Act of 1945, the number of Chinese residents in San Francisco increased from 17,782 to 24,813 between 1940 and 1950. In 1960 and 1970, however, the size of the Chinese population did not grow to the same extent as the African–American population (see Table 1). The same is true for Filipinos and Japanese. The size of each group grew slowly each decade, but never reached very high numbers. 2
Population Characteristics of Postwar San Francisco
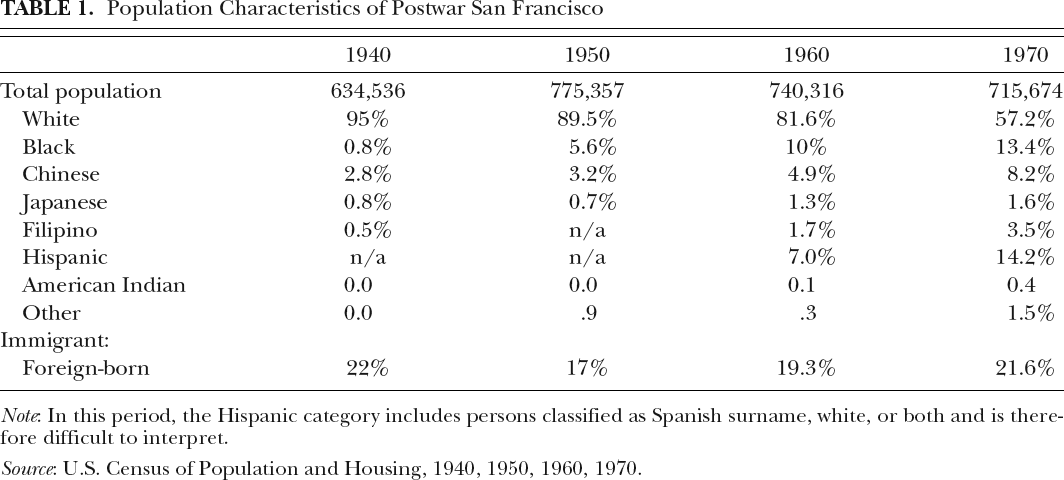
Source: U.S. Census of Population and Housing, 1940, 1950, 1960, 1970.
Note: In this period, the Hispanic category includes persons classified as Spanish surname, white, or both and is therefore difficult to interpret.
These shifts were evident in its neighborhoods. According to Taeuber and Taeuber (1965), whites and nonwhites dispersed throughout the city. Segregation indices in San Francisco between whites and nonwhites were, respectively, 73.8 in 1940, 66.2 in 1950, and 57.6 in 1960. However, dissimilarity indices show that whites and blacks remained highly segregated from each other (71.3 in 1940, 70.8 in 1950, and 70.2 in 1960). Interestingly, Taeuber and Taeuber (1965) find that segregation between blacks and other races remained steady (61.4 in 1940, 65.2 in 1950, and 65.4 in 1960). And they indicated that declines in segregation occurred between whites and other races (76.2 in 1940, 67.8 in 1960, and 65.4 in 1960).
These postwar conditions represent the heyday of prosperity and maximum racial gaps in opportunity (Godfrey 1988). For organizations, these demographic and segregation trends signal environmental conditions that sustain diversity in organizational forms (Hannan and Freeman 1989). In the case of ethnic organizations, white ethnic and racial minority organization should experience growth and decline as they compete for resources that changing economic and demographic conditions make available. As expected, Figure 1 shows that the postwar period in San Francisco was also an era of fluctuation across ethnic organizations. In 1940, there were a total of 183 ethnic organizations. Thereafter, the number of ethnic organizations declined to 144 in 1950, increased to 232 in 1960, and decreased again to 164 in 1970.
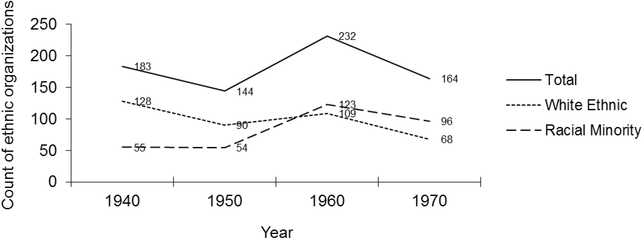
Number of ethnic organizations, San Francisco (1940–1970).
Figure 1 also indicates variability in the number of white ethnic and racial minority organizations. Between 1940 and 1950, the number of white ethnic organizations declined from 128 to 90, while the number of racial minority organizations remained relatively unchanged. By 1960, white ethnic and racial minority organizations experienced growth, though much of this increase occurred among racial minority organizations (i.e., racial minority organizations grew by 128 percent and white ethnic organizations by 21 percent. Thereafter, the number of white ethnic organizations decline by 41 organizations and racial minority organizations decline by 27 organizations.
Figure 2 also demonstrates that the most stable organizational type over time was the ethnic press, though there were far more white ethnic newspapers than racial minority newspapers. Specifically, figure 2 shows that of all ethnic presses in 1940, 19 were white ethnic presses and five were racial minority presses. These numbers remained relatively unchanged until 1970, when the number of white ethnic presses decline to 9. In addition, voluntary associations were the dominant organizational form among white ethnics. In fact, no other organizational form experienced the instability encountered by white ethnic associations. 3 White ethnic associations declined and then began their ascent once more in 1960 (increasing from 41 to 60), as did racial minority churches (climbing from 37 to 87). By 1970, Figure 2 shows that the number of white ethnic churches, racial minority churches, white ethnic associations, and racial minority associations all declined. 4
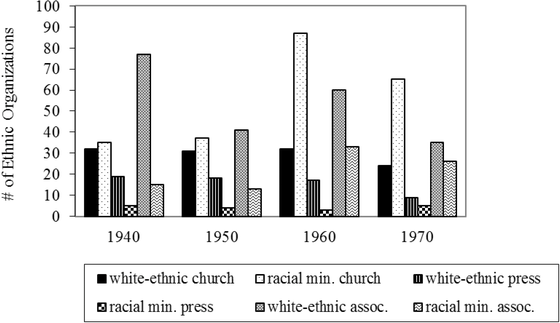
Number of ethnic organizations by type.
While the changes in the number of ethnic organizations described above provide a portrait of the larger pattern of ethnic organizational density, the goal of this paper is to understand the extent to which the organizational environment at the neighborhood level conditions these patterns. Table 2 presents descriptive statistics on ethnic organizational density and neighborhood changes. Panel 1 in Table 2 indicates that neighborhoods contained on average at least one white ethnic organization and one racial minority organization for every 100 residents. However, there were neighborhoods that had as many as 10 racial minority organizations and 14 white ethnic organizations and others that had none of either.
Summary of Level–1 and Level–2 Variables Used in Analyses
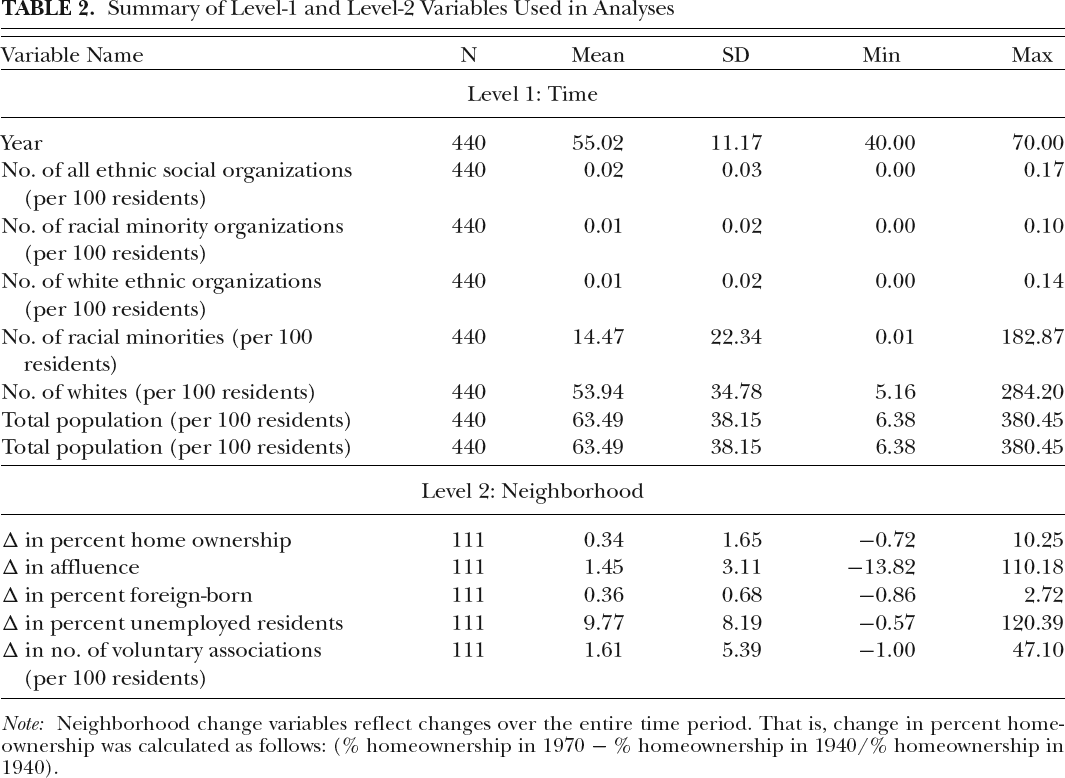
Neighborhood change variables reflect changes over the entire time period. That is, change in percent homeownership was calculated as follows: (% homeownership in 1970 − % homeownership in 1940/% homeownership in 1940).
With respect to race over time, descriptive statistics indicate that neighborhoods were fairly segregated. Panel 1 (Table 2) shows that in an average neighborhood for every 100 residents, 54 were white. In addition, this table shows that 14 of every 100 residents were racial minorities. Still, there were neighborhoods that contained as few as 1 racial minority per 100 residents and 5 white residents per 100 residents.
With respect to neighborhood conditions, Table 2 indicates that from 1940 to 1970, homeownership increased by 34 percent, percent foreign–born increased by 36 percent, and affluence increased by a factor of 1.45. Neighborhood unemployment increased by 9.77 percent. Last, data reveal that on average the number of voluntary associations increased in neighborhoods from 1940 to 1970.
Multivariate Results
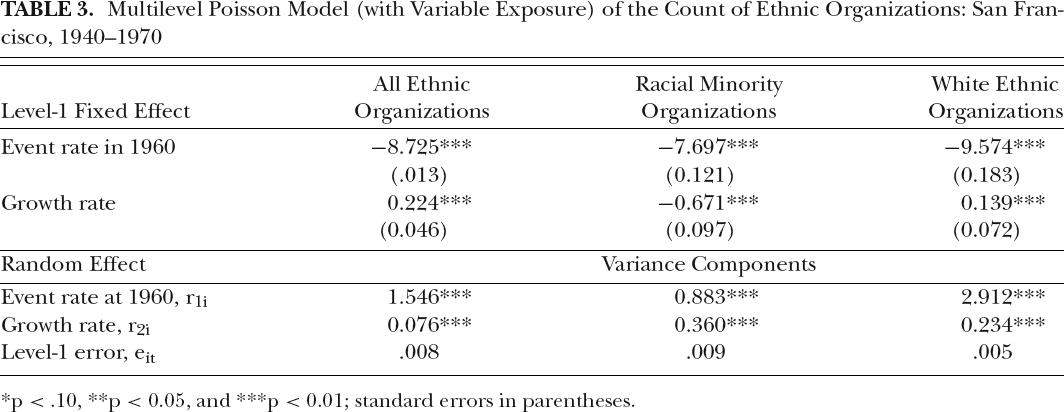
Table 3 provides estimates of the expected value (or event rate) of each organizational type to occur in 1960. The occurrence rate in 1960 is −8.725 for all ethnic organizations, −7.697 for racial minority organizations, and −9.574 for white ethnic organizations. To facilitate the interpretation of these coefficients, I take the log odds of each event rate, such that Y = e−8.725 = 0.0002, Y = e−7.697 = 0.0004, and Y = e−9.574 = 0.00007. Overall, these small expected values indicate that the probability of an ethnic organization occurring, whether white ethnic or racial minority, is a rare event.
Multilevel Poisson Model (with Variable Exposure) of the Count of Ethnic Organizations: San Francisco, 1940–1970
*p < .10,
**p < 0.05, and
p < 0.01; standard errors in parentheses.
Although the neighborhood presence of ethnic organizations is an unlikely occurrence overall, analyses in Table 3 show distinct patterns of growth among white ethnic and racial minority organizations. Consider the growth rate coefficient (β10) for ethnic organizations generally as well as white ethnic and racial minority organizations. Table 3 indicates that generally the number of ethnic organizations grew at a rate of 125 percent (e.224) for every additional 100 residents from 1940 to 1970. With respect to white ethnic and racial minority organizational growth, however, results indicate that the number of white ethnic organizations grew by an average of 115 percent (e.139) for every additional 100 white residents, but the number of racial minority organizations decreased by 51 percent (e−.671) for every additional 100 racial minority residents.
Last, Table 3 shows that (see variance components) there is significant variability in the expected rate of ethnic organization, white ethnic, and racial minority organizations within neighborhoods in 1960. Similarly, there is significant variability in the growth rate of ethnic organizations, white ethnic, and racial minority organization within neighborhoods over time. I find little evidence of between–neighborhood differences with respect to any of the organizational types.
The findings with regard to racial minority organizations challenge human ecology expectations that the growth of neighborhood racial minority population should lead to an increase in racial minority organizations. Indeed, it appears that the growing presence of racial minority residents is associated with declines in racial minority organizations. Moreover, level–1 estimates show that the intensity of ethnic organizational life in neighborhoods with growing numbers of racial minority and white residents varied. For example, the event rate for racial minority organizations decreased by 0.023 percent (e−7.697 × e−.671), while the event rate for white ethnic organizations increased by 0.008 percent (e−9.574 × e.139). Put differently, the probability of racial minority organizations being present in neighborhoods decreased over time, while the probability of finding white ethnic organizations increased.
Estimating Effects on Changing Neighborhoods on Ethnic Organizations
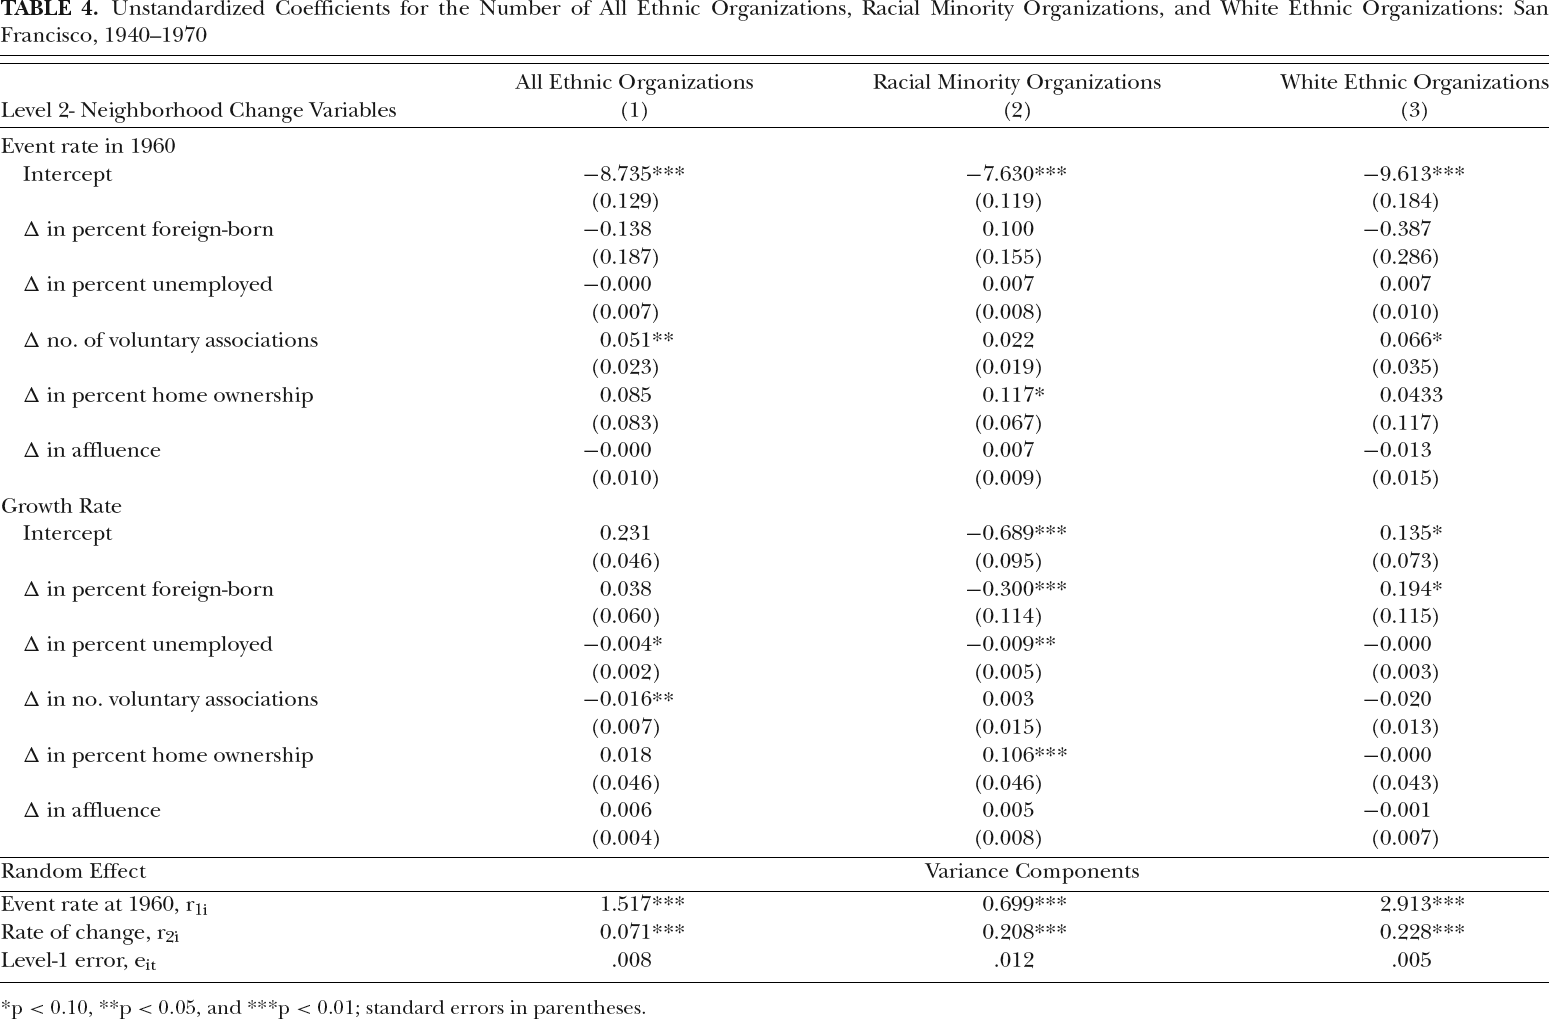
Table 4 tests the proposition that the presence and growth of ethnic organizations are shaped by neighborhood conditions. Results indicate that most postwar neighborhood conditions had little to no impact on the predicted expected value of ethnic organizations in 1960. There was an exception, however. The predicted expected value of ethnic organizations in 1960 for a neighborhood with increasing numbers of voluntary associations increased (coefficient = 0.051). A one standard deviation increase in the number of voluntary associations is associated with a 131.64 percent increase in the expected number of ethnic organizations per 100 residents in 1960.
Unstandardized Coefficients for the Number of All Ethnic Organizations, Racial Minority Organizations, and White Ethnic Organizations: San Francisco, 1940–1970
p < 0.10,
p < 0.05, and
p < 0.01; standard errors in parentheses.
With respect to growth rates over time, Table 4 also shows that neighborhood unemployment conditions moderate the growth of ethnic organizations. The growth rate of ethnic organizations is 93 percent times lower in neighborhoods with rising unemployment. This finding suggests that unlike national studies of ethnic newspapers, economic declines impair conditions for the growth of ethnic organization in neighborhoods.
Estimating Effects of Changing Neighborhoods on White Ethnic and Racial Minority Organizations
Table 4 contains evidence of divergent growth patterns among white ethnic and racial minority organizations. Indeed, racial minority organizations differ from white ethnic organizations in several respects. With respect to immigration, analyses show a strong and negative association between the growth of racial minority organizations and changes in the percentage of the foreign–born in neighborhoods. Specifically, results indicate that the growth of racial minority organizations drops by 82 percent with a one standard deviation increase in percent foreign–born. White ethnic organizations, in contrast, grow in number as the percentage of the foreign–born increases (114 percent higher in neighborhoods with rising foreign–born populations). These findings support previous research on white ethnic newspapers. It appears that the growing foreign–born population creates favorable conditions for the growth of white ethnic organizations. However, the opposite is true for racial minority organizations.
If the size of the immigrant population in a neighborhood is an unfavorable condition for racial minority organizations, so is rising unemployment. The growth of racial minority organizations decreases by 85 percent with a one standard deviation increase in neighborhood unemployment. We can interpret this finding to mean that in the context of the neighborhood, economic declines suppress the ability of racial minority organizations to expand.
Last, Table 4 indicates that changes in homeownership are positively and significantly associated with the growth of racial minority organizations, though only slightly associated to the average event rate in 1960. In other words, homeownership is an important environmental condition for growth but less so for the existing presence of a racial minority organization. Interestingly, the effect of homeownership appears to hold only for racial minority organizations. This suggests that rising homeownership improves the presence and growth of racial minority organizations. This offers strong support for the organizational ecology position—neighborhoods with rising homeownership rates had a higher carrying capacity for racial minority organizations and, therefore, these organizational types grew. At the same time, this finding supports social organization theory since neighborhood stability appears to be conducive to organizing along racial and ethnic lines in a way that aligned with community interests.
Discussion and Conclusion
Research on ethnic organizations has often rested on the human ecological idea that racial and ethnic organizations will reflect the racial and ethnic composition of neighborhoods. This paper proposes that, to understand the growth of ethnic organizations, it is crucial to view neighborhoods as organizational environments that change over time and shape the ability of ethnic organizations to grow (or decline).
Using San Francisco as a case, this research reveals four important patterns. First, although ethnic organizations, of any type, were extremely rare to find in neighborhoods across the city, racial minority organizations and white ethnic organizations maintained a presence in some neighborhoods. In fact, this study shows that racial minority organizations were more likely than white ethnic organizations to appear across the observed 30–year time period. These findings challenge early ecological claims about neighborhood succession dampening the presence of ethnic organizations. More important, this study suggests that the small yet steady number of ethnic organizations in a neighborhood over time reflects just how stable this organizational form was during the postwar period.
Second, this study shows that rising neighborhood homeownership generally drives the propensity and growth of racial minority organizations. While race and ethnicity scholars night frame the rise of ethnic organizations as a consequence of ethnic social capital (Zhou 2005; 2009), I interpret this finding as homeownership creating a stable environment for racial minority organizations to establish roots in order for racial minority organizations to grow. Of course, it is important to keep in mind that racial minority organizational growth occurred in neighborhoods where they already existed. Given the patterns of postwar segregation in San Francisco, it may very well be that homeownership fostered the growth of racial minority organizations, while segregation acted as a barrier to their dispersal.
If racial minority organizations are fostered in environments where homeownership rates are increasing, this research shows that two key neighborhood changes create uncertainty: rises in neighborhood unemployment and increases in percent foreign–born. Organizational ecology theory argues that competition for limited and common resources in the organizational environment makes organizations vulnerable. In the case of racial minority organizations, growing neighborhood disadvantage and increasing heterogeneity creates competition for resources (e.g., money, members, location) that leads to the decline of this organizational form. In other words, as an organizational form, racial minority organizations over time cease to fit in neighborhoods where the size of the foreign–born population is increasing or unemployment is rising.
While ethnicity, organizations, and neighborhoods are interlinked, ethnicity and locality intersect in ways that produce distinct outcomes for racial minority and white ethnic organizations. White ethnic organizations seemed impervious to postwar neighborhood changes. In fact, in neighborhoods where white ethnic organizations are present, the only variable examined here that positively affected their organizational growth is rising foreign–born population rates. These findings suggest that as an organizational form, white ethnic organizations seemed much less challenged than racial minority organizations by changing resource conditions at the neighborhood level.
Footnotes
Acknowledgments
Thanks to Katherine Chen, Howard Lune, and Stacey Sutton. Special thanks to Hilary Silver and the anonymous reviewers for suggestions that vastly improved this manuscript. All errors are mine.