
Abstract
We examine the role party identification plays in moderating people's perception of place. Do people rely on heuristics to gauge neighborhood partisan composition? If so, those estimates may influence their perception of fit and neighborhood satisfaction. We find that in the absence of concrete, detailed information, people make quick judgments. Republicans, compared to Democrats and non–partisans, are more likely to develop impressions based on the specific location characteristics presented here. When perceived to be a political minority in an area, people are less likely to feel that they belong. In addition to conventional economic and life–cycle factors, political perceptions also affect judgments about the suitability of prospective neighborhoods.
In recent years, the partisan and ideological divide between urban and rural areas has become increasingly visible (Brownstein 2016; Cramer 2016; Johnston et al. 2016; Sussell 2013; Walsh 2012). Throughout the nation there are increasingly one–sided voting patterns at many locations, and a steady erosion in the number of voters living in politically competitive settings (Bishop 2009; Johnston et al. 2016). Psychologists propose that the formation of geographic pockets of sociopolitical similarity are a response to the psychological need for belonging (Golman et al. 2016; Sirgy et al. 2005). Although an agreeable opinion environment may heighten a group member's psychological sense of security, highly biased opinion distributions are also thought to generate ignorance of the diversity present in the world, because the true distribution of opinions in society differs from what is voiced and echoed locally (Duggins 2016). Geographically distinct opinion subcultures anchored in conformity to local norms become more extreme over time, as the regularity of contact with outside groups wanes. The result is wider disagreement and less tractable conflict across groups (Motyl et al. 2014).
There are two main explanations for the development of geographic divisions in political allegiance. One explanation is that there is a strong linkage between partisan preference and place preference (Gimpel and Hui 2015, 2017; McDonald 2011; Motyl et al. 2014; Cho et al. 2013). Through the accumulation of decisions to leave or stay over time, Americans have become better “residentially sorted” into neighborhoods by political viewpoint (Bishop 2009). Self–identified Republicans are increasingly more likely to populate ex–urban areas: fringe suburbs, smaller towns, and rural areas, whereas Democrats are more comfortable in denser, more urban environments. A recent study attests that such residential partisan sorting can occur intentionally (i.e., people deliberately look for signals of co–partisan compatibility when they move) and inadvertently (i.e., people with the same party affiliation happen to prefer similar neighborhoods; Gimpel and Hui 2017).
Another explanation is unrelated to residential preference or patterns of geographic mobility. Voters may have become more sorted by political viewpoint without having to move somewhere else, through the processes of socialization and conformity to group norms (Carlson and Settle 2016; Cialdini and Goldstein 2004; Huckfeldt and Sprague 1995; Levendusky 2009; Lyons 2011; Parsons 2015). People can now more accurately recognize the political party that aligns with their other social identities and group memberships (Clifford 2017; Davis and Mason 2016; Green et al. 2002; Mason 2015; Smaldino et al. 2017). Hence the liberal leaning voters residing in urban settings quickly learn to identify themselves as Democrats, whereas the conservative leaning voters in outlying areas are socialized to affiliate with Republicans. According to this theory, the increase in the urban–rural divide seen in recent election maps (Kinsella et al. 2015; Walker 2013) derives primarily from the strengthening association between party affiliation, political ideology, and other social identities at the individual level and less through residential relocation.
Certainly, these two explanations are not mutually exclusive. In fact, empirical evidence suggests that both are occurring in the population (Lang and Pearson–Merkowitz 2015). Although the extension of party identification into other, previously less political, venues of life has been generally accepted as an observable fact, critics have expressed doubt about residential sorting as a mechanism for increasing geographic segregation (Abrams and Fiorina 2012). In particular, the skepticism hinges on whether people are able to detect or perceive the political character of prospective destinations, not just when displays of political yard signs and bumper stickers are visible in the fall of an election year, but more routinely, from a “mere look around.”
In this paper, we examine the role party identification plays in moderating people's perception of place. In the first part of our paper, we study if people rely on heuristics to gauge neighborhood partisan composition and examine whether self–reported Democrats, Republicans, and the nonaligned would interpret the same cues differently. By heuristics, we refer to mental short–cuts people use to make quick judgments and reach conclusions. It is important to emphasize that such heuristics, if present, are purely subjective and may not be empirically validated by the person using them. What really matters is not whether these heuristics are factually correct or verified at some later point. Similar to stereotypes, these unverified heuristics are powerful ways that, subconsciously or unconsciously, guide emotions, behaviors, and personal interactions. By investigating how people employ such short–cuts, we can better understand how partisan residential sorting might occur.
We approach the empirical question by devising two rounds of survey embedded experiments. In these experiments, respondents were randomly assigned into a control group and treatment conditions. In each control group, respondents were asked to gauge the partisan mix of a hypothetical neighborhood based on a photo of a dwelling. Respondents in the treatment groups were given additional photos of neighborhood features, such as a church, a playground, and types of stores or shops reported to be close by. Among our cues, we find that the dwelling coupled with the photo of a playground and a church has the strongest impact on neighborhood assessment. While churches can present in any neighborhood, respondents are likely to associate them with a neighborhood housing a higher concentration of Republicans. In contrast, the presence of bike–shop and a tattoo parlor is perceived to be associated with a neighborhood with a higher concentration of Democrats.
More importantly, we identify systematic differences across partisan groups in the ways they evaluate seemingly ordinary features of a neighborhood environment. Compared to Democrats and non–partisans, Republicans change their judgments somewhat less in response to the additional neighborhood features. However, they are more likely to develop their political impressions based on the type of dwelling in the baseline condition (single–family home vs. condominium) and from inferences about the likely setting (rural/suburb vs. urban).
In the second part of the study, we show party identification can moderate respondents’ perceptions of the partisan composition of their neighborhood, which, in turn, can alter their level of neighborhood satisfaction. Considered together, our evidence suggests that even in the absence of concrete, factual information about neighborhood partisan leaning, people evaluate political composition on the fly. Their perceptions of the politics of a place are internalized and shape their subsequent conclusions about fit. When they sense they are the partisan minority, they become less likely to identify with the neighborhood and express lower levels of satisfaction. In addition to the conventional economic and stage–of–life factors that govern residential choices, political orientation does play a role, accounting for why the electoral geography in the country is becoming more subdivided by partisanship over time.
Assessing Neighborhood Suitability
The vast literature on residential choice has identified several criteria people use to evaluate prospective neighborhoods. Price and racial composition rank at or very near the top, followed by public safety and schools, then other amenities and public services (Banzhaf and Walsh 2013; Brown and Moore 1970; Clark 1992; Dieleman 2001; Rossi 1955; Tiebout 1956). There is very little in the literature that suggests that neighborhood partisan composition could play a role, although there are frequent references to the assessment of “fit”—or estimation of the person–environment match (Rapoport 1990). Studies on residential satisfaction provide insight into what constitutes a good and bad fit. Because properties and neighborhoods send signals about status, income, life–cycle stage, population composition, crime, safety, and values, prospective residents can deduce information about the people who live there and how they might fit in among them. Psychologists point out that finding a good fit with the surroundings is important for individual well–being, enhancing self–esteem, and contributing to life satisfaction and even good health (Bleidorn et al. 2016; Jokela et al. 2015, 2016; Motyl 2014; Rentfrow and Jokela 2016).
Sometimes the messages sent by environmental cues are as obvious as a yard sign or bumper sticker identifying a party or candidate. Other times they are indirect, or subtle, notable only to those who are informed. First impressions of the types of people who live in a place are readily provided by glimpses of housing and commercial environments. Perhaps the most common initial judgment is formed based on recognition of the familiar. Does this place seem desirable based on what I witness about the living space of the current residents? At the extremes, these impressions go to evidences of vandalism, distressed property, poor maintenance, and abandonment—signs that send clear signals about disinvestment, and depending on location, can also convey information about race and ethnic composition. The additional prevalence of fast food chains, discount stores, and storefronts offering check–cashing services and auto–title loans, may leave the impression that this is a blue collar–dominated area. Miles away sit the expansive lots, multi–stall garages, and new architectural styles present in a new cul–de–sac development, with nearby big box emporiums and an outdoor mall. One can make the reasonably safe bet that new suburbs are home to more Republicans than places closer to the center of the metro area exhibiting greater racial diversity, well–worn infrastructure, and higher density.
In between these extremes is where subtler signals are sent, less obvious than those exhibiting clear contrasts in income, or race and ethnic composition. Many choices involving the fit of a neighborhood occur within broad economic strata rather than across them. Not everyone can afford to move. Those who can are usually capable of selecting from among a subset of locations that also satisfy basic criteria such as proximity to employment, and a substantial sense of safety. The question is whether more nuanced or graduated differences across sociocultural settings can be detected from a visual scan, and how impressions of a location's political leaning may be modified by additional information gleaned from its perceptible features. The research here offers insight as to how people make judgments about the political inclination of alternative neighborhoods based on what they understand to be typical about the settings partisan groups tend to occupy and prefer.
Gauging a neighborhood's political bent, therefore, is a measurement against what respondents have come to view as typical in a place (Lewis 2015, 93). Moving to a fringe suburb is almost always going to situate someone around more Republicans than moving to a similarly priced neighborhood in the core city. At the neighborhood scale, and during election time, campaign signs may give some clues. Yet a majority of households will not exhibit these indicators. Disaggregated electoral returns at a ward or precinct level may validate one's guess about political inclination but obtaining those data requires significant effort. There is no evidence that prospective residents routinely go to such lengths in their neighborhood search. But they may not need to.
Fittingness goes well beyond judgments about the physical characteristics of a location—its density, newness, or distance to downtown—to inferences about its social congruence (Smaldino et al. 2017). Only a few studies have focused on exactly what is sought in a neighbor, or what people desire in terms of social interactions (Hui 2013). Housing research has shown that satisfying social interaction and friendship networks are important in the decision to stay rather than move (Mellander et al. 2011). Similarly securing a sense–of–belonging through social engagement is important to determining the difference between a satisfying relocation and an unhappy one (Oishi 2010; Oishi and Schimmack 2010).
The match between individual social identity and the identities present among prospective neighbors would appear to be vital to neighborhood evaluations, even when choice is constrained to a small subset of possibilities. However, the dimensions of fit are potentially numerous and difficult to assess, much less observe, from a research standpoint. Racial composition and the affluence of a community are considered foremost considerations (Hedman et al. 2011), perhaps because they are also relatively easy to gauge. A walk down the street, or to nearby schools and playgrounds, offers a quick glimpse into the racial and ethnic composition of a place. Big houses with refined architectural details and well–maintained lawns are tell–tale signs of conscientious property owners, appealing to personality types that value orderliness (Lewis 2015). Compact development in walkable areas with mixed–use zoning and mass transit stops sends signals that inhabitants possess politically liberal values associated with an appreciation of new experiences, diversity, and the excitement of city life. Urban life has long been described by leading sociologists as “unconventional” (Fischer 1995, p. 544), meaning that it is associated with multiple social worlds, each possessing its own set of defining traits and values. But conventionality is commonly regarded by psychologists as underpinning a traditionalist political outlook, explaining why conservatives seek to avoid big cities (Carney et al. 2008).
In the hypothesis tests in this paper, we evaluate whether respondents can utilize subtle, ambient heuristics to gauge neighborhood political fit, and whether self–reported Democrats, Republicans, and the nonaligned (or less partisan) use them differently. Then, we examine if perception of neighborhood partisan composition affects one's residential satisfaction. By heuristics, we refer to mental short–cuts people use to make quick judgments and inferences about the social compatibility of a place from ordinary observation. What really matters is not that these short–cuts are factually correct or verified to be accurate against neighborhood data. Similar to stereotypes, these assessments are based on signals associated with known consumption patterns and the presence of groups judged to be familiar and receptive, or discordant, and even adverse to one's well–being. A mere drive by the features present in a place informs potentially clear impressions about its attractiveness and suitability as a living environment. No discussion or extensive research is required for prospective residents to form an appraisal.
Data
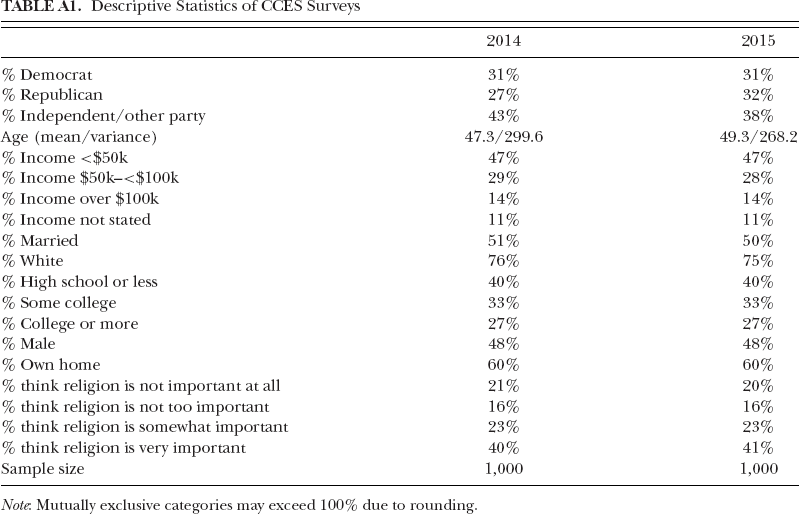
We devised two rounds of survey embedded experiments in the 2014 and 2015 Cooperative Congressional Election Studies (CCES). Begun in 2006, CCES is a multiuniversity collaboration to study public opinion and the political behavior of American electorate (Vavreck and Rivers 2008). Administered by the California based polling firm YouGov, CCES surveys are periodically carried out online, with respondents drawn from a large panel to generate a nationally representative sample. Comparisons with traditional survey research methods have verified the representativeness of samples drawn from the CCES internet panel and the accuracy of election forecasts from the data (Ansolabehere and Rivers 2013; Ansolabehere and Schaffner 2014). A mounting number of social science studies draw on the CCES data as an accessible and relatively low cost resource for testing hypotheses on a broad range of topics germane to political outlook and choice among the mass public. 1 The descriptive statistics for both surveys are presented in Table 4.
Experimental Design
We study if people rely on visible markers on the landscape to gauge neighborhood partisan composition and examine whether self–reported Democrats, Republicans, and non–partisans would interpret the same cues differently. The first experiment is presented in the 2014 survey, and the second in the 2015 version. In the two rounds for each experiment, respondents were randomly assigned into control group and treatment conditions, with each round involving three groups of approximately 165 respondents each, resulting in six separate groups each time. The respondents were asked to gauge the partisan mix of a hypothetical neighborhood based on a single nondescript photo of a dwelling (control condition); a pair of photos (the dwelling plus another neighborhood feature, treatment 2), or three photos (the dwelling, plus the photo of the feature included in treatment 2, plus one other neighborhood feature, treatment 3). The dwelling in the photo is the same in each of the three groups. The stimulus as it appeared to the three groups in each experiment is set forth in Figures 4 and 5. We summarize our experimental design in Table 1.
Experimental Setups in 2014 and 2015 CCES Modules
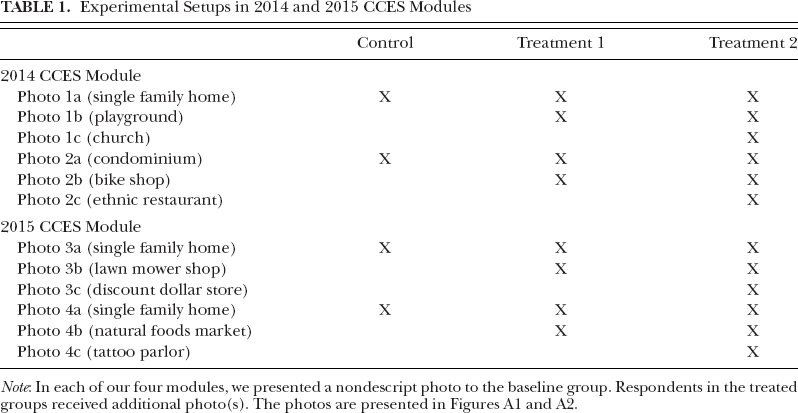
Note: In each of our four modules, we presented a nondescript photo to the baseline group. Respondents in the treated groups received additional photo(s). The photos are presented in Figures A1 and A2.
Each group is asked to gauge the partisan balance of the neighborhood in which the dwelling appears, with the treatment groups understanding that the additional photos also depict features of the same neighborhood. In each experiment, the baseline dwelling is a photo of either of a single–family home, a condominium, or a duplex. We varied our baselines to represent different types of housing, consciously avoiding extremes at either end of the poverty–affluence continuum. Nor did we choose photos of homes displaying political yard signs, with automobiles in front sporting political bumper stickers, or with such patriotic symbolism as the U.S. flag on display. Our baseline photos were not selected to produce pungent, easy judgments in one political direction or another, but to evaluate how initial judgments about the partisan tilt of a location might be altered by additional features of the geographic setting that might offer hints about political leaning.
Upon seeing the visual cues, respondents were prompted to answer the question, “Looking at the photo, if you were to estimate the political party balance of the neighborhood in which this home is situated, what would your estimate be?” To answer, respondents were shown a horizontal slide bar that ranges from 0 to 100, where 0 indicates that the setting is homogenously Democratic (left end point) and 100 signifies homogenously Republican (right end point) respectively, and a mid–point denotes a “50–50 Even Balance” of partisanship. Because the photos of the dwellings themselves offer no highly conspicuous clues about the partisan composition of the neighborhood in which they are situated, we expect the response to the initial photo to hover around the midpoint, varying to the right (Republican) or to the left (Democratic) by a few points.
Using additional photos for randomly drawn equivalent groups, we then test a series of potential home/neighborhood heuristics that might alter estimations of partisan balance based on the photo of the dwelling alone. To be sure, the photos of the dwellings alone might inform the kinds of neighborhoods where they are found. The additional neighborhood cues include a church, a playground, a bicycle shop, an ethnic sidewalk restaurant, a lawnmower shop, a discount store, a health food store, and a tattoo parlor. If people obtain any additional information from these assorted images, we would observe a statistically discernible change in the estimates of party balance compared to the control group. We then turn to examine heterogeneity among the responses by party identification. We expect heterogeneity in effect to be pronounced as previous studies have found that party identification can act as a lens through which people perceive the world and decode information.
Results from Experiments
Table 2 shows the results from an ordinary least squares regression analysis of our experimental conditions, without differentiating subjects by background characteristics. Among our four baseline photos, the condominium building (2014–Module 2) is associated with a higher concentration of Democrats (45.2) whereas the single family country–style home (2015–Module 3) is thought to be situated in a neighborhood with more Republicans (57.4).
Estimates of the Partisan Balance of Neighborhoods Exhibiting Various Dwellings and Neighborhood Features
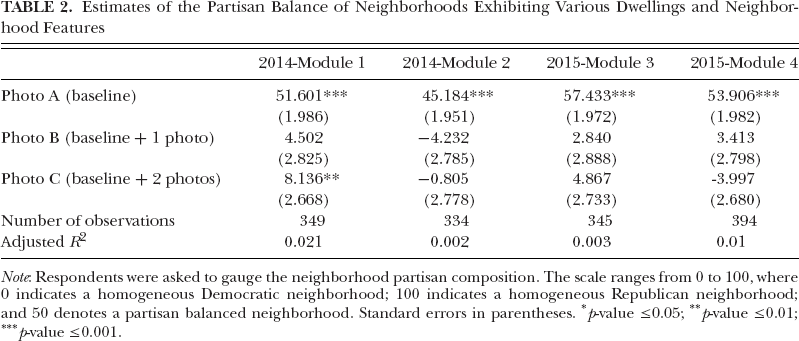
Note: Respondents were asked to gauge the neighborhood partisan composition. The scale ranges from 0 to 100, where 0 indicates a homogeneous Democratic neighborhood; 100 indicates a homogeneous Republican neighborhood; and 50 denotes a partisan balanced neighborhood. Standard errors in parentheses.
*p–value ≤0.05;
p–value ≤0.01;
p–value ≤0.001.
Across the four modules, Module 1 in our 2014 survey shows the biggest change. In the control group, the older single–family home has a group mean of 51.6, which hovers around the mid–point which indicates uncertainty. When respondents were shown the additional picture of a playground, the estimated neighborhood mix jumps from 51.6 to 56.1, indicating subjects expected a higher concentration of Republicans. But this difference (4.5 points in a Republican direction), although substantively notable, fails to reach conventional levels of statistical significance with 350 respondents.
When respondents were shown a picture of a church, in addition to the home and the playground, the estimate further increases to 59.8% Republican. This size difference of 8 points from the photo of the home by itself is statistically discernible from zero (p ≤ .002). Apparently, the combined stimulus of this dwelling, the playground, and the church are indicative of a substantially more Republican location, likely resulting from the combined impressions of a neighborhood with a family orientation, with a traditional Christian house of worship around the corner.
In the second experiment, Module 2, respondents certainly identified the condo with a neighborhood that leaned Democratic, scoring it about 45%, and certainly more Democratic than the suburban house in the first set of stimuli, which scored only 48%. Respondents viewed the combination of the condo with the bike shop as making the neighborhood even more Democratic (b = −4.2), although this estimate falls short of reaching statistical significance at the p ≤ .05 level. Notably, the addition of the sidewalk café to the condo and the bike shop did not clarify the partisanship of the neighborhood, altering impressions only by a modest additional 0.81 points in a more Democratic direction, but not reaching statistical significance.
The third experiment, conducted in the 2015 survey, the photo of the small country–style house with a rock wall and ornamental windmill, generated a strong Republican impression of 57%, markedly different from the previous two dwellings. The additional photos move this estimate in an even more Republican direction (by 2.8 and by 4.8 points, respectively), although not to a statistically significant extent given the number of respondents (n = 345).
Finally, in the fourth experiment, the large duplex house generated a Republican–tilted estimate of 54%, but the additional photos sent subjects’ partisan impressions in opposite directions. The photo of the duplex with the natural foods store moved estimates in a more Republican direction by 3.4 points, whereas the combination of the natural foods store and the tattoo parlor moved impressions back in the other direction by 4 points, both falling short of statistical significance at conventional levels.
What these results indicate is that the dwellings alone are distinct enough from each other to produce consequential differences in estimates of the political composition of neighborhoods. Perhaps this is because the key element involved in assessing the fit of a neighborhood is what the prospective homes look like, not the businesses around the corner or several blocks away. People do, after all, spend a great deal more time in their home than they do anywhere else in the neighborhood. Homes are known to have especially powerful symbolic and psychological significance (Cooper–Marcus 1995; Graham et al. 2015). Accordingly, we observe 12 points separating the estimate for the country–style house from the estimate of the condominium in the city. Of the additional neighborhood features we examined, only the church sent a sizable enough signal among the relatively subtle alternatives here to alter estimates of partisan composition to a statistically significant extent (see Table 2). The other effects of 3–4 points shown in Table 2 may seem unremarkable, but bear in mind that these stimuli were not intended to produce a heavy–handed partisan impression. A recognizable mega–church would probably prompt a stronger reaction. Yet we show that fainter signals can still provoke a partisan response.
Heterogeneity of Effect by Party Identification
One reason why the additional photographs showing the natural foods market, the lawnmower shop, or the tattoo parlor may not produce a statistically significant effect is because they are perceived differently by opposing partisan groups. In this section, we examine the assessments by partisan identification. The CCES respondents are classified into three partisan groups, namely self–reported Republicans, Democrats, and non–partisans/others. For each survey, about 30% were self–reported Republicans, 30% were Democrats, and 40% reported that they were not affiliated with either major party.
We ran four models, one for each module, that include the interaction terms between treatment conditions and party identification. Figure 1 shows the effect displays (Fox 2003). The values on the Y–axis are fitted values from the models. We also ran the same models with 7–point party identification. The results are reported in Online Appendix A. We do not include the results from the Online Appendix in the text because each survey module only has about 350 respondents. To subdivide each module with three treatment groups into 7 partisan groups (i.e., 21 subgroups altogether) makes the estimates unreliable due to the small subsamples.

Heterogeneous responses among three partisan groups to neighborhood combinations.
Compared to Democrats and non–partisans, Republicans appear to hold stronger intuitive perceptions based on the features of the place setting. That is, Republicans are more likely to derive their conclusion based on the type of structure (single–family home vs. condominium) or location (rural/suburb vs. urban). Take the first experiment in the 2014 survey, for example. Even with a nondescript baseline photo of a single–family home, Republican identifiers, compared to Democrats and non–partisans, are more likely to perceive the neighborhood to have a larger presence of their co–partisans. Furthermore, note in Figure 1 that across our three treatment conditions, the fitted values among Republican respondents are comparable. This indicates that the additional photos given to the treatment groups hardly offer any additional information to guide perception. The same pattern can be observed in other modules. In the second module in our 2014 survey, Republicans are more likely to associate the condominium setting with higher concentration of Democrats. In the treatment groups where respondents were given additional cues, the cues slightly solidify their perception but do not alter the perception notably. In both experiments in the 2015 survey, again, Republicans are more likely to infer the partisan mix based on the type of housing.
In contrast, self–identified Democrats and non–partisans have less strong intuitive perceptions about the dwellings alone and are more sensitive to the additional neighborhood images. Yet the two groups are not consistent in the ways they interpret the additional neighborhood characteristics. In module 1 of our 2014 survey, non–partisans respond to the “playground” cue but Democrats react more strongly to the presence of a church. In the second experiment of 2014, self–identified Democrats associate the ethnic sidewalk café with a higher concentration of Democrats but non–partisans interpret that in the opposite direction. In the two experiments carried out in 2015, whereas Democrats and non–partisans exhibit similar patterns of response, they stand in contrast with Republicans. The former groups see a neighborhood with the natural food grocery as more Republican oriented, Republicans think that signals a more Democratic location.
Perception of Neighborhood Partisan Composition and Satisfaction
In the above section, we show that partisans can make inferences about the political composition of a neighborhood from features visible from a mere look around. In this section, we examine if there is any linkage between self–assessed neighborhood partisan composition and residential satisfaction.
The 2014 CCES module included two questions. Respondents were asked to assess the partisan composition of their current neighborhood. The question reads, “Thinking of your neighborhood as the area within 1 mile of your house, or perhaps slightly more, if you were to estimate the political party balance of your neighborhood, what would your estimate be?” 0 indicates they think they reside in a homogeneous Republican neighborhood, 100 if they reside in a homogenous Democratic neighborhood. Again, it is important to emphasize that the answers were self–perceptions of their political environment and were not empirically validated against election or party registration data.
For dependent variables, we asked respondents to rate their neighborhood satisfaction with a battery of six questions. The six questions, the order of which was randomly displayed to respondents, were:
This area is a reflection of me I would move somewhere else if I could This is my favorite place to be I really miss it when I am away too long I feel happiest when I am here I do not really fit in with the people who live here
Respondents were asked to rate on a five–point Likert scale, whether they “strongly disagree,” “disagree,” “neither agree nor disagree,” “agree,” and “strongly agree” with each statement. We assigned −2 to “strongly disagree,” −1 to “disagree,” 0 to neutral position, 1 to “agree”, and +2 to “strongly agree.” As the second and last items were given in reversed direction, we recoded all the six items in a consistent manner such that a higher score indicates a higher level of satisfaction. Figure 2 shows the correlation among these six questions. Respondents who say their neighborhood is their “favorite place to be” are more likely to express happiness and think the place is a “reflection” of them.
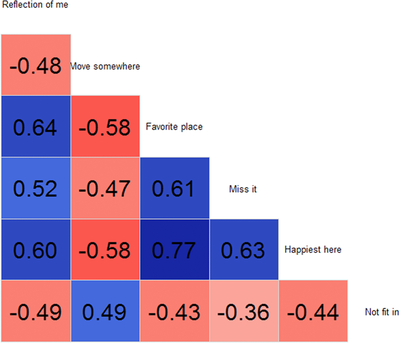
Correlation among six neighborhood satisfaction questions.
We ran separate regressions for each item in Table 3. In addition to party identification and sociodemographic covariates, we also included the respondents’ perception of the political complexion of their own neighborhood, and an interaction term with party identification. Notably, the interaction terms are all negative. These findings suggest that a self–perceived higher concentration of Democrats in their neighborhood reduces neighborhood satisfaction among Republicans and non–partisans. In particular, for both Republicans and non–partisans, when they perceive that they are a political minority in their neighborhoods, they are less likely to think the place is a reflection of them, less likely to report that they miss the place when they are away, and less likely to think they fit in with the residents there. Our results demonstrate that self–perceived partisan context can factor into one's perception of fit and basic dimensions of neighborhood satisfaction (see Table 3).
Six Questions on Neighborhood Satisfaction by Reported Neighborhood Partisan Composition and Other Covariates
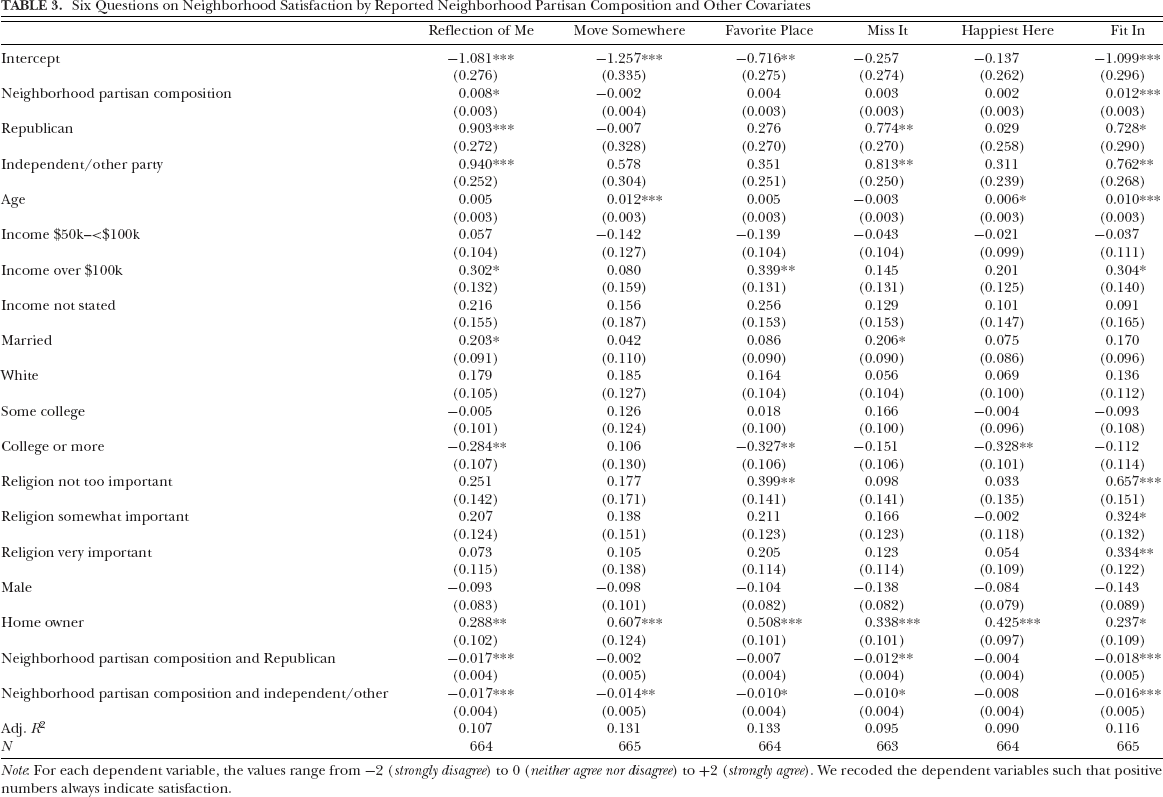
Note: For each dependent variable, the values range from −2 (strongly disagree) to 0 (neither agree nor disagree) to +2 (strongly agree). We recoded the dependent variables such that positive numbers always indicate satisfaction.
The next step is to combine all six items into a composite index of satisfaction. The resulting neighborhood satisfaction score ranges from −12 to +12. Taking that score as a dependent variable, we employed ordinary least squares regression, included socio–demographic characteristics, and added an interaction between self–assessed neighborhood partisan composition and party identification. Figure 3 plots the interaction results. The X–axis displays the range of self–assessed partisan composition, with 0 indicating a homogenous Republican concentration and 100 indicating a homogenous Democratic concentration. The graph illustrates unmistakably that perceptions of neighborhood political composition matter to residential satisfaction. Democrats express a substantially higher level of satisfaction when they think their neighborhood has a higher concentration of co–partisans. Republicans and non–partisans express far lower overall satisfaction than when they perceive themselves to live among a Democratic majority, just as Democrats express higher satisfaction when they view themselves to be living among friendly co–partisans (see Figure 3).
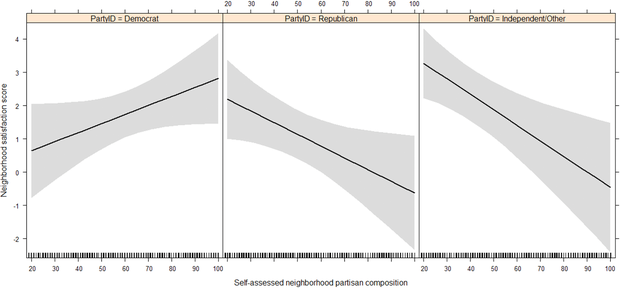
Self–perceived neighborhood partisan composition and residential satisfaction.
Discussion
There is a great deal of symbolic meaning in ordinary features of a neighborhood, such that when drive–by images are combined and understood to be co–located, they can lead to inferences about a wide variety of population characteristics; not only wealth, race and ethnicity, and age distribution, but also political leaning. Often, views of dwelling places, alone, are sufficient to inform estimates of the political orientation of the neighborhood in which they are situated. The presentation of other features may either sharpen or obscure initial assessments.
Some neighborhood features send political signals that are clear to nearly everyone, regardless of party, explaining why all of the subjects thought the combination of the older suburban house, the playground, and then the church were indicative of a Republican–leaning area. But in other instances, partisans may be socialized to avoid certain places by reading negative signals from the environment that others do not see. Even when people are looking at the same picture, they may experience and interpret the picture differently—some see a warning, while others see a welcome. Partisan differences are likely a consequence of exposure to particular environments in which certain landscape features are co–located and seem comfortably familiar, whereas others seem out–of–place, risky, or alienating. Republicans appear to exhibit slightly more sensitivity to neighborhood features than Democrats. Of course this may be an artifact of these particular stimuli. Alternatively Republicans might be quicker to recognize these particular scenes as possessing partisan meaning, especially if out–party dominant environments signify threat (Hibbing et al. 2014). On the other hand, Tritt et al. have suggested that conservatives are more aroused by environmental stimuli more generally, whether it is positive or negative. Signals that a place might be attractive or repulsive will be immediately deciphered by Republican partisans, whereas Democrats may be slower to interpret or decode them (Tritt et al. 2016).
Some have argued that the modern neighborhood is a place where “nobody knows your name” (Abrams and Fiorina 2012). People often do not know their neighbors, or make much of an effort to get to know them. Also rare is the thoughtful discussion about politics with a neighbor that might indicate conformity pressures at work. In the absence of this evidence, they conclude, residential sorting cannot be real. In addition, with the growing importance of online association, some skeptics might contend that physical neighborhood plays a weaker role in constituting one's sense of place. Our experiments mimic the experience of people who make initial assessments about the attractiveness and fittingness of a location from a drive–through collection of passing glances (Bishop 2009, pp. 1–2). We find that people are capable of forming judgments about the political climate of a place with very sparse information. Not only do they formulate impressions of party leaning based on fleeting visual inspection, but these judgments about party composition turn out to be highly relevant to feelings of satisfaction with the neighborhood.
To be sure, not everyone can packup and move just because they are not satisfied with their dwelling place or their neighbors. People undoubtedly tolerate a great deal of unpleasantness about a place in exchange for having a short commute, being closer to family, or having an affordable monthly payment. Although dissatisfaction does not always lead to a move, people who are fully satisfied rarely leave. Some form of dissatisfaction is most likely behind all moves, though that dissatisfaction need not be with the political values of the neighbors, per se.
Just as people choose to uproot themselves as they grow unhappy with some aspect of their neighborhood, they also avoid specific places as they browse the alternatives, ruling some in and some out based on assorted criteria. Our results suggest that the most important aspect of assessing neighborhood fit is the home itself. Homes are not mere residences, but also important statements of self–expression, more so than shops or neighborhood restaurants which may not be patronized frequently. Future work would be wise to examine additional neighborhood features, as our modest experiments surely failed to capture the full range of characteristics scanned by prospective residents. Undoubtedly some characteristics stand out for being negative and repulsive to prospective residents, so sorting into a like–minded area is not solely about the search for desirable attributes. Also important is the relative weight people come to assign some features of a place, rather than others; the cleanliness of a park, or the presence of a nearby golf course. Some potentially unpleasant aspects of a neighborhood, such as a dilapidated liquor store with barred windows, may be discounted in perception, while others, such as a dog park, might be given greater weight.
As we have seen, some features may send unambiguous political signals, regardless of party adherence, while others may be of great clarity to some, whereas less obvious to others. In many cases, only well–informed partisans will be in a position to detect consistently the symbolic meanings present in a locale, suggesting that there is a socialization aspect contingent on learning. And for these individuals, only a few stimuli will be necessary to form valid conclusions. Places have a discernible ambiance, a clientele, and a set of activities that are routinely associated with them (Graham and Gosling 2011, July; Rentfrow and Jokela 2016). People can avoid or choose to reside in these environments and do so according to their assessments of social compatibility, part of which may include political compatibility. A neighborhood presents a collection of scenes that offer a nonverbal advertisement of what kind of person will fit in with the current residents. In turn, a good fit with the local environment is known to promote satisfaction and well–being. At the same time, what might be judged good for an individual might not be constructive for improving intergroup relations (Jokela et al. 2015; Motyl 2016). Physical separation does not promote mutual understanding and accord because rival group members do not share a context and engage in little interpersonal interaction. Geographic distance also lessens empathy and emotional impact.
Although not everyone can act on their neighborhood preferences to live where they want to live, additional research would do well to examine whether the group that is capable of choice is distinct from the group that is not, and in what ways, aside from income. These studies offer promise in determining the extent to which selective migration contributes to the ongoing erosion of politically mixed communities.
Supporting Information
Supporting Information, cico12320-sup-0001 - Political Fit as a Component of Neighborhood Preference and Satisfaction
FIG. A3. Heterogeneous responses among seven Partisan groups to neighborhood stimuli.
Supporting Information, cico12320-sup-0001 for Political Fit as a Component of Neighborhood Preference and Satisfaction by James G. Gimpel and Iris Hui, in City & Community
FIG. A3. Heterogeneous responses among seven Partisan groups to neighborhood stimuli.
Footnotes
Supporting Information
Additional supporting information may be found online in the Supporting Information section at the end of the article.
Notes
Appendix
Descriptive Statistics of CCES Surveys
| 2014 | 2015 | |
|---|---|---|
| % Democrat | 31% | 31% |
| % Republican | 27% | 32% |
| % Independent/other party | 43% | 38% |
| Age (mean/variance) | 47.3/299.6 | 49.3/268.2 |
| % Income <$50k | 47% | 47% |
| % Income $50k–<$100k | 29% | 28% |
| % Income over $100k | 14% | 14% |
| % Income not stated | 11% | 11% |
| % Married | 51% | 50% |
| % White | 76% | 75% |
| % High school or less | 40% | 40% |
| % Some college | 33% | 33% |
| % College or more | 27% | 27% |
| % Male | 48% | 48% |
| % Own home | 60% | 60% |
| % think religion is not important at all | 21% | 20% |
| % think religion is not too important | 16% | 16% |
| % think religion is somewhat important | 23% | 23% |
| % think religion is very important | 40% | 41% |
| Sample size | 1,000 | 1,000 |
Note: Mutually exclusive categories may exceed 100% due to rounding.