
Abstract
We examine theory and evidence on agents in private–market entrepreneurial financings. After controlling for the endogenous issuer–agent matching and a whole host of other controls, the empirical findings in this paper indicate that agents attract more investors, broaden the geographic investor and capital base, and increase the percentage of investors and capital from investors that are more vulnerable to the costs of information asymmetry. We also find that more capable agents generally provide more valuable benefits to private entrepreneurial firm financings than less capable agents, and that increasing the number of agents in a financing further increases value to issuing firms.
“Luckily, Facebook, Groupon and other tech companies have other options—namely, private sources of capital. Companies of all stripes sell debt or equity to private investors. … It's hard to get comprehensive data on private–market placements, but there's no doubt it's a thriving business.”
The Wall Street Journal, January 5, 2011
Introduction
Private entrepreneurial firms need access to capital from outside investors in order to develop, but capital for such firms is often quite scarce due to the high degree of information asymmetry between entrepreneurial firms and outside investors and the difficulties these firms face in developing a network of investors. While it is well established in the literature that a firm can resolve some of these information gaps by attracting financing from a venture capitalist (VC) (e.g., Barry, Muscarella, Peavy, & Vetsuypens, 1990; Brav & Gompers, 1997; Megginson & Weiss, 1991), only a small fraction of developing firms are able to attract VC capital.
In this paper, we test whether private entrepreneurial firms can also mitigate information asymmetries and develop and expand their network of investors by engaging the services of an agent. Several papers in the public equity offerings literature show that agents can help reduce costly information asymmetry (e.g., Beatty & Ritter, 1986; Booth & Smith, 1986; Chaplinsky & Haushalter, 2010; Eckbo & Masulis, 1992). It has further been shown that for private placements by publicly listed companies (private investments in public equity [PIPEs]), an agent helps to develop a firm's network of investors (e.g., Dai, Jo, & Schatzberg, 2010; Huang, Shangguan, & Zhang, 2008). A number of important recent studies also examine factors that affect the ability and success of entrepreneurs to raise external capital (e.g., Bonardo, Paleari, & Vismara, 2011; Brinckmann, Salomo, & Gemuenden, 2011; Serrasqueiro & Nunes, 2012; Wu & Chua, 2012); however, to the best of our knowledge, no study has either documented the presence of agents or examined the role of agents in the private entrepreneurial financing market, even though agent participation in this marketplace has been noted in the press. For example, in late 2010, U.S. investment bank Goldman Sachs helped the private firm Facebook Inc. raise $500 million, and U.S. investment bank Allen & Co helped the private firm Groupon Inc. raise $950 million.
Some recent papers from the public markets have cast doubt on the ability of agents to mitigate adverse selection and asymmetric information costs. For example, in the context of initial public offerings (IPOs), Ritter (2011) criticizes the ability of popular asymmetric information–based models to explain the magnitude of underpricing that is observed, and suggests that the quantitative magnitude of underpricing can be explained with a market structure in which underwriters want to underprice excessively, issuers are focused on services bundled with underwriting rather than on maximizing the offer proceeds, and there is limited competition between underwriters (see also Beatty & Welch, 1996; Cooney, Singh, Carter, & Dark, 2001; Liu & Ritter, 2010, 2011; Loughran & Ritter, 2004; Meoli, Migliorati, Paleari, & Vismara, 2012; Vismara, Paleari, & Ritter, 2012). This misalignment of objectives may be particularly severe in the private entrepreneurial market because these are smaller and younger firms with little bargaining power vis–à–vis potentially powerful agents (Audretsch, Lehmann, & Plummer, 2009; Chahine, Filatotchev, & Zahra, 2011). In addition, the private markets are more informationally opaque and include a different mix of investors than the public markets, and so the mixed findings on the role of agents in the public markets highlight the nonobvious role of agents in the private market. The empirical analysis in this paper is designed to examine whether agents provide value to entrepreneurial firms, an issue which is hitherto unexamined in the literature. 1
Our study uses a novel sample of private financings from Canada during the period April–June 2006, which include investors from Canada, the United States, and internationally. We show that agents provide valuable benefits to private entrepreneurial firms. In particular, our results indicate that agents provide value by increasing: (1) the number of investors in the financing; (2) the percentage of investors and total proceeds from outside an issuer's home jurisdiction; and (3) the percentage of investors and total proceeds from investors that are more vulnerable to the costs of information asymmetry (specifically, passive investors who respond to investment opportunities presented to them in the form of an offering memorandum [OM], as detailed in a subsequent section). Moreover, we show that more capable agents generally provide more valuable benefits than less capable agents, and additional agents in a financing also provide greater value to issuing firms. While we note that agents provide several important functions, such as certification, information production, marketing, and distributional capabilities, this paper mainly focuses on the overall capabilities of agents, in part due to data limitations.
Our empirical analysis also takes into account the endogenous nature of the matching between issuers and agents (Brau & Johnson, 2009). This setup is important because the issuer–agent matching is potentially nonrandom, and failing to control for this endogeneity confounds agent treatment effects with selection effects (see Garen, 1984, 1988; Heckman, 1979), and could lead to incorrect conclusions. After accounting for the issuer–agent matching, we find that our results support the notion that agents provide value in the private entrepreneurial financing market. 2 Furthermore, our results are robust to a whole host of other control variables and subsample tests.
We summarize our main contributions to the literature as follows. We are the first to show that agents are actively involved in the private financing market and to further show that agents provide valuable benefits to entrepreneurial firms by resolving asymmetric information costs and broadening an issuer's investor and capital base. We also introduce new measures that have not been examined in the prior literature, such as the geographic dispersion of the investors and dollar capital invested in private firms relative to the issuer's home jurisdiction. In addition, we are able to discriminate between different types of investors to show that agents provide access to various clienteles of investors.
The remainder of the paper is organized as follows. In the next section, we discuss the related literature and develop our hypotheses. Thereafter, we describe the data and report summary statistics. In the subsequent section, we present multivariate tests of our hypotheses and several robustness tests. The final section provides concluding remarks, discusses some of the limitations of our study, and offers suggestions for further research.
Related Literature and Hypothesis Development
An entrepreneurial firm faces a series of decision points during its development with respect to how it sources its capital. Based on its development strategy, and its requisite need for capital, it may decide to remain private, seek an IPO on a junior equity market, or wait until it has grown to a sufficient size to seek a public listing on a larger exchange. Since the collapse of the stock market following the dot–com meltdown, the market for private capital has become increasingly important in financing the growth of entrepreneurial firms. According to IPO data gathered by Jay Ritter for larger issuers, 3 the average age of a firm completing an IPO rose from 8 years in the period 1990–2000, to 10 years in the period 2001–2012. Comparing the same two periods, the average size of an IPO increased from $78 million to over $257 million. With respect to junior equity market IPOs, Vismara et al. (2012) record a decline in most major European markets. In addition, the number of firms changing from public to private increased significantly over this later time period (see Boot, Goplan, & Thakor, 2008; Renneboog, Simons, & Wright, 2007). The earlier evidence suggests that firms are now carefully evaluating the benefits of going public against the costs, and in many cases, firms are increasingly drawing upon private capital to fuel their growth.
The private entrepreneurial market is characterized by an extremely high degree of information asymmetry. As discussed by Sood (2003), adverse selection costs exist in the private market because entrepreneurs possess more information about their firm, its negative dimensions, and its expected future success than potential outside investors. Moreover, private entrepreneurial firms often lack access to a broad investor network, and thus in the spirit of Myers and Majluf (1984), some good quality firms in the entrepreneurial market are inhibited from raising financing.
In the presence of such information asymmetry, private firms can signal their quality and raise financing by attracting the attention of a VC and agreeing to bonding and monitoring mechanisms developed by that VC (Nahata, 2008). However, VCs are extremely selective with respect to their choice of investee firms, and thus, for the majority of private firms, attaining VC backing is highly unlikely. Therefore, in the absence of attracting a formal investor such as a VC, private firms must rely on alternative financing strategies. One such alternative is for private entrepreneurial firms to engage the services of an agent. In the public equity markets, Booth and Smith (1986), Beatty and Ritter (1986), and Eckbo and Masulis (1992) show that underwriters have some ability and incentive to evaluate the extent to which the issuer's stock may be overpriced, and to avoid selling overpriced shares to the public. Similarly, Carter, Dark, and Singh (1998) find that IPOs underwritten by more reputable underwriters have lower initial underpricing due to a stronger certification effect, and Dong, Michel, and Pandes (2011) find that higher underwriter quality as measured by underwriter reputation and a greater number of managing underwriters leads to better long–run IPO performance.
Furthermore, Dai et al. (2010) examine the pricing of PIPEs by placement agents and find that agent reputation is positively associated with larger offers, lower discounts, and an enhanced post–PIPE trading environment. Also, using a sample of PIPEs, Huang et al. (2008) examine investment banks’ networking function in capital markets and find that investment banks help attract investors, and the stronger the placement agent's networking abilities, then the greater the number of investors who participate in the financings. Moreover, Huang and Zhang (2011) show that investment banks are selectively used by issuers based on their need for access to investors, demonstrating that an important reason for hiring investment banks is their access to networks of investors. Corwin and Schultz (2005) also note that for securities offerings, issuing firms often cite distributional ability as one of the most important factors in selecting managing underwriters. Hsu (2004) further shows that companies care about the identity of the investor, and when faced with multiple offers, companies routinely turn down the investor with the best financial offer in favor of an investor that adds more value in other ways. Finally, Stulz (1999) points out that expanding the shareholder base internationally improves risk sharing, and thereby lowers the cost of capital. Therefore, expanding and broadening the investor base is important for the success of entrepreneurial firms.
On the other hand, a recent strand of the literature from the public markets finds that agents do not necessarily resolve asymmetric information costs. In a well–cited paper, Loughran and Ritter (2004) document a shift in the relationship between underwriter reputation and IPO underpricing whereby hiring a more reputable underwriter leads to greater underpricing. More recently, Liu and Ritter (2011) formalize this empirical finding and show that issuing firms are willing to accept higher underpricing in favor of other side benefits from the underwriters, such as loan tie–ins, industry expertise, side payments to executives, etc. Other papers also document similar findings (e.g., Beatty & Welch, 1996; Brau, 2006, 2012; Cooney et al., 2001; Liu & Ritter, 2010), and in a recent survey paper, Ritter (2011) criticizes the ability of asymmetric information–based models to explain the magnitude of underpricing, especially in certain time periods, such as during the dot–com bubble of 1999–2000.
The evidence from the public equity markets suggests that the role of agents in the private entrepreneurial market is not clear–cut, and to the best of our knowledge, no study has documented either the presence or role of agents in the private entrepreneurial financing market. While the abovementioned literature is largely from the public markets, the private markets are characterized by even greater degrees of information asymmetry and a lack of broad investor participation, since investors must be eligible to participate in the private marketplace based on an exemption from securities law.
4
We should therefore expect the agent effects noted earlier from the public markets, such as certification, information production, marketing, and distributional capabilities, or the alternative inability of agents to mitigate information problems, to be even greater in the private market. Due to data limitations, the empirical tests in this paper are not designed to disentangle these functions. Rather, the empirical design in this paper focuses on the overall capabilities of agents. Therefore, our null hypothesis is that agents do not provide valuable benefits to issuers. Everything else being equal, our alternative nonmutually exclusive hypotheses are as follows:
From the perspective of private entrepreneurial firms increasing the number of investors in the financing, the percentage of investors and proceeds from outside the issuer's home jurisdiction, and the percentage of investors and proceeds from the least SI capture value since increasing and broadening the investor base, and diversifying the investor base beyond the home market and its specific economic conditions, allows these firms to be able to secure future financings, in addition to the current financing. The need for risk sharing and liquidity (possible future sales to existing shareholders) might also lead firms to desire more investors, even while holding proceeds constant. Furthermore, sophisticated individual investors, and in particular institutional investors, have the resources and expertise to screen the quality of private entrepreneurial firms, and so it is generally the least SI, who are more informationally disadvantaged with respect to issuers, that tend to participate less in the private marketplace. Therefore, increased participation in financings from less SI provides another indication that agent support adds value to entrepreneurial firms.
In the private market, there is no requirement for a firm to use an agent, and thus a firm that has employed the services of an agent has made an explicit decision to do so. Moreover, agents are not required to be registered with a securities regulator in Canada, and so there exists a distinction in the capabilities of agents. In particular, agents that are registered with a securities regulator, referred to as brokered agents, service a large number of existing investors and are repeat players, and thus have reputational capital at stake. Thus, we define brokered agents as more capable agents. Agents that are not registered with a securities regulator, referred to as nonbrokered agents, comprise individuals and corporations that are not necessarily repeat players. Thus, we define nonbrokered agents as less capable agents. This distinction allows us to test whether more capable agents provide greater value than less capable agents. 5 Several papers from the public markets literature have also used the number of agents as a measure of marketing, certification, and information production. For example, Huang and Zhang (2011) use the number of managing underwriters as a proxy for marketing activity in their study of the price discount of seasoned equity offerings. Corwin and Schultz (2005) find that the number of managing underwriters is positively related to aftermarket analyst coverage and that offer prices are more likely to be revised and increase in response to information when there are many syndicate members, especially when there are many comanagers. Finally, Bradley, Jordan, and Ritter (2008) show that the number of analysts following an IPO is positively related to underwriter reputation, and Dong et al. (2011) document better long–run IPO performance for IPOs with a greater number of managing underwriters. We therefore also test whether additional agents in private–market financings provide incremental benefits to issuing firms.
Sample Description and Descriptive Statistics
Sample Description
The data in this study are drawn from private firm exemption reports filed with the Alberta Securities Commission (ASC) in Canada between April and July 2006. We use this specific sample jurisdiction and time period for the following two reasons. First, securities regulation for exempt market placements was harmonized across all Canadian jurisdictions on September 14, 2005, so that after this date, we have better access to financings by private companies from across Canada. 6 Second, this is the period over which the ASC allowed us to view their exempt market filings. It is worthwhile to note that comparable data are not widely available in other Canadian jurisdictions, and not available at all from the United States. Therefore, the unique access to data enables us to study the role of agents in the private market for the first time.
While there are U.S. firms that access capital in Canada, we restrict our analyses to Canadian firms only, since U.S. firms in the ASC population provided incomplete information for investors. 7 The U.S. subset of our data comprises only a small fraction of the population, and as such, this exclusion is not material to our analyses. Nevertheless, our sample does include firms from across all of Canada (not only Alberta firms) and complete information on investors in these financings regardless of whether the investors are based in Canada, the United States, or internationally. The data thus comprise information from firms and investors that extend well beyond the borders of Alberta (more than 30% of the issuers and 45% of the investors are from outside Alberta) such that it is not merely an “Alberta–only” study. Interestingly, many of the agents in our private–market sample are well–known agents in the Canadian, United States, and international public markets, suggesting that agents are likely active in the private market in other jurisdictions as well.
The data comprise a total of 561 private firm financings. We exclude 312 financings by nonoperating companies, investment companies, and real estate firms, and further remove 23 financings for which complete investor information is not available. This leaves a final sample of 226 financings by 136 firms, and 5,407 investors that participated in these financings. Our sample includes 148 financings by 93 Alberta–based firms and 78 financings by 43 firms from other Canadian provinces. Therefore, we believe that the results of this study can be generalized to the broader Canadian market and to other jurisdictions with a similar regulatory structure.
The exemption reports are paper–based, and the data were hand–collected and extensively cleaned before use. At the firm level, the reports contain the name, location and contact information of the issuing firm, and also the industry in which the firm operates. At the investor level, the reports contain the name of the investor, the jurisdiction where the investor resides, the number of securities purchased, the price of the security, the total dollar amount purchased by the investor, and the exemption that the investor relies upon. For privacy reasons, the identity of the investors is not retained, but we identify investors as being either an individual or institution, and we document the exemption that investors rely upon, which allows us to determine the quality of the investors in the private marketplace (detailed later). For financings where an agent is involved, the reports provide the names of the agents, their compensation (in cash and/or securities), and the exemption the agent relies upon if securities are received. The nature of the security in the financing is also reported and classified as being either an equity offering (either a common share offering or a flow–through share offering) or a debt offering, and in either case information is also available on whether warrants are attached to the financing.
Our sample of private firms raised a nontrivial $1.4 billion in proceeds during the 4–month period of study (see Table 1 for a list of all the variables used in the paper). In Table 2, we segment the financings by the issuer's industry. Panel A indicates that energy issuers are important in the Canadian private marketplace, making up 46.9% of the financings, but there are also a significant number of financings by technology, industrial, and mining firms. In terms of total proceeds, however, energy firms represent 95.4% of the total. This suggests that issuing firms in the energy industry raise very large amounts of capital, which is consistent with their large capital expenditure requirements.
Variable Definitions

Total Proceeds by the Industry of the Issuer
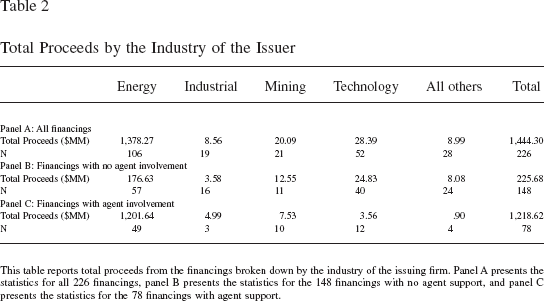
This table reports total proceeds from the financings broken down by the industry of the issuing firm. Panel A presents the statistics for all 226 financings, panel B presents the statistics for the 148 financings with no agent support, and panel C presents the statistics for the 78 financings with agent support.
In panels B and C of Table 2, we segment the financings by agent involvement. Similar to panel A, we find that financings by energy firms represent the largest percentage within the subsamples. Specifically, when no agent is involved (panel B), financings by energy firms represent 38.5% of the sample, and when an agent is involved (panel C), financings by energy firms represent 62.8% of the sample. We note that across all industries, the number of financings with no agent involvement is larger—148 financings when no agent is involved compared with 78 when one or more agents are involved. We find that although there are a greater number of financings when no agent is involved, the total proceeds raised by issuing firms is substantially less compared with when an agent is involved. In particular, agents helped raise $1.2 billion of the $1.4 billion in total proceeds for the full sample, while issuing firms with no agent involvement raised only $225.7 million. Upon closer examination, we find this difference to be mainly driven by the energy industry. Therefore, agents are associated with firms raising large amounts of capital from private financings, and especially those in the energy sector. In the multivariate regressions later, we control for industry effects.
Descriptive Statistics of Investors in the Private Market
Using the approach in Robinson and Cottrell (2007), we characterize investors as either individuals or institutions based on their name, and then place investors into one of four categories based on their financing exemption. For individual investors, the four categories are: OM investors (passive investors who respond to investment opportunities presented to them in the form of an OM—the private market equivalent of a prospectus that is not, however, vetted by the securities regulator); relationship investors (friends, family members, and business associates of the firm's principals); accredited investors (AI) or SI (the exemptions used by angel investors); and all other types of individual investors (a very small category that includes all other exemptions). Institutional investors also rely on the abovementioned exemptions, but the majority of these investors are either accredited or sophisticated. 8
Clearly, the above–identified investors are not homogenous and have varying levels of investment knowledge and expertise. In particular, the individual OM investors are considered the least sophisticated, and the institutional AI or SI investors have the highest level of expertise. In Table 3, we present aggregate descriptive statistics on the 5,407 investors at the investor level to show the types of investors participating in the private marketplace based on agent support versus no agent support, and more capable agent support versus less capable agent support.
Descriptive Statistics Segmented by Investor Type and by Agent Involvement
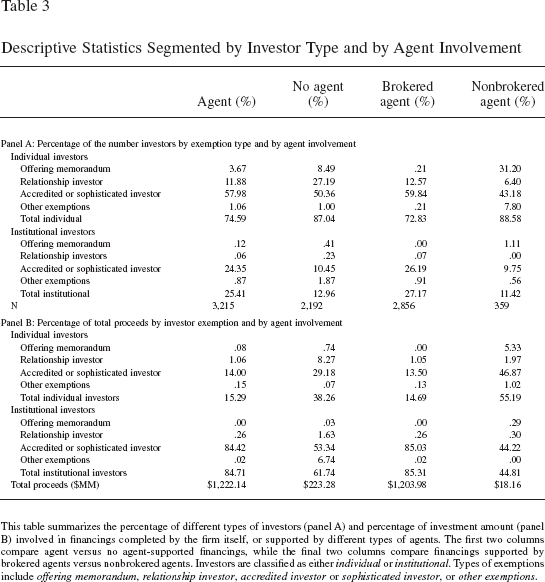
This table summarizes the percentage of different types of investors (panel A) and percentage of investment amount (panel B) involved in financings completed by the firm itself, or supported by different types of agents. The first two columns compare agent versus no agent–supported financings, while the final two columns compare financings supported by brokered agents versus nonbrokered agents. Investors are classified as either individual or institutional. Types of exemptions include offering memorandum, relationship investor, accredited investor or sophisticated investor, or other exemptions.
Focusing on panel A of Table 3, we find that across all financings, when there is an agent involved, 74.6% of investors are individuals and 11.9% are individuals with an existing relationship to the issuing firm. In contrast, when no agent is involved, the percentage of individual investors increases to 87.0%, and 27.2% comprise individual relationship investors. Panel A also indicates that agents are associated with a higher percentage of institutional investors and a higher percentage of the more sophisticated AI or SI investors.
Panel A also provides a comparison of the types of investors associated with brokered versus nonbrokered agent–supported financings. This comparison indicates that the clients of brokered agents are more likely to be sophisticated (AI or SI) individual or institutional investors, while the nonbrokered agents have a client base that includes a high number of unsophisticated individual OM investors.
In panel B of Table 3, we consider the percentage of proceeds provided by individual versus institutional investors segmented by agent involvement and the capability of agents. We find that across all financings with agent support, 15.3% of the proceeds are provided by individual investors, compared with 38.3% for financings with no agent support. Examining the percentage of total proceeds provided by each type of investor based on their level of sophistication, we find a higher percentage of capital from the most sophisticated AI or SI investors with agent–supported financings, while there is a higher percentage of capital from relationship investors across all financings with no agent support. Moreover, when comparing the investors of brokered versus nonbrokered agent financings, we note that the brokered agent financings are mostly associated with capital from institutional AI or SI investors, while the nonbrokered agents are associated with capital mostly from individual and institutional AI or SI investors. In unreported tests, we find that a chi–squared test of the differences in the distributions by exemption type between the agent and nonagent–supported financings, and brokered versus nonbrokered agent–supported financings, reveals statistically significant differences at the 1% level in both panel A and panel B.
The Table 3 results suggest that agents are associated with specific investor clienteles, and the nature of these clients vary between brokered and nonbrokered agents. Therefore, an issuer's choice of whether to use an agent, and the issuer's ability to attract a brokered agent to assist with its financing might affect the type of investor participating in the financing. This further suggests that an issuer's existing investor clientele (from its prior financings) might be an important determinant in the decision to use an agent and/or a specific type of agent in the current financing, issues that we explore in our empirical tests later.
Descriptive Statistics of Issuer Financings
Table 4 reports descriptive statistics at the financing level for the 226 financings. Total proceeds are $6.4 million in mean and $.3 million in median for the full sample, indicating a high degree of positive skewness. The mean and median proceeds are $15.6 million and $1.6 million, respectively, when an agent is involved, and the mean and median proceeds are $1.5 million and $.2 million, respectively, when no agent is involved. These differences are statistically significant in both mean and median, consistent with the notion that agents are associated with larger financings. Since capital requirements are technically not observable, one interpretation is that agents enable more proceeds to be raised, while another interpretation is that agents are simply associated with larger deals. In subsequent empirical tests, we proxy capital requirements by proceeds and control for size and other issuer–specific variables.
Descriptive Statistics of the Financings
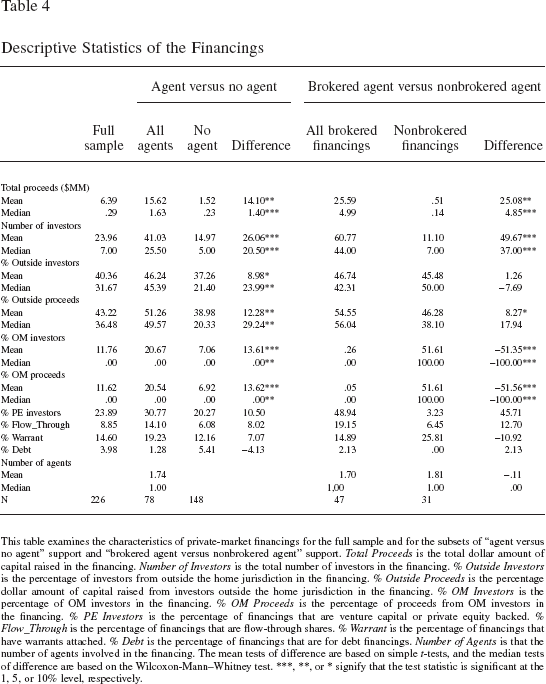
This table examines the characteristics of private–market financings for the full sample and for the subsets of “agent versus no agent” support and “brokered agent versus nonbrokered agent” support. Total Proceeds is the total dollar amount of capital raised in the financing. Number of Investors is the total number of investors in the financing. % Outside Investors is the percentage of investors from outside the home jurisdiction in the financing. % Outside Proceeds is the percentage dollar amount of capital raised from investors outside the home jurisdiction in the financing. % OM Investors is the percentage of OM investors in the financing. % OM Proceeds is the percentage of proceeds from OM investors in the financing. % PE Investors is the percentage of financings that are venture capital or private equity backed. % Flow_Through is the percentage of financings that are flow–through shares. % Warrant is the percentage of financings that have warrants attached. % Debt is the percentage of financings that are for debt financings. Number of Agents is that the number of agents involved in the financing. The mean tests of difference are based on simple t–tests, and the median tests of difference are based on the Wilcoxon–Mann–Whitney test.
signify that the test statistic is significant at the 1
5
10% level, respectively.
To confirm that agent support is not simply a large firm/financing effect, Figure 1 presents a histogram of the proceeds raised in the financings based on agent involvement (panel A) and the capability of agents (panel B). Panel A indicates that some firms are able to raise over $10 million without agent support, while some agent–supported financings raise less than $.25 million. Considering the subsample of agent–only–supported financings in panel B, we observe that nonbrokered agents are mainly involved in financings under $.5 million and only brokered agents are involved in financings over $5.0 million, but there is competition between the two types of agents in financings between $.5 million and $5.0 million.
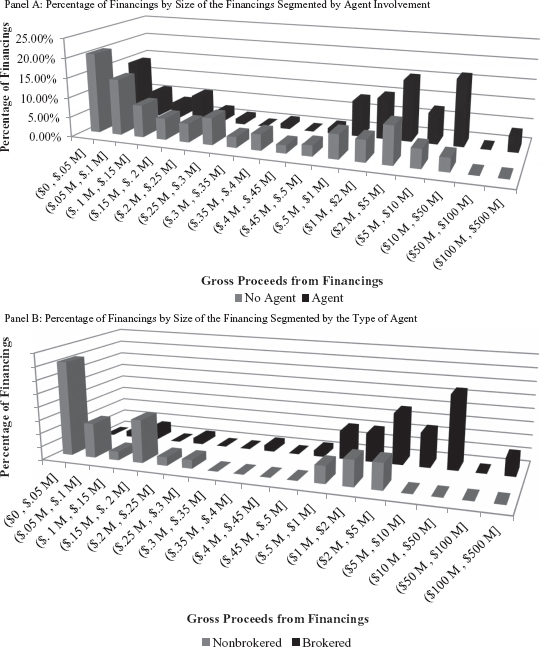
Histogram of Total Proceeds by Issuers Differentiated by Agent Involvement
Table 4 also shows that the average number of investors per financing in the full sample is 24.0, and the median number of investors is 7.0. When we segment the financings into those where an agent is involved and those where no agent is involved, we find significant differences. Specifically, the average number of investors when an agent is involved is 41.0, compared with an average number of investors of 15.0 when no agent is involved. These differences are also found in medians, where the median number of investors is 25.5 when an agent is involved and only 5.0 when no agent is involved. This suggests that agents help issuing firms attract a greater number of investors, which we further explore in our multivariate tests later.
The percentage of investors from outside the issuer's home jurisdiction is 40.4% for the full sample, but we find that the mean percentage of investors from outside the issuer's home jurisdiction is 46.2% when an agent is involved, which is significantly higher than the 37.3% we find when no agent is involved. Similarly, we find that the median percentage of investors from outside the issuer's home jurisdiction is 45.4% when an agent is involved and 21.4% when no agent is involved. We also examine the percentage of proceeds raised from outside the issuer's home jurisdiction. For the full sample, the mean proceeds raised from outside the issuer's home jurisdiction is 43.2%, and the mean proceeds raised from outside the issuer's home jurisdiction is 51.3% when an agent is involved, which is significantly higher than the 39.0% when no agent is involved. The differences in median are even greater and also statistically significant. These results suggest that agents expand the issuer's network of investors by attracting investors and capital from other jurisdictions.
Considering the most informationally disadvantaged OM investors, Table 4 indicates that there are a significantly higher percentage of these investors, which account for a significantly higher percentage of the financing proceeds, if an agent is involved. More specifically, when an agent is involved, the percentage of OM investors is 20.7% in mean and .0% in median, compared with a mean and median percentage of investors of 7.1% and .0%, respectively, when no agent is involved. In terms of proceeds, the mean and median percentage raised from OM investors is 20.5% and 6.9%, respectively, when an agent is involved, compared with a mean and median percentage of 6.9% and .0%, respectively, when no agent is involved. These univariate comparisons suggest that agents help attract investors and capital from investors that are more vulnerable to the costs of information asymmetry.
In addition, for the full sample, almost a quarter of the financings are by firms that are private equity (PE)–backed (where PE includes VC–backed), and 30.8% of the agent–supported financings are PE–backed, compared with 20.3% for financings with no agent support. Table 4 further reports that 8.9% of the financings are made up of flow–through shares, 14.6% of the financings have warrants attached, and 4.0% of the financings are debt offerings. Moreover, agent–supported financings involve more flow–through share offerings and financings in which warrants are attached, and involve fewer debt offerings, consistent with the idea that debt is less sensitive to the costs of information asymmetry (Dessi & Robertson, 2003). We also examine the number of agents in the financings, and find that when an agent is involved, there are on average 1.7 agents, and 1.0 median agents.
In Table 4, we also present descriptive statistics comparing the characteristics of brokered agent (more capable) and nonbrokered agent (less capable) financings. The descriptive statistics indicate that brokered financings are significantly larger than nonbrokered financings. Specifically, we find that total proceeds are $25.6 million in mean and $5.0 million in median for brokered financings, compared with a mean of $.5 million and a median of $.1 million for nonbrokered financings. Furthermore, we find that brokered agents are associated with a significantly greater number of investors in the financings. In particular, the number of investors is 60.8 in mean and 44.0 in median for brokered financings, and 11.1 in mean and 7.0 in median for nonbrokered financings. We do not find a significant difference in the percentage of investors from outside the issuer's home jurisdiction for brokered financings (46.7% in mean and 42.3% in median) compared with nonbrokered financings (45.5% in mean and 50.0% in median). However, we find weak evidence that brokered agents are associated with a greater percentage of proceeds from outside the issuer's home jurisdiction. The mean percentage of proceeds from outside the issuer's home jurisdiction is 54.6% for brokered financings, compared with 46.3% for nonbrokered financings, and this difference is statistically significant. Although this difference is larger in median, with 56.0% of the proceeds coming from outside the issuer's home jurisdiction for brokered financings, compared with only 38.1% for nonbrokered financings, this difference is not statistically significant. We also find that nonbrokered agents attract the highest percentage of OM investors and proceeds from OM investors. In particular, the percentage of OM investors is .26% in mean and .0% in median for brokered agent financings, compared with a mean of 51.61% and a median of 100.0% for nonbrokered agent financings. Similarly, the percentage of proceeds from OM investors is .05% in mean and .0% in median for brokered agent financings, compared with a mean of 51.6% and a median of 100.0% for nonbrokered financings. These differences are consistent with the investor level descriptive statistics in Table 3, which shows that nonbrokered agents mainly provide access to the OM clientele of investors while brokered agents provide greater access to the sophisticated AI or SI clientele of investors. The Table 4 descriptive statistics also indicate that the percentage of PE–backed financings is higher for brokered agent financings (48.9%) compared with nonbrokered agent financings (3.2%). In addition, brokered financings are more likely to involve flow–through shares and debt offerings and less likely to have warrants attached, which may be a signal that they are of higher quality. Finally, Table 4 reports that the number of agents involved in brokered financings (1.7 in mean and 1.0 in median) is about the same as the number of agents in nonbrokered financings (1.8 in mean and 1.0 in median).
Multivariate Analysis
Dependent Variables
In this section, we first consider the nonrandom matching between agents and issuing firms and then examine the determinants of: the number of investors in the financings; the percentage of investors and capital raised from outside the issuer's home jurisdiction in the financings; and the percentage of investors and capital from investors that are the least sophisticated in the financings (see Table 1 for a list of all the variables used in the paper). We also examine the effect of brokered and nonbrokered agent support versus no agent support for each of the abovementioned dependent variables. The final part of this section discusses a number of robustness checks that have been carried out.
Predictor Variables
As our alternative hypotheses address the role that agents serve in the private entrepreneurial financing market, we have four predictor variables based on agent participation in the financings: Agent indicates whether an agent is involved in the financing; Brokered Agent indicates whether at least one of the agents involved in the financing is a registered investment dealer; Nonbrokered indicates that none of the agents in the financing are registered investment dealers; and Ln(1+Agent) is a measure of the number of agents that are involved in the financing. We also include several control variables, which we describe in the regression sections later.
The Matching of Issuer and Agent
The issuer–agent matching might be endogenous, and failing to control for the potential selection bias—that agents select specific types of firms or firms select an agent for specific types of financings—could lead to biased results. To control for this endogeneity, we use a treatment regression, analogous to the Heckman (1979) two–stage estimation method. In the first stage, we estimate a probit regression where the dependent variable is an indicator variable equal to one for agent–supported financings, and zero for financings with no agent support. We also estimate a probit regression as a function of agent capability, where the dependent variable is an indicator variable equal to one for brokered financings, and zero for nonbrokered financings.
We include a whole host of instruments and controls, including industry and time effects, in addition to the type of security in the current financing. Importantly, there are specific control variables that are included in the regressions in Table 5 that are excluded from the regressions in the subsequent tables, such as Ln(Prior Proceeds), Number of Prior Financings, Number of Prior Agent Financings, % Prior PE Proceeds, % Prior Outside Proceeds, and % Prior INST–AISI Proceeds. These variables measure the experience of the issuer: with raising capital in prior financings; with respect to using an agent; in attracting capital from PE investors; in attracting capital from outside the issuer's home jurisdiction; and in attracting capital from sophisticated institutional investors. We use a complete set of variables without introducing bias from collinearity for the full sample of 226 observations (Model 1), and we use a more condensed model to avoid estimation bias for the subset of 78 agent–supported financings (Model 2). 9
The Matching of Issuers and Agents
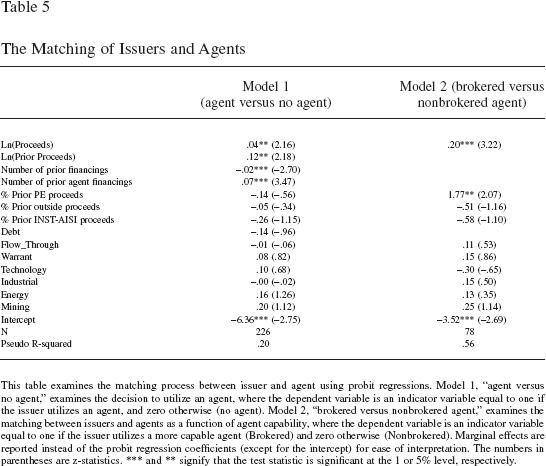
This table examines the matching process between issuer and agent using probit regressions. Model 1, “agent versus no agent,” examines the decision to utilize an agent, where the dependent variable is an indicator variable equal to one if the issuer utilizes an agent, and zero otherwise (no agent). Model 2, “brokered versus nonbrokered agent,” examines the matching between issuers and agents as a function of agent capability, where the dependent variable is an indicator variable equal to one if the issuer utilizes a more capable agent (Brokered) and zero otherwise (Nonbrokered). Marginal effects are reported instead of the probit regression coefficients (except for the intercept) for ease of interpretation. The numbers in parentheses are z–statistics.
signify that the test statistic is significant at the 1
5% level, respectively.
Table 5 presents the first–stage probit regression results. Models 1 and 2 report the results for agent versus no agent support, and brokered agent versus nonbrokered agent support, respectively. Both models indicate a positive and statistically significant coefficient on Ln(Proceeds), which says that larger financings increase the likelihood of agent support (Model 1) and brokered agent support (Model 2). Intuitively, interpreting Ln(Proceeds) as a proxy for project size suggests that firms raising capital for larger projects are more likely to use an agent. Also, Model 1 indicates a positive and statistically significant coefficient on the issuer's proceeds from its prior financing (Ln(Prior Proceeds)). Interpreting Ln(Prior Proceeds) as a proxy for firm size, this says that larger firms are more likely to use an agent. The coefficient on Number of Prior Financings is negative and significant at the 1% level, which is consistent with the expectation that firms with prior positive experience raising capital have less need for agent support. The coefficient on Number of Prior Agent Financings is positive and statistically significant at the 1% level in Model 1, indicating that prior agent support increases the likelihood of hiring an agent in the current financing. In Model 2, the results indicate that the percentage of prior proceeds from PE investors (% Prior PE Proceeds) provides incremental explanatory power for predicting the likelihood of hiring a brokered agent versus a nonbrokered agent. The other independent variables and instruments are statistically insignificant in both models.
While prior experience with being an issuer affects whether or not the issuer wants to use an agent, and a specific type of agent, prior experience with being an issuer does not necessarily directly cause the outcome variables of interest in the subsequent tables, such as the number of investors, the percentage of investors and proceeds from outside the issuer's home jurisdiction, and the percentage of investors and proceeds from more informationally sensitive investors. To confirm this fact, we create a correlation matrix of all dependent, explanatory, and instrumental variables in the data (available upon request). The correlation matrix indicates that all of these instruments are significantly correlated with the use of an agent and the use of a brokered agent, but are not significantly correlated with the outcome variables of interest.
In sum, our results indicate that issuing firms are more likely to use an agent when they are larger and seeking a greater dollar amount of capital for potentially large investment projects. We control for this endogeneity by computing the inverse Mills ratio (IMR) from the Table 5 probit regressions, and including this endogeneity control as an additional independent variable in our multivariate analysis. 10
The Number of Investors
As noted earlier, increasing the number of investors is important to private entrepreneurial firms because of the need for future capital, in addition to the current financing. Therefore, in this subsection, we test whether financings with agent support are able to attract a greater number of investors. As before, we also test whether more capable agents (brokered agents) are able to attract a greater number of investors to the financing than less capable agents (nonbrokered agents), and whether having more agents in a financing also increases the number of investors participating in the financing. We estimate count–based maximum likelihood regression models of the number of investors in the financing. The Poisson regression is inappropriate for our data because the number of investors is overdispersed, and we therefore use the preferred negative binomial regression, following Eisenberg, Sundgren, and Wells (1998). In unreported tests, we also estimate Poisson regression models, and our results remain qualitatively the same. As a further robustness check, in unreported tests, we also use ordinary least squares (OLS) models to check for differences, and the results are not materially different.
Table 6 reports the regression results. In Model 1, the coefficient on Agent is positive and highly significant, and indicates that agent support increases the number of investors in the financing by 4.31. A change of 4.31 is highly economically significant in view of the fact that the average (median) number of investors is 14.97 (5.00) when there is no agent involved (Table 4). Restricting our analysis to only agent–supported financings, in Model 2, we examine the effect of more capable agents and find that the coefficient on the brokered agent dummy (Brokered) is positive and significant at the 10% level, and the economic significance is greater with a coefficient of 8.51. In Model 3, we also examine whether having a greater number of agents in the financing leads to greater investor participation. Our variable of interest is Ln(1+Agent), which has a positive and highly significant coefficient, indicating that the first agent increases the number of investors by 3.5 (= ln(1 + 1)*5.11), while the second agent increases the number of investors by 2.1, and the third agent increases the number of investors by 1.5, and so on, at a diminishing rate. In each model, we find the coefficient on Ln(Proceeds) to be positive and statistically significant. If we take Ln(Proceeds) to be a proxy for project size or capital requirements, this results suggests that financings for larger investment projects or by larger firms attract a greater number of investors. We also find the coefficient on PE Investor to be negative in each model, and statistically significant only in Models 1 and 3, indicating that previous PE backing leads to a lower number of investors participating in the financing. This is perhaps due to control considerations on the part of these formal investors.
Maximum Likelihood Negative Binomial Regressions of the Number of Investors

This table examines the quality of agent services defined as the number of investors (Number of Investors) in the financing. We report maximum likelihood negative binomial regressions of the number of investors in the financing on agent support, agent capability, and control variables. A likelihood ratio test of the hypothesis that α (the overdispersion parameter) = 0 verifies the appropriateness of the negative binomial models. In each model, the probability that we would observe these data conditional on α = 0 (conditional on the process being Poisson) is less than .0001. The negative binomial regression therefore appears to be better suited than the Poisson regression. Marginal effects are reported instead of the negative binomial regression coefficients (except for the intercept) for ease of interpretation. The numbers in parentheses are z–statistics.
signify that the test statistic is significant at the 1
5
10% level, respectively.
In sum, the results in this subsection provide support for hypotheses 1a, 2a, and 3a by showing that agents provide value to private entrepreneurial firms by attracting more investors to financings, and this effect is more pronounced when a more capable agent is involved. The results also show that having more agents in financing increases investor participation.
The Percentage of Investors and Total Proceeds from outside the Issuer's Home Jurisdiction
As noted earlier, broadening the investor base can help a firm secure future financings, and diversifying the investor base beyond the home market—and its specific economic conditions—is important in this regard. The ability of an agent to help a firm attract outside investors is examined in Table 7.
Two–Step Treatment and OLS Regressions of the Percentage of Investors and Proceeds From Outside the Issuing Firm's Home Jurisdiction
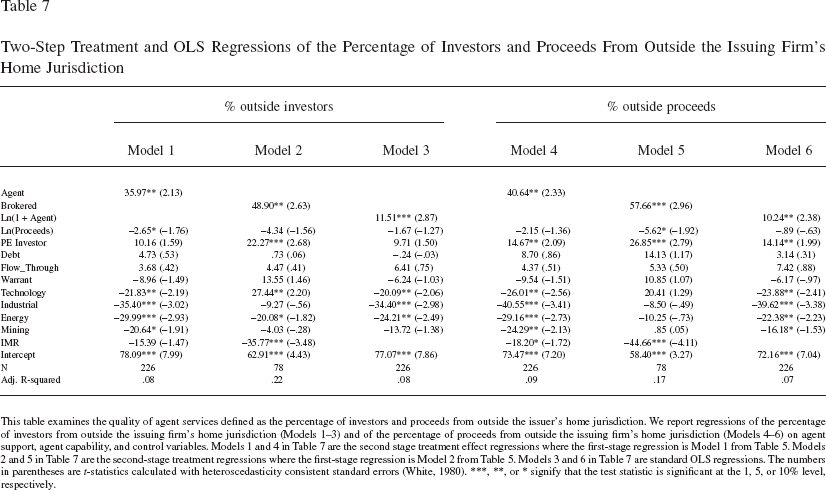
This table examines the quality of agent services defined as the percentage of investors and proceeds from outside the issuer's home jurisdiction. We report regressions of the percentage of investors from outside the issuing firm's home jurisdiction (Models 1–3) and of the percentage of proceeds from outside the issuing firm's home jurisdiction (Models 4–6) on agent support, agent capability, and control variables. Models 1 and 4 in Table 7 are the second stage treatment effect regressions where the first–stage regression is Model 1 from Table 5. Models 2 and 5 in Table 7 are the second–stage treatment regressions where the first–stage regression is Model 2 from Table 5. Models 3 and 6 in Table 7 are standard OLS regressions. The numbers in parentheses are t–statistics calculated with heteroscedasticity consistent standard errors (White, 1980).
signify that the test statistic is significant at the 1
5
10% level, respectively.
In Models 1–3, the dependent variable is the percentage of investors from outside the issuing firm's home jurisdiction. The independent variables are the same as in Table 6. Focusing on Model 1, we find a significantly positive coefficient on Agent, which says that agents increase the percentage of investors from outside the issuer's home jurisdiction by 36.0% relative to financings with no agent involvement, holding all else constant. We find the coefficient on our endogeneity control, IMR, to be negative but insignificant, implying that selection is not a problem. In Model 2, we examine whether more capable agents are able to attract a greater percentage of investors from outside the issuer's home jurisdiction. The coefficient on Brokered is positive and highly significant, suggesting that more capable agents can increase the percentage of outside investors by 48.9% relative to the less capable nonbrokered agents. This indicates that more capable agents provide greater access to investors from outside the issuer's home jurisdiction. We find the coefficient on the IMR to be negative and statistically significant, which points to a selection effect. However, the significance on Brokered implies that there is incremental value provided by agents beyond selection. In Model 2, we also find the coefficient on PE Investor to be positive and statistically significant, which suggests that PE–backed issuers attract a greater percentage of investors from outside the issuer's home jurisdiction. This is consistent with value also being provided by these formal investors, which does not explain away the benefits provided by agents, and thus implying a complementary relationship. In Model 3 of Table 6, the independent variable of interest is Ln(1+Agent), and we find that it has a positive and highly significant coefficient, consistent with more agents providing access to a greater network of investors, with the economic significance at 8.0% (= ln(1 + 1)*11.51) for the first agent, 4.7% for the second agent, 3.3% for the third agent, and so on at a diminishing rate.
In Models 4–6 of Table 7, the dependent variable is the percentage of proceeds raised from outside the issuing firm's home jurisdiction. We include the same independent variables from above and find strong evidence that agent support leads to a larger percentage of proceeds from outside the issuer's home jurisdiction. Specifically, in Model 4, we find the coefficient on Agent to be positive and statistically significant, so that agents can help raise 40.6% more capital from outside the issuer's home jurisdiction compared with when there is no agent involved. Model 5 provides further insight into the more capable effect of agents where we find a positive and statistically significant coefficient on Brokered, indicating that more capable agents attract 57.7% more in proceeds from outside the issuer's home jurisdiction compared with when a less capable nonbrokered agent is involved. In both Models 4 and 5, the coefficient on the IMR is significantly negative, indicating that unobserved characteristics that increase the likelihood of employing an agent (Model 4) or a brokered agent (Model 5) reduces the percentage of proceeds from outside the issuer's home jurisdiction. However, this selection effect does not explain away the main treatment effects. In Model 6, we test whether having more agents in a financing leads to a greater percentage of proceeds raised from outside the issuing firm's home jurisdiction. The independent variable of interest is Ln(1+Agent), which is positive and statistically significant, and says that a greater number of agents attracts a greater percentage of proceeds from outside the issuer's home jurisdiction, with the economic significance at 7.1% (= ln(1 + 1)*10.24) for the first agent, 4.2% for the second agent, 2.9% for the third agent, and so on at a diminishing rate. We also find the coefficient on PE Investor to be positive and statistically significant in Models 4–6, indicating that PE–backed issuers are able to attract a greater percentage of proceeds from outside their home jurisdiction. While this is consistent with PE investors also providing valuable benefits to issuers, it does not explain away the value provided by agents.
Overall, the results in Table 7 provide support for hypotheses 1b–1c, 2b–2c, and 3b–3c by showing that agents provide value by expanding the investor base and capital base beyond the issuer's home jurisdiction, and this effect is more pronounced for more capable agents and when additional agents are involved in the financing.
The Percentage of Investors and Capital from Investors that are the Least Sophisticated
In this subsection, we use a multivariate framework to examine whether agents increase the percentage of investors and proceeds from investors that are more vulnerable to the costs of information asymmetry. In the private marketplace, investors that rely on the OM exemption are generally less sophisticated because they do not meet the accredited or SI threshold. Therefore, resolving asymmetric information costs implies that agents should increase the percentage of investors and proceeds from the most informationally sensitive investors, and we should see agent support lead to a higher percentage of investors and proceeds from investors that rely on the OM exemption.
In Models 1–3 of Table 8, the dependent variable is the percentage of OM investors in the financing. In Model 1, we find a statistically significant coefficient on the agent dummy, Agent, which says that agent support increases the percentage of OM Investors by 30.8%. We further examine the effect of more capable agents in Model 2, where we include the brokered agent dummy variable, Brokered. Interestingly, we find the coefficient on Brokered to be insignificant, suggesting that more capable agents do not increase the percentage of informationally sensitive OM investors when compared with nonbrokered agents. This is perhaps due to the fact that brokered agents’ main clientele appear to be accredited or SI, as indicated in Table 3. One alternative explanation is that issuing firms might be willing to accept lower direct benefits from brokered agents if they are receiving other side benefits in the spirit of Liu and Ritter (2011). For example, brokered agents might provide industry expertise, loan tie–ins, or side payments to the entrepreneurs or managers of these private entrepreneurial firms. A second alternative explanation is that nonbrokered agents might be taking on riskier financings to increase their market share, and these financings might tend to have a higher percentage of OM investors because the more sophisticated investors are less inclined to participate.
Two–Step Treatment and OLS Regressions of the Percentage of Investors and Proceeds From the Least Sophisticated Investors
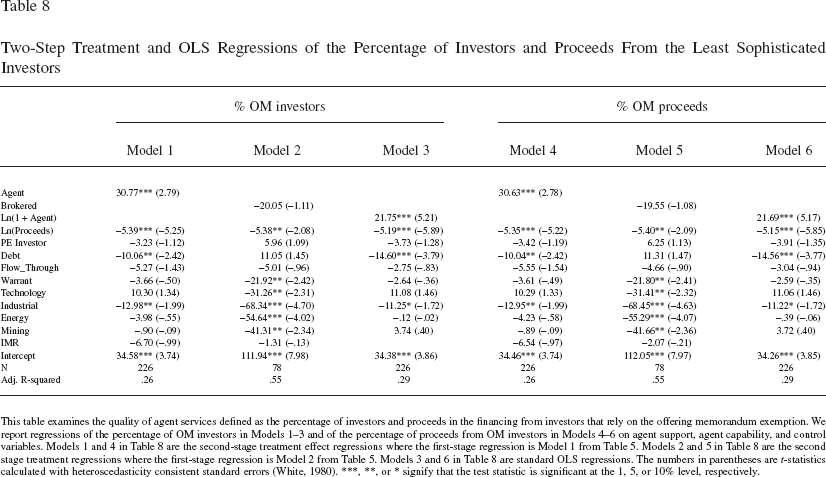
This table examines the quality of agent services defined as the percentage of investors and proceeds in the financing from investors that rely on the offering memorandum exemption. We report regressions of the percentage of OM investors in Models 1–3 and of the percentage of proceeds from OM investors in Models 4–6 on agent support, agent capability, and control variables. Models 1 and 4 in Table 8 are the second–stage treatment effect regressions where the first–stage regression is Model 1 from Table 5. Models 2 and 5 in Table 8 are the second stage treatment regressions where the first–stage regression is Model 2 from Table 5. Models 3 and 6 in Table 8 are standard OLS regressions. The numbers in parentheses are t–statistics calculated with heteroscedasticity consistent standard errors (White, 1980).
signify that the test statistic is significant at the 1
5
10% level, respectively.
In Model 3, we find the coefficient on Ln(1+Agent) to be highly positive and significant, with an economic significance of 15.1% (= ln(1 + 1)*21.75) for the first agent, 8.8% for the second agent, 6.3% for the third agent, and so on at a diminishing rate. In Models 1–3, we find the coefficient on Ln(Proceeds) to be significantly negative, which says that larger project size or larger capital requirements is associated with a smaller percentage of OM investors. Moreover, the coefficient on our selection control in Models 1 and 2, IMR, is insignificant.
In Models 4–6 of Table 8, we test whether agent support predicts a greater percentage of proceeds from OM investors in the financing. These results are qualitatively the same as in Models 1–3 for the percentage of OM investors. In particular, agent support leads to a 30.6% increase in the percentage of proceeds from OM investors compared with financings with no agent support (Model 4). We do not find a significant relation between brokered agent support and the percentage of proceeds from OM investors relative to nonbrokered agents (Model 5). This lack of significance is again potentially due to the clientele effect or due to the two alternative explanations discussed earlier. In Model 6, we examine whether the number of agents in the financing predicts the percentage of proceeds from OM investors. We find the coefficient on Ln(1 + Agent) to be positive and highly significant, and the economic significance nearly identical to that in Model 3.
To summarize, the Table 8 results are consistent with hypothesis 1d–1e, indicating that agents are able to attract a greater percentage of investors and proceeds from OM investors that are more vulnerable to the costs of information asymmetry. The Table 8 results also provide support for hypotheses 3d–3e by showing that additional agents in a financing increase the percentage of investors and proceeds from OM investors. The results, however, do not provide strong support for hypotheses 2d–2e, suggesting that more capable agents do not increase the percentage of investors and proceeds from investors that are more vulnerable to the costs of information asymmetry relative to less capable agents.
Brokered and Nonbrokered Agents versus No Agent
The regression results up to this point compared the benefits provided by agents relative to no agents, and brokered agents relative to nonbrokered agents. In this subsection, we now consider the benefits provided by nonbrokered agents relative to no agent support, and the benefits provided by brokered agents relative to no agent support. In Table 9, we present regression results for each of our quality measures. Treatment regressions are reported for the dependent variables % Outside Proceeds and % OM Proceeds, and a maximum likelihood negative binomial regression is reported for the dependent variable Number of Investors. In this section, the nonbrokered agent dummy variable, Nonbrokered, takes on a value of one for financings with nonbrokered agent support, and zero for financings with no agent support, so that we are comparing nonbrokered financings to financings with no agents on a restricted sample of 179 financings. Similarly, the brokered agent dummy variable in this subsection, Brokered, takes on a value of one for financings with brokered agent support, and zero for financings with no agent support, so that we are comparing brokered financings to financings with no agents on a restricted sample of 195 financings. To compute the appropriate IMR, the first–stage probit regressions are also run on the respective conditional samples, which are not reported for brevity, but are analogous to Model 1 in Table 5.
Regressions of the Quality of Services by Nonbrokered Agents and Brokered Agents Relative to No Agent Support
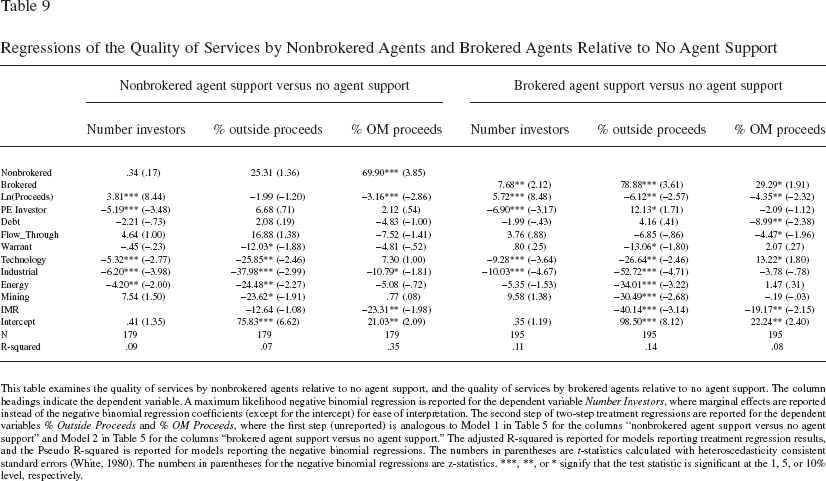
This table examines the quality of services by nonbrokered agents relative to no agent support, and the quality of services by brokered agents relative to no agent support. The column headings indicate the dependent variable. A maximum likelihood negative binomial regression is reported for the dependent variable Number Investors, where marginal effects are reported instead of the negative binomial regression coefficients (except for the intercept) for ease of interpretation. The second step of two–step treatment regressions are reported for the dependent variables % Outside Proceeds and % OM Proceeds, where the first step (unreported) is analogous to Model 1 in Table 5 for the columns “nonbrokered agent support versus no agent support” and Model 2 in Table 5 for the columns “brokered agent support versus no agent support.” The adjusted R–squared is reported for models reporting treatment regression results, and the Pseudo R–squared is reported for models reporting the negative binomial regressions. The numbers in parentheses are t–statistics calculated with heteroscedasticity consistent standard errors (White, 1980). The numbers in parentheses for the negative binomial regressions are z–statistics.
signify that the test statistic is significant at the 1
5
10% level, respectively.
Interestingly, we find the coefficient on Nonbrokered to be insignificant in the negative binomial regression for the dependent variable Number of Investors, as well as the OLS regression for % Outside Proceeds. This suggests that nonbrokered agents do not add value by attracting more investors or a greater percentage of investors and capital from outside the issuer's home jurisdiction. However, we do find a highly and statistically significant positive coefficient on Nonbrokered in the regression for % OM Proceeds, which is consistent with a valuable benefit provided by nonbrokered agents. Specifically, nonbrokered agents increase the percentage of proceeds from the more informationally sensitive OM investors by 69.9% compared with no agent support. Therefore, the results suggest that nonbrokered agents provide value along at least one dimension, and the descriptive statistics in Table 3 indicate that nonbrokered agents are aware of this fact and have a significant presence in this segment of the market (within the financings with nonbrokered agent support, 31.2% comprise the individual OM investors, while within financings with no agent support, 8.5% comprise the individual OM investors, and within financings with brokered agent support, .2% comprise the individual OM investors). This dimension could be important if issuing firms require additional financing but have exhausted their investor network, such that nonbrokered agents provide access to this “last–resort” financing. Anecdotally, conversations with private market participants have indicated that nonbrokered agents play this vital role in the private marketplace. We also find varying significance on other control variables in the regressions, depending on the model, but they do not explain away our main results.
In the brokered agent versus no agent support columns in Table 9, we examine the benefits provided by brokered agent support relative to no agent support. For each of the regressions, we find the coefficient on Brokered to be positive and statistically significant. The economic significance shows brokered agents increase the number of investors by 7.68, the percentage of proceeds from outside the issuer's home jurisdiction by 78.9%, and the percentage of proceeds from OM investors by 29.3%. While the endogeneity control, IMR, is also significantly negative in each of the regressions, it does not explain away the main results that brokered agents provide value. We also find other control variables to be significant, depending on the specification, but these also do not explain away our main finding that more capable agents provide value.
Overall, based on the Table 9 results, we conclude that within the agent types, nonbrokered agents appear to add value mainly by increasing the percentage of proceeds from investors that are more vulnerable to the costs of information asymmetry. We note that issuing firms might also employ a nonbrokered agent if other side benefits are important (see Liu & Ritter, 2011), or because nonbrokered agents provide “last–resort” financing, although we do not confirm this conjecture in this study. Our results for brokered agents, however, clearly demonstrate value added for each of our dependent variables.
Additional Robustness Checks
We carried out a number of additional tests, which are not reported for brevity, but are available upon request. First, we repeat the multivariate analyses on the subsample of non–Alberta–based firm financings to ensure that our findings are not specific to Alberta. Consistent with our overall sample results, we find that among non–Alberta–based firm financings, agents generally help issuers attract a greater number of investors, attract a greater number of investors and capital from outside the issuer's home jurisdiction, and attract a greater percentage of investors and capital from investors that are more vulnerable to the costs of information asymmetry. These results continue to be more pronounced for more capable agents, and additional agents also provide greater benefits. This suggests that our findings generally reflect the entire Canadian marketplace.
Second, the Table 2 statistics show that a large proportion of the financings are by energy sector issuers. To ensure that our results are not being driven by financings from energy firms, we also repeat the multivariate analyses on the subsample of nonenergy sector firm financings. We find that these subsample results hold up well, especially in light of the reduced sample size. In particular, we find that agent involvement in nonenergy firm financings again leads to greater investor participation, a greater number of investors and capital from outside the issuer's home jurisdiction, and a greater percentage of investors and capital from the most informationally sensitive investors. These results are also more pronounced for more capable agents, and additional agents continue to provide more benefits.
Finally, as an additional control for endogeneity and a potential selection bias, we repeat our multivariate analyses on a subsample of issuers that completed financings both with and without agent involvement within the sample period. The subsample results are qualitatively the same as the full sample results, providing further assurance that selection bias is not a problem.
Conclusions, Limitations, and Possible Extensions
Using a novel sample of exempt market filings from the ASC in Canada, this study for the first time examines the role of agents in the private entrepreneurial financing market. While there are several different types of agents operating in this market, we note that a large number are major investment dealers from Canada, the United States, and internationally.
The decision about whether to go public, and on what type of market, is a critical one for a firm. We do not explore the IPO timing decision in the current paper, but rather seek to understand a firm's decision to either retain an agent or not, given that the firm has decided to remain private. The results of this paper support the idea that agents provide a valuable service to private entrepreneurial firms. Our univariate analysis indicates that agents are active participants in the private financing market, and that agent–supported financings are much larger than nonagent–supported financings. In addition, we find that different types of agents (segmented by their capability: brokered versus nonbrokered) appear to have different clienteles of investors. To gain further insight into the private market, we conduct a series of multivariate regressions. First, we find that agent support significantly increases the number of investors in a financing. Second, we show that agents help attract significantly more investors and investment capital from outside an issuing firm's home jurisdiction. Third, we show that agent support attracts a higher percentage of investors and proceeds from the most informationally disadvantaged investors with respect to the issuer. Our results further show that more capable agents generally provide higher quality services than less capable agents, and that more agents in a financing provides greater value.
A further interesting result in the paper is that PE–backed (where PE–backed includes VC–backed) financings involve fewer investors, possibly due to control restrictions imposed by the PE investor, but these financings involve a higher percentage of investors and proceeds from outside the issuer's jurisdiction. This effect is in addition to any value added by an agent, suggesting that PE investors and agents provide complementary benefits to private entrepreneurial firms.
The results of our study have important implications for academics, practitioners, and policy makers. Because capital for smaller private firms is often quite scarce, our results imply that firms can access a broader network of investors and capital by engaging an agent and/or several agents. In addition, attracting a more capable agent provides even greater access to a broader network of investors and capital. For policy makers, the results suggest that efforts to encourage agents, especially registered brokers, to provide services in the private entrepreneurial capital market will increase the capacity of private entrepreneurial firms to access much–needed development capital.
The data in this study allow us to examine private firms solely by observing their financing behavior, and data limitations therefore inhibit us from identifying firm–specific characteristics, such a firm age, firm size, use of proceeds, etc. Data limitations also inhibit us from developing agent–specific measures, and hence, we are unable to disentangle the specific functions of agents. However, we nevertheless believe that this paper is a first step toward understanding the role of agents in the private marketplace. Thus, while we cannot disentangle the specific benefits that agents provide to entrepreneurial firms in the private market, our results are consistent with agents providing overall value to entrepreneurial firms.
A further constraint in this study is the limited time period over which we were granted access to the private financings. While the 4–month sample period allowed us to perform a cross–sectional analysis of agent support in the private entrepreneurial market, we hope in the future to be able to access a time series of private firm financings. The time series data would allow us to examine whether there is an optimal time in a firm's development to engage the services of an agent, and whether early support from an agent helps a firm develop more quickly and achieve a competitive advantage over other firms in its industry. In addition, a time series of data may help yield insights into the firm's decision about when to seek a public listing as opposed to continuing to raise capital in the private market. Relatedly, rather than staying private and raising private–market financing, entrepreneurial firms can also list on a secondary public market, such as the TSX–V or a European second market (see Pandes & Robinson, 2013; Vismara et al., 2012). The aim of these markets is to limit listing costs, and to provide small and young firms with alternative financing opportunities. While the choice to stay private or go public on a second market to raise financing is an interesting research question, this study does not address this issue.
Footnotes
1
Rather than staying private and raising private–market financing, entrepreneurial firms can also list on a secondary public market, such as the Toronto Venture Stock Exchange (TSX–V) or a European second market (see Pandes & Robinson, 2013; Vismara et al., 2012), which tend to have low listing costs. While a comparison of these alternative financing choices is an interesting research question, it is not examined in this paper.
2
Another type of selection bias is that the presence of agents might lead to selection into entrepreneurial activities and intended venture growth. This issue is beyond the scope of our paper, but could be examined in follow–up work. Related work on this topic includes Wu and Knott (2006), Nanda (2008), Folts, Delmar, and Wennberg (2010), Nanda and Rhodes–Kropf (2010), Nanda and Sorensen (2010).
3
Source: http://bear.warrington.ufl.edu/ritter/IPOStatistics.pdf, Tables 4 and ![]() .
.
4
In our sample, the security offerings are exempt from the registration requirements of Alberta's securities laws because the investors are able to use one of the prescribed exemptions under National Instrument 45–106 (discussed later in more detail). In the United States, a discussion of financing exemptions is outlined in a document entitled “Small Business and the SEC,” which is available at the following website: ![]() .
.
5
We also try other measures of agent capability. Specifically, we construct a measure based on the league tables from the public market because several of the agents in the public markets are active in the private financing market. Our results remain robust to this alternative measure, and thus we do not report these alternative results for brevity.
6
More specifically, National Instrument 45–106 (NI 45–106) was adopted on September 14, 2005. Since securities laws are provincially regulated in Canada, no one regulator covers all of Canada, but the provincial laws share some similarities and for exempt market financings the provinces have adopted this national standard.
7
The ASC only requires a firm to file an exemption report if it raises capital in Alberta and only requires the firm to disclose information about Alberta purchasers; however, in the majority of our sample the Canadian issuers report information about investors from all jurisdictions, not only Alberta.
8
The Canadian definition of an accredited investor under NI 45–106 is very similar to the U.S. accredited investor definition under Rule 501 of SEC Regulation D. Specifically, in both countries, accredited investors include financial institutions, pension funds, and entities with at least $5 million in assets; or individuals who alone or with their spouse have assets exceeding $1 million or who have had individual income exceeding $200,000, or $300,000 in combination with their spouse, in the 2 most recent years.
9
We also gathered several other instruments but report only the most parsimonious models that have the best explanatory power.
10
The only case where we do not present the IMR is in the maximum likelihood negative binomial regression models for a count dependent variable (the number of investors) because IMR specifications are not defined for such models.