
Abstract

We respond here to two Commentaries regarding our article (Lindsey & Brown, 2002) on the relationship worldwide between color names and ultraviolet-B (UV-B) insolation. Before addressing the specific issues raised in those Commentaries, we review the central thesis we advanced in that report.
In a study of the published literature on color naming in world languages, we reported that languages spoken in the tropics, where the annual dose of UV-B radiation from sunlight is high, tend to lack a distinct word for “blue.” 1 Instead, they use a single basic color term (BCT) that means green-or-blue (called “grue” here and in the literature) or that means green-or-blue-or-black. We argued that this clearly cultural phenomenon depends at least in part on color appearance, which in turn is constrained by the physiology of the visual system. We suggested that this tendency to lack a distinct word for “blue” may be partly due to environmental damage to the eyesight of the speakers of the languages in question. We investigated whether this damage could be due to the phototoxic effects of the ultraviolet radiation from sunlight, which can damage the retina (acquired tritan defect) and cause the ocular lens to turn brown (brunescence). A laboratory-based “virtual reality” experiment showed that young English speakers, when viewing colorimetrically adjusted stimuli that quantitatively simulated the appearance of the stimulus and its immediately surrounding environment as if viewed through a deeply brunescent ocular lens, tended to use the words “green” or “gray” for colors they would normally call “blue” or “purple.” Thus, damage to the ocular lens, if it is severe enough, would be sufficient to explain the lack of “blue” in many tropical languages. We did not examine in detail other phototoxic effects on the eye, or other possible environmental insults to vision that might also correlate with latitude, so it is not possible to apportion the putative causes of ocular damage among these alternatives.
REPLY TO LAZAR-MEYN
Lazar-Meyn proposes the Celtic languages as counterexamples to the trend we discussed, as they have a word for “grue,” and they are spoken in the British Isles, a low-UV-B locality. We are always interested in learning more about the color lexicons of world languages, and we welcome her Commentary, but the presence of “grue” in the Celtic languages does not undermine our argument. Our result was based on an analysis of 203 languages, not chosen by us. It cannot be refuted by a modest number of selected counterexamples. Notice that even at the lowest UV-B dose in our graph, only 64% of the languages in our sample had a word for “blue”; a few more or less would not make much difference. In our original analysis, the relation between UV-B and the presence of a word for “blue” showed a log-linear likelihood ratio of 37 (the article reported “27”; the typo was our fault). When we add Scottish, Welsh, Irish, and Manx as “grue” languages, the likelihood ratio is 32 (df=6, p<.0001). So, although the Celtic languages are cited to challenge our analysis, and although including them in the analysis would be hard to justify on statistical grounds, including them has little statistical effect on our result. Because the effects of UV-B on color naming are undoubtedly probabilistic, we expect that additional counterexamples will be found, and such counterexamples may well include languages that are spoken near the equator and have a BCT for “blue.” As is often the case in the social sciences and epidemiology, there are many other factors at work here, so we expect trends, not deterministic results.
REPLY TO REGIER AND KAY
The Commentary of Regier and Kay presents a new analysis of the World Color Survey (WCS) data, which are publicly available for the first time on the Web (http://www.icsi.berkeley.edu/wcs/data.html). Kay and Maffi (1999) argued, and Regier and Kay reiterate in their Commentary, that “grue” is an umbrella term that includes two distinct color percepts, corresponding to the BCTs for “blue” and “green,” respectively. According to their argument, the focal colors in the “grue” region should be bimodal, corresponding to the same “blue” and “green” used by speakers of “blue” languages. They go on to claim that our phototoxicity hypothesis predicts that “grue” should be a unitary percept, and that focal “grue” must therefore be a unimodal function, perhaps peaking near the middle of the “grue” range. Regier and Kay investigated the focal colors used in the “grue” languages of the WCS, found them to be bimodally distributed, and concluded that their umbrella-term idea is correct, and the single-category idea must be wrong.
We dispute the claim that our hypothesis requires that sunlight damage necessarily predicts a single focal color within the “grue” range. We found that our English speakers did not use a single BCT for “grue.” Instead, they used two BCTs—“green” and “gray”—as substitutes for “blue” and “purple.” This finding suggests that there might still be two categories among “grue”-language speakers with extensive ocular damage. In any case, Regier and Kay do not show any data on focal “blue” and focal “green,” and it is difficult to interpret their data on focal “grue” without this comparison. We present here a reanalysis of the WCS database that explores these issues.
FURTHER ANALYSIS OF THE WCS
A remarkable aspect of the WCS is how heterogeneous the patterns of individual color naming are within a language. We assigned each of 2,663 speakers in the WCS to one of four categories, based on his or her pattern of color naming: blue, 2 grue, dark, or other. Assignments were made according to how many non-“black” BCTs occurred over the hue range from 15 to 30 in the WCS color chart: Dark speakers used only “black” over that region (zero non-“black” BCTs); grue speakers used one non-“black” BCT; blue speakers used two non-“black” BCTs (i.e., “green” and “blue”); and the catchall category other was used for speakers with little visible pattern in their color names (this scheme differs slightly from the one we used in our previous report; we repeated the present analysis with several different classification schemes and found that the results are robust to reasonable variations in classification methods). Figure 1a shows as examples the color-naming data of 4 speakers of Vagla, a language spoken in Ghana. Figure 1b shows a stacked area graph for all 110 languages in the WCS, sorted by the proportion of blue speakers, then grue speakers, then dark speakers. It is striking that most languages do not fall unequivocally into the standard blue, grue, and dark categories. Instead, most languages have more than one type of speaker.
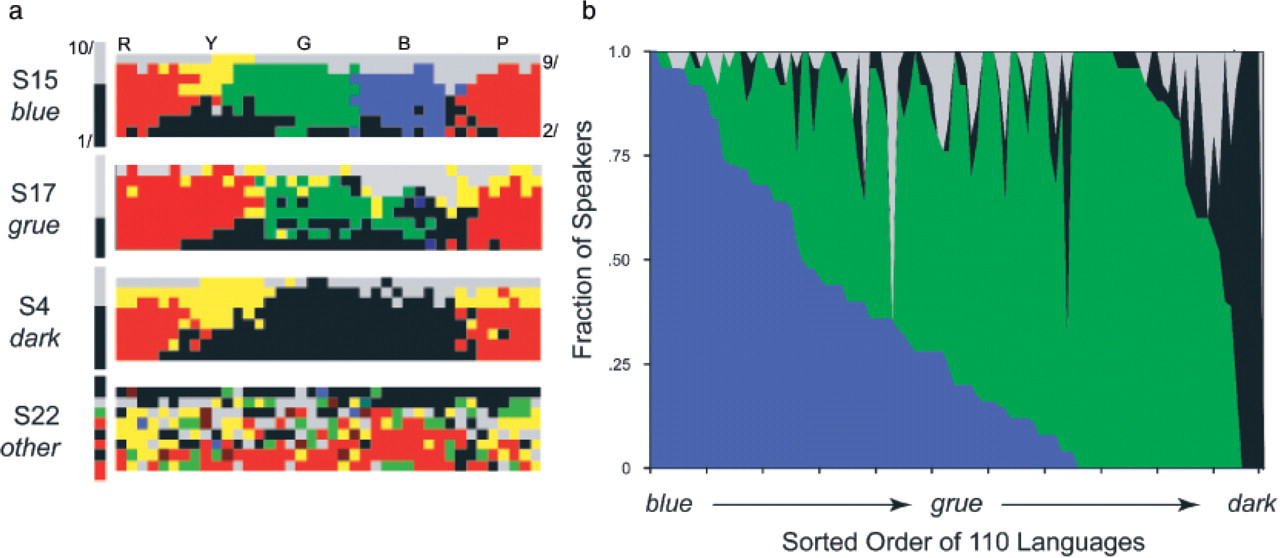
Diversity in color naming within World Color Survey (WCS) languages. Panel (a) shows color-naming patterns of 4 speakers of Vagla (WCS language 100, spoken in Ghana). False colors indicate Vagla words used to name the colors of the 330 chips in the WCS chart (40 Munsell hues run horizontally from left to right, and 8 Munsell values run from top to bottom, with a bar of 10 gray values along the side). These speakers were chosen as typical of the four color-naming patterns described in the text. Notice that Speaker S22 used as “black” or “dark” the word that the other 3 speakers used to mean “red” or “pink.” In the stacked area graph (b), each of the 110 languages in the WCS database is a value along the x-axis, with the narrow vertical bar above it colored proportionately according to the fraction of speakers of each type. The languages have been sorted from left to right according to the prevalence of blue (blue region), then grue (green region), then dark (black regions), and then other (gray regions) color-naming patterns. The sum of all fractions of speakers of each language is always 1.0.
Such extensive individual variability is not a problem for the phototoxicity hypothesis, or, by extension, any hypothesis that assumes that individuals differ in their eyesight. Such variability is also entirely consistent with the evolutionary theory of Kay and his colleagues, because if BCTs evolve, as Berlin and Kay (1969/1991) originally suggested, there must be variation among speakers. At least some speakers of an evolving language must distinguish “blue” from “green” if such a distinction is to become useful and to be established as part of the language.
In contrast, variability across speakers within languages is a big problem for linguistic relativity, which holds that people's visual perception depends only on the language that they speak (Davidoff, Davies, & Roberson, 1999; Saunders & van Brakel, 1997). If language determines thought (a strong linguistic-relativity, or “Whorfian,” view), then individual differences among speakers of each language are only noise. Individuals who speak a single common language would have no other reason to use color names differently, as their common language must determine their common thoughts and color perceptions. The fact that there is such prominent, systematic variation among individual speakers within languages is, on its face, strong evidence against the linguistic-relativity hypothesis.
Given that individual differences are common and important, we insist that analysis must be done at the level of the individual speaker rather than the language, as Regier and Kay and many other researchers, including us, have done in the past. To study the focal colors of a particular category of speaker, one must pool results based on the performance of individual speakers, rather than assigning all speakers of a given language to a particular linguistic category, irrespective of their individual color-naming patterns.
We tabulated the coordinates within the WCS stimulus set of focal “blue” and “green” from the data sets of blue speakers, and of “grue” from the data sets of grue speakers. The “blue” and “green” focal color distributions are nearly disjoint (Fig. 2a), their peaks occurring near those generally found for English speakers (MacLaury, 1997, p. 12). The grue data, presented in Figure 2b, also show two modes, as Regier and Kay show in their Commentary. However, focal “grue” is not as clearly separated into two modes as is the blue data set, a comparison that cannot be made from Regier and Kay's article because they do not report focal color data on blue-language speakers.
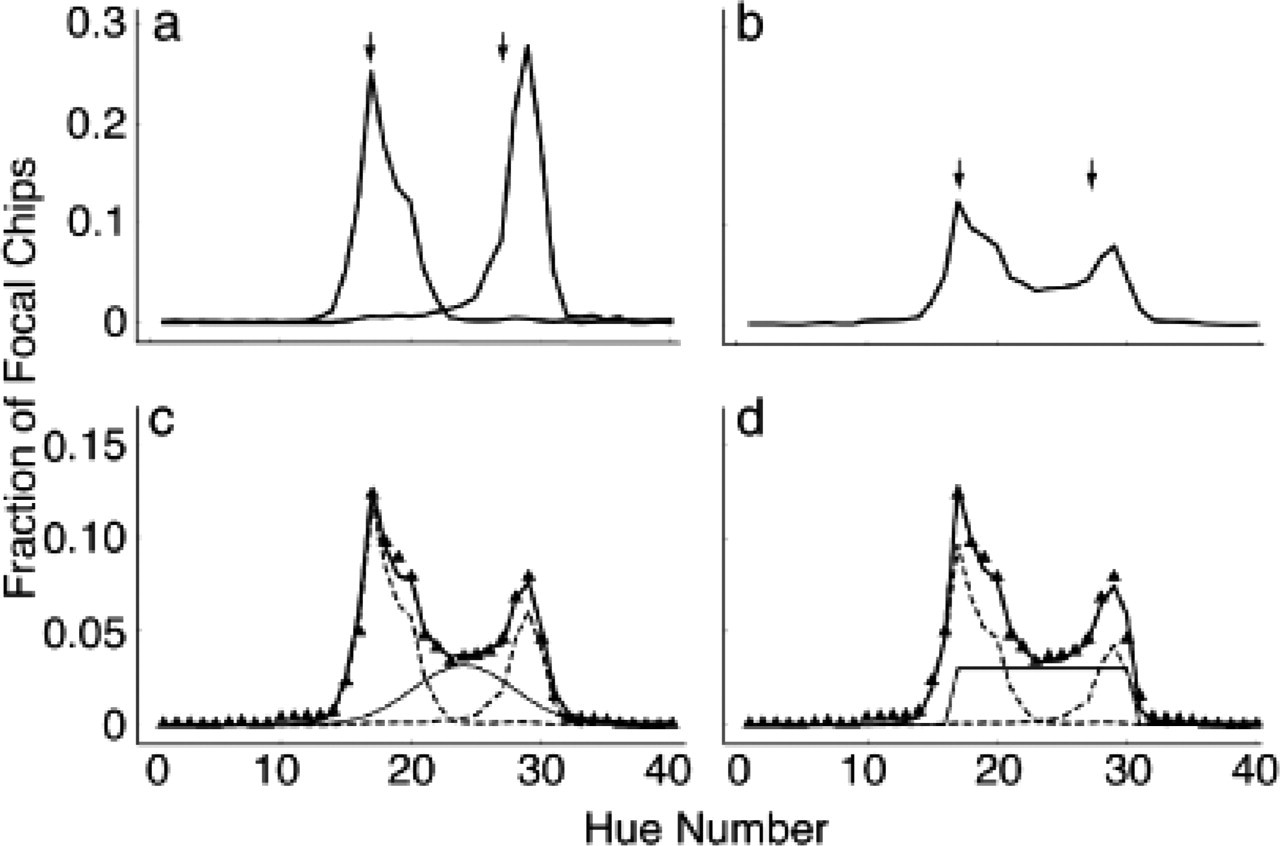
Distributions of the color chips selected as focal colors for “blue,”“green,” and “grue” as a function of World Color Survey (WCS) hue numbers (1–40), summed across all Munsell values of each hue in the WCS color chart. The distributions of “green” (left) and “blue” (right) focal colors selected by speakers who followed the blue color-naming pattern (e.g., Speaker S15 in Fig. 1a) are shown in (a). The graph in (b) shows the distribution of “grue” focal colors selected by WCS speakers who followed the grue color-naming pattern (e.g., Speaker S17 in Fig. 1a). The arrows in these graphs indicate the respective WCS hue numbers for “green” and “blue” focal colors in English. The distributions in (c) and (d) show how the “grue” focal-color distribution (triangles, data from b) can be modeled as a linear combination of three components. Two components are the same in (c) and (d): a “blue” distribution (dashed lines) and a “green” distribution (dashed lines) that are scaled from (a) and reflect the contribution from individuals who distinguish “blue” from “green.” The third component is an intermediate distribution (continuous lines), and reflects the contribution of individuals who do not distinguish “blue” from “green.” In the case of (c), this third component is a Gaussian distribution centered in the middle of the “grue” range and represents 32% of the speakers; in the case of (d), the third component is a pedestal distribution covering the “grue” range and represents 42% of the speakers.
The blue and grue data sets can be brought into remarkably close agreement by assuming that grue speakers come in two varieties. The first group of speakers apparently differentiates blues and greens perceptually, and therefore they give focal “grue” as near English focal “green” or (less often) near English focal “blue.” Speakers in this first group behave as though “grue” were an umbrella term encompassing “blue” and “green,” just as Regier and Kay predicted.
The second group of speakers apparently lumps blues and greens into a single perceptual category, and therefore they give a range of focal “grues” that are either clustered near the center of the grue range (Fig. 2c) or else widely distributed throughout the grue range (Fig. 2d). Speakers in the second group, whether their focal “grues” are clustered or diffuse, obey the predictions that Regier and Kay articulate for the phototoxicity hypothesis.
The areas under the curves suggest that the speakers from the first group, who differentiate between “blue” and “green” even as they use their BCT for “grue,” account for 58% to 68% of hits among grue speakers, whereas speakers from the second group, who lump blues and greens into one category, account for 42% to 32% of hits. The range of percentages of speakers depends on whether one chooses the Gaussian or pedestal function (Fig. 2c or Fig. 2d, respectively) for the distribution of focal “grues” from the second group of speakers, and is only approximate because some individuals contributed multiple hits to a given color name.
This analysis of the WCS suggests two interesting conclusions. First, we are not yet willing to “bury the hatchet” on the issue of linguistic relativity: We strongly believe that the hierarchy of Berlin and Kay (1969/1991), as reinterpreted by Kay and Maffi (1999), and as evaluated statistically by Kay and Regier (2003), is about right. That is, speakers differ systematically in their use of color terms, and these systematic differences suggest a principled evolution over time. Furthermore, these differences are inconsistent with the linguistic-relativity notion that languages vary higgledy-piggledy, and visual perception follows suit. However, we also stand by our previous conclusion, namely, that individual variability, due in large part to differences between speakers' exposure and responses to environmental insult, has been a driving force behind the hierarchy that Berlin and Kay proposed and Kay and his colleagues have developed and tested since.
Second, it seems likely that it is the second group of “grue” speakers who show the most severe forms of phototoxicity. If so, those are the individuals who should show clinically measurable blue-yellow (type III) color vision deficits. Our analysis of focal colors in Figure 2 suggests that the prevalence of type III defects may be as high as 32% to 42% among speakers with a grue color-naming pattern. The limited available data (Davies, Laws, Corbett, & Jerrett, 1998; Nacer & Al-Abdulmunem, 2001) are consistent with that prediction, but more work will be needed to test our hypothesis more convincingly.
Footnotes
1Color names in quotes refer to the basic color terms in any language.
2We use italics to refer to color-naming patterns.
Acknowledgments
We are grateful to Israel Abramov for first directing our attention to the focal-colors issue. We also thank J.A. Miracle and M.A. Soldo for thoughtful discussions and help with the data analysis.