
Abstract

In their recent article, Fidler, Thomason, Cumming, Finch, and Leeman (2004) noted that although researchers often use confidence intervals (CIs) in presenting data, they do not refer to CIs for drawing inferences. As the title of the article indicates, Fidler et al. consider this lack of reference to CIs in inference to be undesirable, even thoughtless. We offer an alternative interpretation. Unlike conventional tests, CIs, as commonly used, do not provide a direct comparison of groups or conditions. Consequently, researchers are acting thoughtfully by using CIs as descriptive indices rather than inferential ones.
CIs are typically drawn around sample means. These CIs are arelational in that each provides information about only a single group or condition. There are many advantages to arelational CIs: They provide a rough guide to variability in data, a coarse view of the replicability of patterns, and a quick check of the heterogeneity of variance. Arelational CIs, however, do not reflect between-groups information and cannot be used for direct comparisons.
A number of researchers have advocated the use of alternative CIs that do represent group or condition differences. For example, Tryon (2001) discussed how CIs can be constructed such that the presence or absence of overlap reflects hypothesis-test outcomes. Masson and Loftus (2003) discussed CIs for main effects and interaction contrasts. Tukey (1977; see also Velleman & Hoaglin, 1981) recommended Tukey HSD-derived CIs for comparing means and medians in one-way designs. Thompson (2002) recommended reporting and drawing CIs around meta-analytic measures such as Cohen's d or the proportion of variance explained. CIs in this class are termed relational, to describe their functionality. The advantage of relational CIs is that they may provide directly interpretable information about group or condition differences. The most salient disadvantage is the lack of standard convention for constructing and describing these intervals.
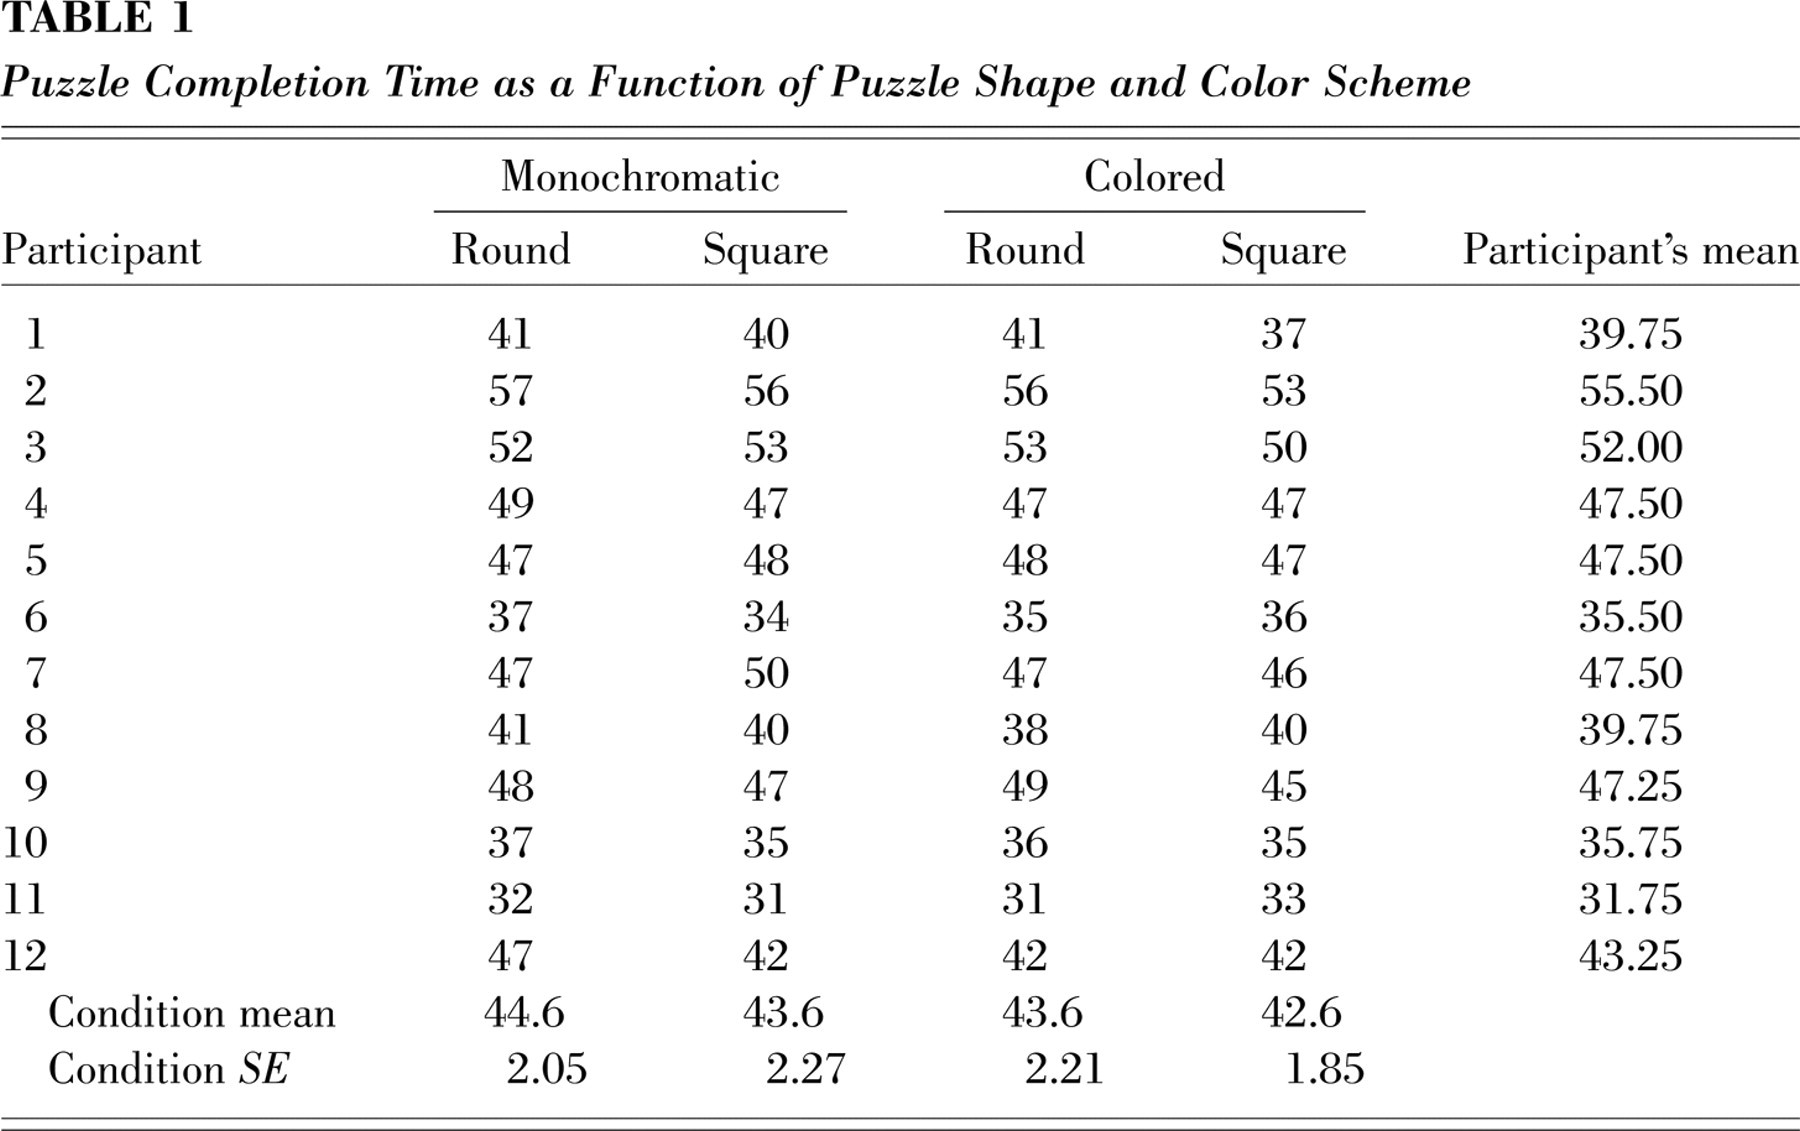
To illustrate both types of CIs, we adapt here a well-known example from Hays (1994, p. 570, Table 13.21.2). The data are presented in Table 1, and condition means are plotted in the left panel of Figure 1. The dependent variable was the completion time for jigsaw puzzles. The independent variables were the overall shape of the puzzle (round vs. square) and the color scheme (monochromatic vs. colored). Each participant completed four puzzles, one in each condition. Repeated measures analysis of variance (ANOVA) reveals significant main effects of color scheme, F(1, 11) = 13.9, p<.05, Cohen's d = 1.08, and shape, F(1, 11) = 7.5, p<.05, Cohen's d = 0.79, but not a significant interaction, F(1, 11) ≈ 0, p ≈ 1, Cohen's d = 0. In Figure 1, for each bar in the plot we have drawn three different CIs as follows: Error Bar A is the 95% CI for the condition mean as calculated in Table 1. This CI includes variability across participants. In situations in which it is a nuisance, it may be removed by subtracting from each score the participant's mean (Loftus & Masson, 1994; Masson & Loftus, 2003). Error Bar B is the 95% CI after this normalization; it does not reflect the overall variability across participants. Error Bar C is the 95% normalized CI from a pooled variance estimate. 1 The disadvantage of Error Bar C is that heterogeneity of variance across groups is not graphically displayed. These three error bars are arelational; they do not reflect any particular comparison. Relational CIs can be constructed for specific contrasts, as shown in the right panel of Figure 1. This graph displays Cohen's d effect size for both main effects and the interaction. 2
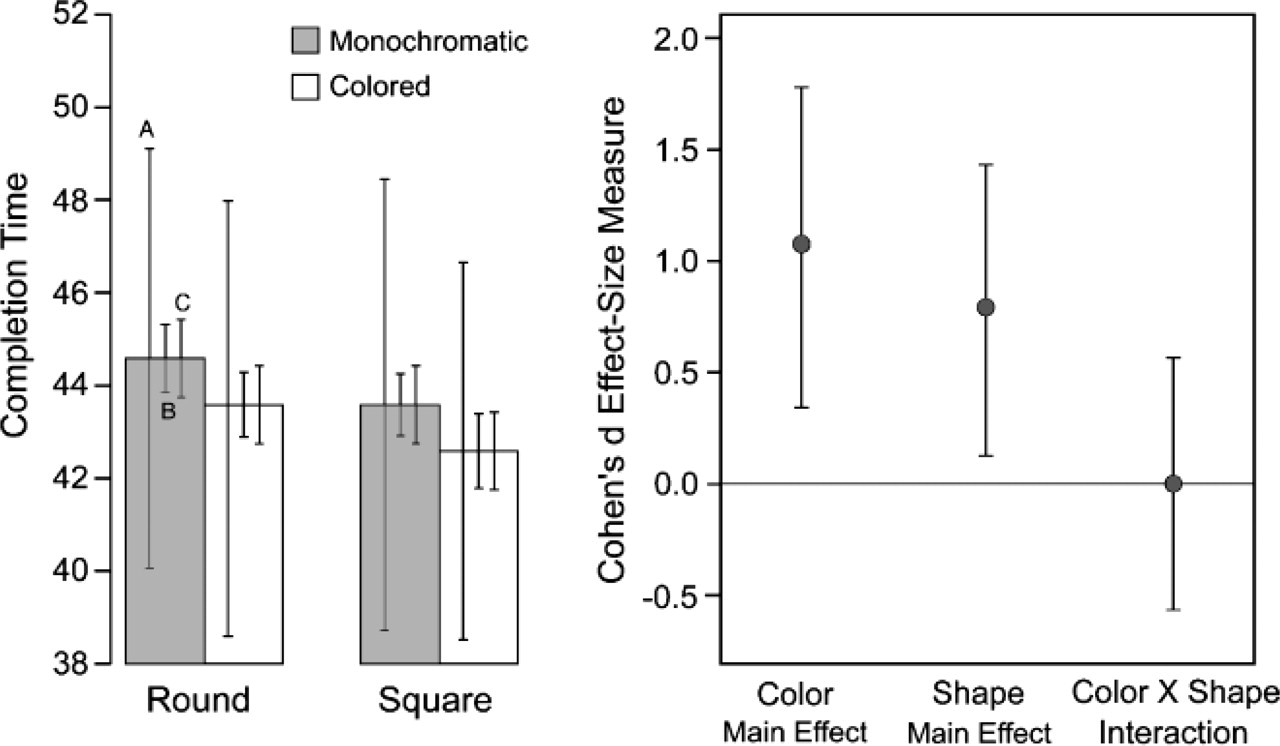
Example of arelational and relational confidence intervals (CIs) adapted from Hays (1994). The left panel shows puzzle completion times with arelational CIs. For each condition, the error bars, from left to right, are as follows: Error Bar A graphs the CI from variance within the condition, Error Bar B graphs the CI after participant effects are removed, and Error Bar C graphs the CI from pooled within-participants variance (see footnote 1). The right panel shows relational CIs around Cohen's d effect-size measures for planned contrasts.
Puzzle Completion Time as a Function of Puzzle Shape and Color Scheme
Relational error bars are often burdensome to implement and describe. For some purposes, such as theory testing, they do not provide more information than the ANOVAs. Researchers who do not wish to draw attention away from their substantive points may be better served by referring to formal tests than by referring to relational CIs. An additional problem with relational CIs is that there has not been sufficient statistical development of them. Current development, while growing, applies to a limited number of designs (Fidler & Thompson, 2001; Masson & Loftus, 2003). There are few discussions of the coverage probabilities and biases of relational CIs (cf. Algina & Keselman, 2003). The unique advantage of relational error bars, however, is that they provide a graphic index of the replicability of effect sizes, which is not available in either arelational error bars or formal tests.
We agree with Fidler et al. that (a) CIs provide valuable information about variability in the data, and (b) there must be continuing discourse over their proper use and meaning. On balance, we prefer the parsimony of arelational CIs: They provide for a rough guide to the variability in data and a quick check of the heterogeneity of variance. Because arelational CIs may not be sufficient for comparative purposes, statistical tests are often necessary. In such cases, the statistical test provides more precise information about the comparison, and should be the main focus in discussion. Researchers who rely on relational CIs need to carefully document their construction, as well as provide some justification for beliefs about their coverage probabilities.
Footnotes
Acknowledgements
We thank Fiona Fidler and Bruce Thompson for helpful comments. This research is supported by National Science Foundation Grant SES-0095919 to J. Rouder, D. Sun, and P. Speckman.
1
2
We followed Cumming and Finch's (2001) recommendations for iterating bounds with the noncentral t distribution. For the main effect of color, the appropriate estimate of residual variance is the mean squares for the color-by-participant interaction. Likewise, the appropriate estimates for the main effect of shape and the shape-by-color interaction are the mean squares for the shape-by-participant interaction and the three-way interaction, respectively. We tested our construction for equal-tail 95% CIs through Monte Carlo simulation for both main effects and found a small bias toward overcoverage (coverage of .958). Details of the construction and simulation may be found on the Web at ![]() .
.