
Abstract
Although neural networks are increasingly used in a variety of disciplines there are few applications in political science. Approaches to electoral forecasting traditionally employ some form of linear regression modelling. By contrast, neural networks offer the opportunity to consider also the non-linear aspects of the process, promising a better performance, efficacy and flexibility. The initial development of this approach preceded the 2001 general election and models correctly predicted a Labour victory. The original data used for training and testing the network were based on the responses of two experts to a set of questions covering each general election held since 1835 up to 1997. To bring the model up to date, 2001 election data were added to the training set and two separate neural networks were trained using the views of our original two experts. To generate a forecast for the forthcoming general election, answers to the same questions about the performance of parties during the current parliament, obtained from a further 35 expert respondents, were offered to the neural networks. Both models, with slightly different probabilities, forecast another Labour victory. Modelling electoral forecasts using neural networks is at an early stage of development but the method is to be adapted to forecast party shares in local council elections. The greater frequency of such elections will offer better opportunities for training and testing the neural networks.
Introduction
This article describes a new method of forecasting elections in the UK. The model, still in development, adopts a neural networks approach. Such networks mimic the ways in which biological nervous systems, of which the human brain is the best example, process information. Experience is vital to how well the network works; the brain is more efficient and effective as it learns to recognise familiar patterns. Neural networks as computer software are trained to recognise patterns in data that other techniques may fail to identify. Although widely used in a growing number of fields (for example, medicine, engineering, chemistry, computing) neural networks are not yet widely used in political science (though see Beck, King and Zeng 2000 and 2004; Eisinga, Franses and Van Dijk 1998). Our initial interest was sparked by Alexander Gorban and Cory Waxman (1995) who developed a neural network for forecasting the outcome of US presidential elections. Their model correctly predicted that Clinton would beat George Bush Senior in 1992. As an exercise we built our own neural network and used it to forecast the 1996 and 2000 presidential elections. It forecast Clinton to win in 1996 but, as with other models, predicted a Gore victory in 2000.
We believe that neural networks may, in the longer term, offer advantages over existing forecasting models. Most existing models employ linear regression techniques and forecasters, in essence, assume that a linear (simplest) function will work well enough if the predictor/independent variables are selected properly. Many of the same models rely upon some measure(s) of public opinion as an explanatory variable. This might be tautologous—using a variable for forecasting purposes that is essentially already a forecast of how people might vote. Many forecast models also include economic indicators, subjective and/or objective, in the set of independent variables. These approaches have had variable success in both the UK (Sanders 1991 and 1996; Lewis-Beck, Nadeau and Bélanger 2004) and US contexts (Abramowitz 2004; Lewis-Beck and Tien 2001 and 2004; Campbell and Garand 2000; Wlezien and Erikson 2004). Nonetheless, as James Campbell (2004, 733) notes, economic indicators may not be as accurate as we would like to believe and the relationship between economic circumstances and voting is not a constant. Another method is to use other elections to forecast the target election. For example, Helmut Norpoth (2004a) uses votes cast at US presidential primary elections to construct an effective model of the full presidential contest and has employed a similar method to examine UK elections (Norpoth 2004b). Using aggregate data of a different kind Rallings and Thrasher (1999 and The Sunday Times, 3 June 2001, 12) have used the results of local government by-elections accurately to predict vote share for the major parties at both the 1997 and 2001 general elections. However, the Rallings/Thrasher model is dependent upon local by-election data that tend to become in short supply as a general election date approaches.
Despite differences in both technique and data these models all strive for parsimony. Their authors believe that they can identify a small number of critical factors that shape each election outcome. But, even if we succeed in finding satisfactory predictors, the actual relationship between the electoral outcome and the explanatory variables might be too complex to be described properly by a linear function. In adopting a neural networks approach we set out from an entirely different starting point. Instead of estimating parameters in a predetermined (linear) model with a limited set of explanatory variables derived from a theoretical framework, we believe that in the longer term a process of data mining could unlock patterns that have lain hidden hitherto. We stress that this approach is rather new and its current scope is limited, restricted as it is to a small set of independent variables and to forecasting a winner and not main party vote shares. The relative infrequency of general elections is also a handicap to this method, given the normal requirement for large data sets with many data points. Indeed, later in the article, we set out our reasons for believing that the approach may be more apt for forecasting local election results. However, in a spirit of nothing ventured, nothing gained, we use this method here to provide a forecast for the likely 2005 general election.
Neural Networks
Mathematical explanations can be provided for difficulties encountered in forecasting. One such difficulty would be the dynamical unpredictability of complex system behaviour over a given time period. A second factor is the probabilistic and non-deterministic nature of the subject. Neural network techniques, based on ideas and principles arising from the neurosciences, have been developed precisely to deal with such problems (Lisboa 1992; Picton 1994; Swingler 1996; Abdi, Valentin and Edelman 1999) and can improve forecasting. The technique is essentially based on the idea of learning by example. Suppose we wish to develop an algorithm for automatic character recognition and there is a set of examples of such recognition. The network, in a process known as training, can develop an optimal algorithm after considering these examples.
A Multi-Layer Perception
A form of neural network called a Perceptron, developed by Frank Rosenblatt in the 1950s (Rosenblatt 1961) is one of the most promising and widely used. Later, the Perceptron with hidden layers (Multi-Layer Perceptron or MLP) was developed by a group of cognitive neuroscientists (Rumelhart and McClelland 1986). One of the first fascinating examples of using the MLP was an attempt to train a computer program to pronounce English words correctly. The training process is based on the presentation of many examples of correct pronunciation. At the beginning of training the MLP can barely pronounce even simple words, but its ability improves step-by-step—similar to the process whereby a baby learns to speak.
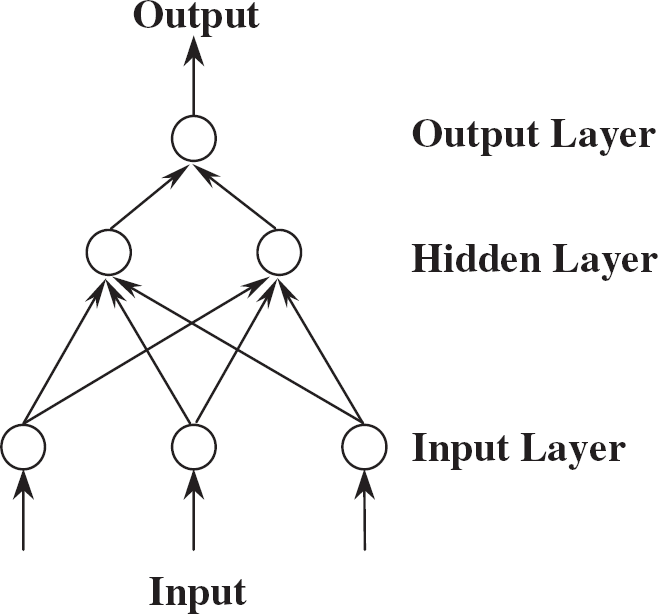
The MLP itself consists of several layers of elements or artificial neurons (see Figure 1). The first layer forms the MLP input. The connections from the input layer deliver the information to the internal, hidden layer, and connections from neurons of the hidden layer send signals to the neurons of the output layer. Each connection between two neurons has specific connection strength, which is a measure of its efficiency. For example, in Figure 1, the output layer includes one neuron which receives two connections (with adjustable connection strengths) from two units of the hidden layer. Generally speaking, each neuron receives several input signals, calculates the weighted sum and transforms this sum into the element's output signal. The choice of the transformation function depends upon the problem under consideration. The most typical transformation function is the sigmoid but a linear transformation could be used instead.
Training and Testing the Network
There are two main stages in the development of a neural network: training and then testing. The training set contains pairs of signals: an input signal and the target desired output for this input signal. In our case the training objective is to develop the network such that given a certain configuration of input signals it can predict the correct electoral outcome. As we sequentially present the elements of the training set to the network's input, the connection strengths between neurons are automatically adjusted in such a way that the corresponding output signal becomes close to the desired target. At the outset, the output is very different from the desired output because the training starts with random connection strengths but, sequentially, presentations of the training set improve the MLP performance. The adaptation of connection strengths increases the number of correct outputs and successful training can give a zero, or close to zero, error. To reach this goal, the least squares approach (found in linear regression) is used to adjust connection strengths. We can consider an error as the squared difference between the MLP's output following the presentation of some particular input and the desired output. The total error is the sum of all errors following presentation to the MLP of all data in the training set. The main idea of MLP training is to find such connection strengths which provide the minimum of the total error.
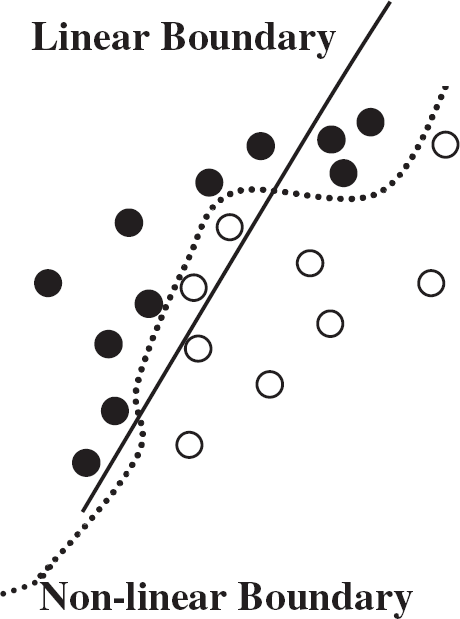
A popular interpretation of a MLP is that of a ‘classifier’. The output layer can be considered as a set of indicators showing to which class the input data belongs. The MLP training means that boundaries between different classes can be developed (see Figure 2). The important property of the MLP is that these boundaries can be non-linear and of a complex shape. Compared to linear regression, where boundaries are interpreted as only linear, straight lines or planes, the boundary developed by MLP can classify more finely those differences that lie within the data.
The training process is long and requires many repetitions of elements. There are different training algorithms, including the back-propagation rule used here, where the error information propagates back to make an adaptation/modification of connection strengths. After each modification, the neural network, now equipped with updated connection strengths, produces a smaller error for subsequent presentations of the same training data. The training process stops if the total error becomes small enough. Occasionally it is impossible to reduce the error value further, even though the required threshold has not been reached. In such cases the learning is acknowledged as partial and imperfect. However, if the network has a small mean least squares error we move to the second stage.
Linear vs. Non-linear Classification
The second stage of development is testing. Usually the set of available data is split into two independent (non-overlapping) subsets. One subset is the training set and the trained network is then tested using the second subset. During this testing phase the connection weights of the various elements comprising the input signal are fixed and unchangeable. Once again, we sequentially present the elements of the testing set to the input of the network and compare the output value with the known value. At this stage we discover whether the training set was representative of the entire data set and whether the network has learnt sufficiently well that it is able to match its output signal to the known output, i.e. it can correctly forecast the known election outcome.
Information generalisation is an important feature of any neural network. We anticipate that, after training, the network will also deal correctly with other data. Due to the generalisation property, the network will respond correctly to the presentation of new input signals. Assuming the network was properly trained we may use it for forecasting purposes. The input is provided with some new data that are different from both the training and the testing set. Naturally, because we are forecasting, the desired output signal cannot be identified beforehand. In fact, the network's output signal resulting from the input of new data becomes the forecast. Our faith in the forecast is a function of how well the training process worked and the accuracy of forecasts using the set of testing data.
Clearly, training the network is a critical part in developing an effective forecasting tool. The result of training depends on the choice of the network parameters. The number of input and output neurons is fixed (of course, this part of the neural network architecture depends on the problems being addressed and structure of the data), while both the number of neurons in each hidden layer and indeed the number of hidden layers is variable. Increasing the number of hidden neurons means an increase in the number of connection weights and, hence, the number of free parameters. If the number of parameters is large then the problem of over-fitting can appear. This means that the network delivers a good performance for the training set but the generalisation is rather poor and testing results are adversely affected. Choosing the correct number of parameters requires experience and many trials should be undertaken to choose the appropriate number of elements that optimise the network's performance (see, for example, Beck et al. 2000, where the special in-sample learning procedure for the best choice of hidden neuron number has been developed). Increasing the number of hidden layers adds to a model's complexity but it may prove useful where the problem is extremely non-linear.
A Neural Network for Electoral Forecasting
The data used to forecast the 2005 general election is based on information regarding all previous general elections from 1835–2001—a total of 42 cases. As stated earlier, a network requires two basic types of data—input and output signals. For our purpose the output signal is rudimentary and is simply the party winning the election. For all general elections from 1835 onwards the network was told whether the P (power) party had been returned or whether the O (opposition) had been successful. The corresponding result was coded as zero if the (O)pposition party won or 1 if the party in (P)ower was re-elected. Of course, binary answers may become arbitrary, particularly during periods of party system fragmentation and/or hung parliaments, but after consultation we felt that our coding of these events could be defended.
The input signal consisted of ‘expert’ responses to a battery of 11 questions loosely adapted from Gorban and Waxman (see Appendix) that related to periods between two sequential general elections ranging from 1835–2001 (42 periods). This reliance upon expert opinion has been used to explore the distribution of power (Hewitt 1976) as well as to identify party positions (Castles and Mair 1984; Laver and Hunt 1992; Laver 1998) and it appeared as an appropriate method for our purpose.
Two experts (E1 and E2) volunteered to generate answers to the set of questions. The experts were only given the choice of answering ‘Yes’ or ‘No’, although a more sophisticated model could permit a greater range of responses. So, for example, E1 produced the sequence of 11 answers ‘YYYNNYYYNYN’ for the period 1992–1997, meaning that the answer to the first question, ‘In your view has the economy improved under this government?’ was ‘Yes’; while the answer to the fourth question, ‘In your view has this government been involved in military conflict during this parliament?’ was ‘No’. These answers were coded as (Y↔1, N↔0) and then presented to the input of the neural network. In effect, this gives two data sets (set_1, set_2) corresponding to the responses from E1 and E2 respectively. Each set consists of 42 cases, with each case having an input vector of 11 binary numbers and a target output (0 or 1).
During the training procedure, both the number of elements within the hidden layer and their type were varied. Because we have a small data set we restricted the use of hidden units. Increasing the number of hidden elements made the model unstable. In fact, the best result was found using only one hidden layer with one element. The type of transformation function for the hidden element is also important. We tried both sigmoid and linear functions, finding the latter gave more stable results. The transformation function of the output neural element was sigmoid with values lying in the range (0–1). Overall therefore, the resulting MLP contains 11 binary elements in the input layer, one linear hidden unit and one sigmoid type element of the output layer.
Predicting the 2005 Election
During summer 2004 we emailed members of the Elections, Public Opinion and Parties specialist group of the PSA with a request to answer a short questionnaire on recent political events. In order to provide continuity with our experiment for the 2001 election we retained the original set of questions although a number of respondents were somewhat critical that the answers to some of these were ‘blindingly obvious’. By August we had collected answers from 35 respondents. These responses were presented to each of two neural networks that had been previously trained by the sets of original data from our two experts (set_1 and set_2) and then used to generate forecasts.
Experiment 1
In this experiment we trained a network using the set_1 database. This provides a forecast for the 2005 general election based on the answers of 35 ‘predictors’ which were presented to the network. We found that 33 (94 per cent) predictions were for ‘P’ (Labour to be re-elected) and 2 (6 per cent) were ‘O’ (opposition party to win). To ensure that this forecast was stable and reliable we repeated the computations 1,000 times, starting the training with random connection strengths. This means, in effect, that in one trial the weight given to each of the 11 variables is different to that used for another trial. Every training process finds a minimum of the error function. It is known that due to internal symmetries of mathematical formulae describing the MLP, there are several minima of the error function. Starting from random conditions, the neural network chooses a minimum of the error function and tends to this minimum during the training procedure.
The result of these multiple trials using the set_1 database is interpreted as a forecast that Labour will be re-elected. The mean value of this probability is 0.91 with standard deviation of 0.1.
Experiment 2
For this experiment we repeated the same calculations as above but this time used the set_2 database, the answers from our second expert. The answers of 35 ‘predictors’ were presented to the network. We found that ‘P’ (Labour re-elected) was predicted 27 times (77 per cent) and 8 (23 per cent) predictions were ‘O’ (opposition party wins). Again, to ensure reliability we repeated the computations 1,000 times, beginning the training with random connection strengths. This neural network gives a lower probability for Labour's re-election. The mean probability is 0.71 with the standard deviation of 0.09.
Experiment 3
In our earlier paper (Borisyuk et al. 2001) we showed that the elections which proved the most difficult to predict and whose results were least compatible with the views of our experts were those in 1945, 1922 and 1857. We suspected that part of the problem was associated with the prior circumstances relating to these particular contests. For example, in the first two there are, of course, difficulties in assessing whether the P or O party was victorious at the election since the previous government had been a wartime coalition of different parties. The circumstances prior to the 1857 election were also confused by coalition governments.
For our third experiment we decided to modify our training data sets by deleting these particular general election results. We also assembled a new data set (set_g) by ‘gluing’ together the answers from both experts. This was done to try and overcome the problem that a network will reflect the particular expert's views that were used to train it. Gluing in fact means that we consider the corresponding answers of both experts and send them to the network input. Therefore, in this case, we consider the MLP with an input layer of 22 neurons (11 binary answers of the first expert +11 binary answers from the second one). The modified network comprises one hidden element and one neuron in the output layer.
We trained the MLP with modified glued data (excluding the 1857, 1922 and 1945 election results) from the two experts and used the trained MLP for forecasting. Because the neural network now had 22 receptors, each respondent's 11 answers were doubled and presented to the network simultaneously. Again, to estimate the network's reliability we repeated a thousand times the same process of training and forecasting. Using this network the mean of the probability that Labour will be re-elected in 2005 is 0.75 with standard deviation of 0.02.
Conclusions
The outcome of the 2005 general election is in little doubt if we believe the forecasts of the neural network approach. Admittedly, in current circumstances, this is not an announcement that will cause newspaper editors to ‘hold the front page’. Nevertheless, we feel that our experiments using this method are interesting, although difficulties do remain.
The process of model building should involve a series of trial and error experiments. Our initial approach involved obtaining expert answers to a series of 11 questions. Upon reflection the wording of those questions was sometimes vague and ambiguous and the requirement to provide ‘Yes’ or ‘No’ answers somewhat restrictive. The analysis of the internal structure of the networks shows that the responses from just two questions are given relatively large weights in the forecasting of results. These questions were: ‘Overall, has the media been hostile to the official opposition?’ and ‘Overall, in your view has the prime minister performed well during this parliament?’. It is the answers to these questions that in many cases provide the strongest input signal leading to the correct output signal. Improvements could be made to existing questions or other questions could be added. Obtaining the views of experts to help train and test different networks demonstrates that the subsequent network will reflect the expert's own characteristics. There is a danger that if those views are idiosyncratic then the network will reflect that trait. Gluing together experts’ responses offers a potential solution. A wider circle of expert opinion might prove beneficial.
Modification of the input signals (from expert opinion to distributed on-line data resources made available through new grid technologies, for example) should also be followed by changes in the characteristic of the output signal. Currently, that signal simply states either a win for the incumbent party or for the opposition. Clearly, that takes little account of the role of third parties and, moreover, it does not provide a sufficient level of detail to interest most people. Besides reporting which party is likely to win, a forecasting model should properly concern itself with predicting vote shares for the main parties and the size of any parliamentary majority. Future development of this approach will amend the nature of the output signal.
Another problem stems from the small number of data points—general elections are relatively infrequent events. In other applications that employ this approach the number of data points are often much higher. In our case we circumvented this problem by adapting the methods used for training and testing. Our decision to exclude some particular elections was partly justified but this, of course, brings with it a further reduction in the number of cases.
In the future we shall instead attempt to build neural networks that can be used to forecast local election outcomes. These networks would be trained and then tested using previous local council election results, which are much more numerous than their parliamentary equivalent. Each local authority election can be viewed as the equivalent of a general election, and each year since local government reorganisation in the early 1970s an average of more than a hundred local authorities have held elections. Local elections, therefore, would provide better opportunities to fine-tune the application of neural networks for electoral forecasting. It would be our intention to employ a variety of input variables, including suitable social, economic and political indicators.
We have used a relatively new technique in order to predict the 2005 general election result. This method is effective enough (always assuming that Labour is re-elected) but we also consider a neural network, appropriately modified, as a promising approach to forecasting in the longer term. It is clearly useful for uncovering patterns in the data and hence it becomes valuable in the processes of classification and prediction (Bishop 1995). Political scientists may begin to acknowledge its advantages over currently accepted methods, including regression (Beck, King and Zeng 2000 and 2004, but for a contrary view see De Marchi, Gelpi and Grynaviski 2004). The non-linear model is a good approximation of a sometimes very complex correspondence between input and output information. By increasing the number of hidden neurons we can introduce more sophistication into the model, allowing it to manage greater complexity in the data.