
Abstract
Competing theories of political participation predict varying levels of engagement among minority groups according to the composition of the locality. For example, some previous research has shown that electoral turnout among minority groups tends to be higher in areas where those groups are concentrated. However, there has been little or no similar evidence pertaining to electoral registration. Using data from the 2001 general election in England and Wales we find that Muslim registration levels are higher in predominantly Muslim areas, giving credence to the argument that minority electors are mobilised through social connectedness and community networks, rather than marginalised through deprivation and segregation.
With levels of participation in modern democracies in decline, electoral participation is increasingly seen as a key aspect of the accountability of governments and of citizenship. Electoral participation (including registration) matters not only because it is an obvious indicator of political participation, but because it may also be regarded as a democratic health check (Topf, 1995). Furthermore, inequalities in participation, especially affecting minority groups, raise concerns about ‘majority tyranny’ (Verba et al., 1993). It is widely recognised by scholars and policy-makers alike that the incorporation of minority groups into the democratic process is a major challenge facing modern democracies. Inequalities in participation may be regarded as especially problematic if a minority group has distinctive political attitudes, preferences or interests. Low levels of participation may lead not only to a failure to represent these interests, but also undermine the legitimacy of the state in the eyes of the minority group. In many democracies, not least Great Britain, minorities are marked out by their racial, ethnic or religious characteristics. In the current climate of perceived ‘Islamophobia’ and social and political unrest in parts of Britain's Muslim communities, levels of British Muslim participation in conventional electoral politics are a pressing concern.
Previous research has shown that Muslim 1 registration lags behind that of the majority population (Anwar, 1990; Saggar, 1998) though arguably this gap is narrowing (Anwar, 2001). Evidence from the 2001 general election showed that turnout among British Muslims was similar to that of the white population and generally higher in areas where they were most populous (Cutts et al., 2007). This has important implications for our understanding of the processes by which minority populations become more or less engaged in conventional politics. For example, while some theories would suggest that assimilation and dispersion of minority groups might lead to enhanced levels of participation (Dahl, 1961), this evidence suggests the opposite (Wolfinger, 1965). Rather, the findings are consistent with alternative theories which predict higher levels of group consciousness and mobilisation in areas where minority groups are most concentrated (Huckfeld, 1986; Schlichting et al., 1998). However, although much debate about electoral participation concerns turnout, a substantial minority of the adult population never even makes it as far as the electoral register, let alone the ballot box. As a result, the evidence on which these debates are based tells only part of the story.
In this article we use information from electoral registers for a sample of electoral wards at the 2001 general election in conjunction with the 2001 Census of Population. Most existing research uses survey data to provide ethnic or religious specific registration estimates yet this approach is beset by problems of misreporting, insufficient sample size and differential non-response. Our approach allows us to estimate overall registration rates with a considerable degree of accuracy, and provide comparative estimates for Muslim communities. We use these estimates to explore the relationship between the geographical concentration of Muslim populations and variations in the registration rates of Muslims. In brief we test what we call the mobilisation hypothesis which appears to hold for the turnout of British Muslims (Cutts et al., 2007), but with reference to electoral registration. Given that there are potential costs in registering to vote (e.g. in terms of effort or in terms of making oneself known to authorities) just as there are in turning out to vote, we might expect similar patterns to emerge for registration as do for turnout. In other words, in just the same way as turnout in neighbourhoods comprising communities with the same racial composition was found to be higher than in those with a differing racial composition (Schlichting et al., 1998), we hypothesise a similar relationship for registration; a relationship which, as far as we are aware, has not been tested since the 1960s (Mathews and Prothro, 1966), 2 and never in a British context.
As well as having important implications for our understanding of the impact of segregation and neighbourhood effects on minority political engagement and mobilisation, our findings have wider implications for policy-makers and political actors. For example, the Commission for Integration and Cohesion is considering how local areas can make the most of the benefits delivered by increasing diversity. One of the concerns of the Commission is about the apparent deficit of social capital in areas of greater ethnic diversity, a concern grounded in empirical work based in the US which shows that, in the short term, diversity and immigration challenge community cohesion (Putnam, 2007). Equally, evidence of ‘hidden exclusion’ from the political process among Muslims in non-deprived predominantly white areas suggests political actors need to rethink significantly how they reconnect with these minority groups.
Participation of Minority Groups: Theoretical Approaches
Various explanations have been put forward as to why registration rates may be higher or lower for minority groups (Leighley and Vedlitz, 1999), and also why they may vary geographically within minority groups (Schlichting et al., 1998). Indeed, inherent in some theories of ethnic minority participation that predict high levels of engagement is the implication that spatial clustering enhances participation rates.
Explanations for different levels of participation can be broadly categorised into generic and specific effects. By generic effects we mean factors that affect the levels of participation of all groups in a society, but that may vary both in terms of their distribution between groups and the extent to which they impact on participation (Uhlaner et al., 1989). For example, education may affect whether people across all religious or racial groups participate in elections, and different groups may possess higher or lower average levels of education. The most widely understood and researched generic effect relates to the socio-economic status and resources of minority groups (Verba and Nie, 1972; Verba et al., 1993). Typically, Muslims in Britain tend to be more working class and suffer higher levels of deprivation than the majority white population (Peach, 2006). Specific effects refer to factors which relate specifically to minority groups, including factors such as group consciousness (Shingles, 1981) and ethnic community explanations (Guterbock and London, 1983).
Given our interest in the impact of spatial concentrations or segregation of Muslim communities on registration, it is important to note that both generic and specific factors affecting Muslim participation may vary geographically. Should geographical variations, in particular attributes or levels of community segregation, be correlated with variations in registration, then this will help us understand how and why registration levels differ from the rest of the population and vary geographically. Possible explanations include differences in social status and resources (Verba and Nie, 1972); enhanced social connectedness or social capital (Putnam, 2000); group conflict theory (Giles and Evans, 1985); and group consciousness or identity (Miller et al., 1981; Shingles, 1981).
More specifically we might expect that in Muslim ‘enclaves’ levels of political mobilisation generated through social connectedness and community networks (both secular and religiously based) may lead to higher levels of registration. For example, Sidney Verba et al. (1993) demonstrate the mobilising effect of churches on black American participation. While the view of Islam on political participation (and the line taken by mosques) is contested (Sajid, 2004), it is widely recognised that Muslim community leaders and political groups (e.g. the Muslim Council of Britain [MCB]) have encouraged participation among British Muslims in a similar way. For example in 2004 the MCB sent a letter to mosques, Islamic associations and institutions ‘to support parties which have Muslim friendly policies’. The letter requested mosques to ‘convey this urgent message in your Friday khutbah and rally the community to take action by voting on Thursday 10 June’. 3 Elsewhere it has been noted that such mobilisation effects will naturally be stronger where communities are more populous. For example, Kurt Schlichting et al. (1998) suggest that ‘the demographic concentration of minority members within a compact spatial area would facilitate the growth of political organizations and the ability to mobilize rank and file members’ (Schlichting et al., 1998). The flipside of this is illustrated by Carole Uhlaner et al. (1989) who argue that the incentive for political leadership to mobilise Asian American voters is lower because of their geographic dispersion.
Second, according to the ethnic community model, greater group consciousness or awareness tends to be correlated with higher participation, especially where efficacy is high but sense of trust is low (Shingles, 1981). Although this pattern has generally been found for high-initiative participation (e.g. being involved in party campaigns), there is less clear evidence that low-initiative activities are similarly affected (Guterbock and London, 1983; Pie-te Lien, 1994). Indeed an alternative interpretation is that group consciousness may cause alienation and inhibited activity and thus be associated with our alternative hypothesis described below (Cohen and Kapsis, 1978). Notwithstanding this, it is plausible, as Schlichting et al. (1998, p. 219) argue, that ‘an ethnic community is more likely to emerge among minority members who live in areas populated mainly or exclusively by minority residents’. Similarly, Robert Huckfeld (1986) suggests that people living in incongruous social environments (such as Muslims in non-Muslim areas) are less likely to participate.
A similar pattern may be expected according to group conflict theory, which suggests that greater neighbourhood diversity may lead to higher levels of conflict and hence have a mobilising effect on the minority population (Blalock, 1967). In a British context this might reinforce the tendencies of Muslims living in areas with larger Muslim populations to be more active as these areas are more religiously and ethnically diverse. 4 If this is correct, then together with the mobilising influence of local community institutions and parties, we might expect higher Muslim registration rates in neighbourhoods with a larger percentage Muslim population. This represents our mobilisation hypothesis (see below).
However, due to settlement patterns of Britain's Muslim populations (Robinson, 1986) the least well-resourced parts of the Muslim community are likely to live in those Muslim enclaves, whereas the most educated, ‘middle-class’ Muslims are relatively more likely to have moved to the suburbs. According to theories of acculturation, the latter are more likely to be integrated into the host society and more likely to participate (Pie-te Lien, 1994). By contrast, higher levels of relative deprivation or poverty may lead us to expect greater alienation and hence lower levels of registration where Muslim populations are more concentrated. It has previously been shown that ‘poor neighbourhoods foster a weak attraction to the political system’ (Cohen and Dawson, 1993). It has also been argued that high levels of racial or ethnic diversity are negatively associated with participation (particularly turnout) due to weaker mobilising institutions and higher barriers to participation (Hill and Leighley, 1999). Thus the combination of acculturation in the suburbs together with alienation and demobilisation in the deprived ‘enclaves’ might lead us to expect lower levels of registration of Muslims in areas with a larger percentage Muslim population. This represents the alternative hypothesis, or more descriptively the marginalisation hypothesis.
Thus these conflicting expectations lead to competing hypotheses, namely that Muslims living in areas with substantial Muslim populations are more (or less) likely to register to vote than those living outside of these areas. This relationship should be robust even after controlling for the socio-economic and demographic characteristics of areas.
Thus there are three main aims to this article:
To provide an accurate estimate of Muslim registration rates in comparison with the population as a whole. To explore the relationship between the geographical concentration of Muslim populations and their levels of registration. To explain spatial variations in Muslim registration by reference to population concentration and other factors affecting registration.
It is important to note that we do not set out to explain more generally why Muslims have lower levels of registration, but rather to show how it varies geographically according to the size and nature of the Muslim population. However we do suggest that nationality and socio-economic factors play a significant part in accounting for the overall difference in registration levels between Muslims and the rest of the population.
UK Registration: Legal Framework and Previous Evidence
For reasons of scrutiny and legitimacy, it is a key requisite of Western democracies that a citizen must be registered to vote before they can participate in elections. Like most other Western democracies, the UK voter qualification age is eighteen. As well as adults aged eighteen and over, the UK electoral register also includes those who will become eligible to vote during the lifetime of the register (‘attainers’). Under UK electoral law, registration is open to British, Irish or Commonwealth citizens or members of a European Union state. British citizens living abroad can register as overseas electors and are eligible to vote in UK and European parliamentary elections for up to fifteen years after they have left the country. At the 2001 general election rolling registration was introduced. The register is now updated each month, apart from during the annual canvass period (September, October and November), and people can register to vote in the weeks before the election, but not once the election has been called. For the 2001 general election on 7 June, new electors were required to register before 5 April.
Obtaining reliable registration rates can be a difficult and imprecise process given uncertainty about the size of the eligible voting age population (because of census under-coverage, temporary residency of foreign nationals, etc.). Comparing the 1991 Census and the Post Enumeration Survey, Stephen Smith (1993) estimated that 7.1 per cent of the people eligible to vote were not on the electoral register. At the 2001 general election, one study estimated registration at just below 97 per cent (IDEA, 2002) while another estimated that around 7 per cent of people in England and Wales were not on the electoral register in 2002 (Dorling, 2007). 5 An estimate for 2004 suggests that UK registration rates might range from 92–93 per cent according to a study conducted for the Electoral Commission by the Office for National Statistics (ONS) (Electoral Commission, 2005). One of the strengths of the ONS survey is that it checked census and Labour Force Survey records against the electoral register and is therefore likely to have a high degree of accuracy, although the sample sizes for minority groups were still relatively small.
Religion, Ethnicity and Registration
Evidence from the United States, where considerable research has been conducted on race and participation, suggests that there are considerable variations between ethnic, religious or racial groups in their propensity to register to vote (Pelissero et al., 2000). Similarly electoral registration in Britain is unevenly distributed and varies between geographical areas (Smith, 1993) and between different social and demographic groups (Smith, 1993; Todd and Butcher, 1981). In particular, substantial differences in registration rates have been identified between ethnic minority groups, though survey-based estimates (that are subject to non-response bias) and local case studies have produced largely inconclusive and sometimes contradictory estimates (Anwar, 1994; 1998; 2001; Saggar, 1998; Smith, 1993). Research based on the 1997 British Election Survey (BES) which employed an ethnic minority booster sample found registration levels of 90.2 per cent for Pakistanis and 91.3 per cent for Bangladeshis, compared to 96.9 per cent for whites (Saggar, 1998). More recently, a face-to-face sample survey across five local authority areas found non-registration levels to be slightly lower among Pakistanis (17 per cent) and Bangladeshis (13 per cent) compared to whites (18 per cent) (Anwar, 1998). The Electoral Commission/ONS study cited above suggested that the percentage not registered in the mainly Muslim South Asian communities was much lower: 6 per cent for Bangladeshis and 8 per cent for Pakistanis, compared to 17 per cent for all British minority ethnic groups and 6 per cent for whites. The study also found that there was a strong relationship between non-registration and nationality, which, as will be seen below, is also reflected in our results. 6 A similar explanation is put forward to explain part of the difference in American Asian and Latino registration rates in the US (Uhlaner and et al., 1989).
Methods
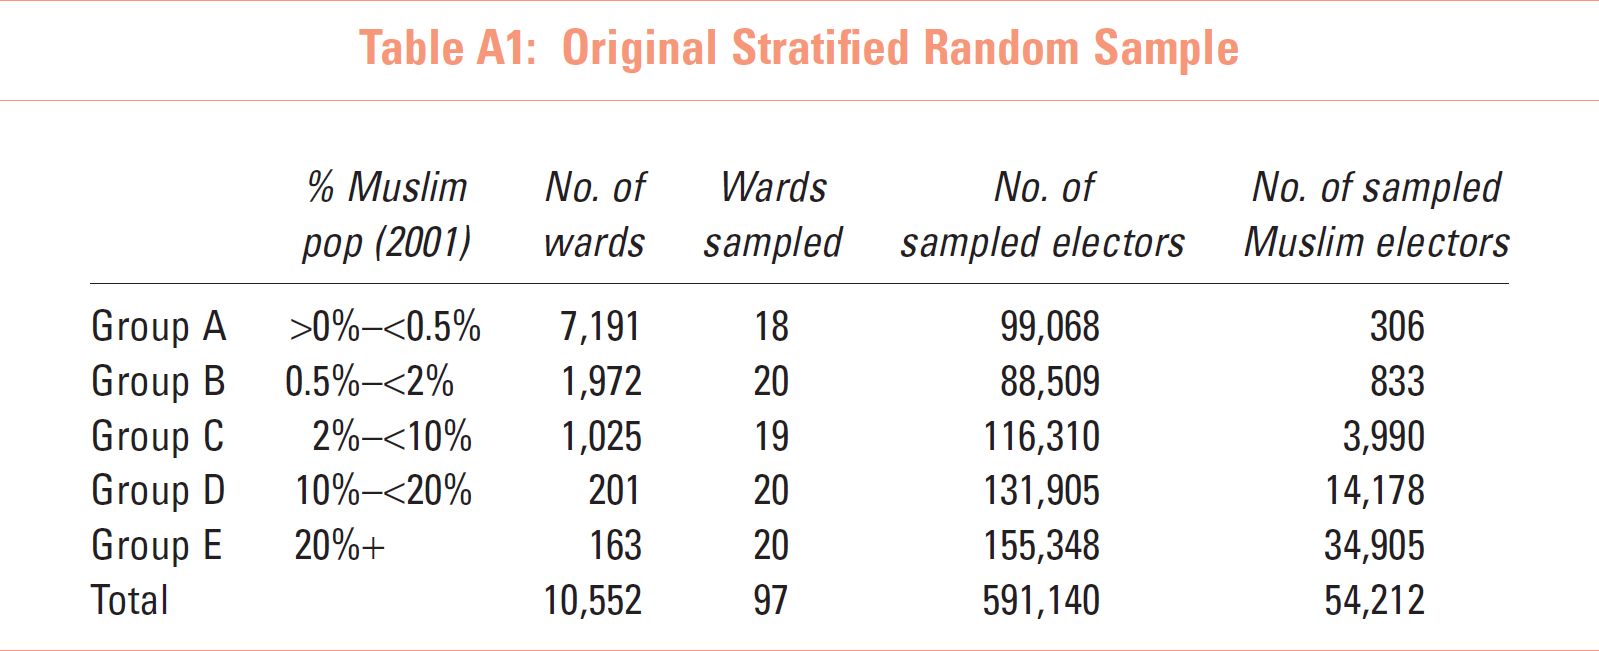
This research uses electoral registers from the 2001 general election, for a stratified sample of electoral wards. Wards were sampled disproportionately in areas with a large South Asian population to ensure the effective coverage of different subgroups (see Table A1). All electors were included in the selected wards, the primary sampling units. The sample contains wards from England and Wales and covers over half a million electors including postal voters.
Estimates of the number of registered electors are derived from our sample of electoral registers. These were allocated to geographical Census Output Areas (OAs) using the All Fields Postcode Directory (AFPD). By aggregating counts of voter age population across all the OAs for which we have valid data we are able to achieve an accurate estimate of registration for England and Wales (Fieldhouse and Cutts, 2007). 7
In order to identify Muslim electors an analysis of names was conducted using two different software packages: Nam Pehchan (version 2) and SANGRA, together with manual checking of results (Fieldhouse and Cutts, 2007). Both packages claim high levels of sensitivity and specificity which are discussed extensively elsewhere (Cummins et al., 1999; Harding et al., 1999; Mason et al., 2003; Nanchchal et al., 2001) and used in combination, in conjunction with manual checking, should provide very reliable levels of identification of Muslim names. Our analysis identified 54,000 Muslim names out of a total sample of 590,000 electors.
Estimating the Voter Age Population (VAP) and Voter Eligible Population (VEP)
The first step in the creation of the VEP (McDonald and Popkin, 2001) was to estimate the total census population aged eighteen plus (VAP) of each OA, making adjustments for the estimated numbers of attainers and deaths (calculated using census information based on the 39 days from the census date to the general election date). 8 Similar estimates were generated by ethnicity and by religion. We then adjusted these OA totals to take into account probable ineligible electors due to nationality, using information about country of birth (together with ethnicity and religion) at the ward level (Fieldhouse and Cutts, 2007). 9 Using the resultant OA religion and ethnicity (marginal) totals together with ward-level ethnicity by religion cross-tabulations, we created VEP estimates for (a) the population and (b) Muslims, at the OA level. 10 These were then aggregated across the whole sample to estimate a national rate (see Table 1). 11
Registration by Religion
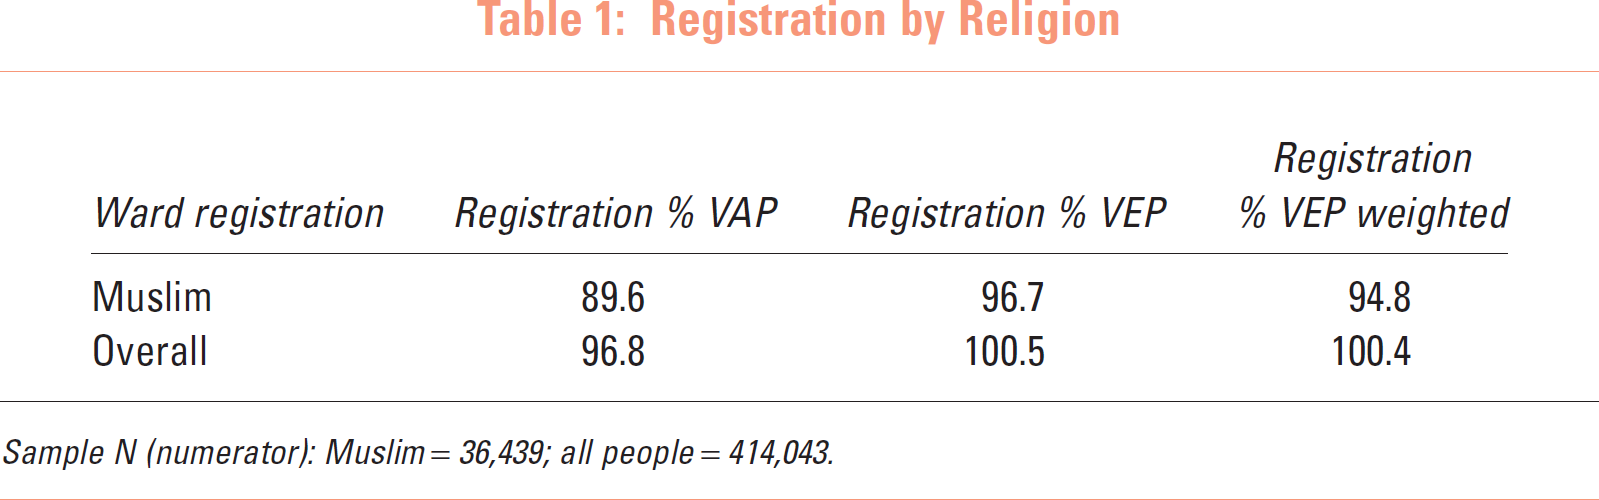
Sample N (numerator): Muslim = 36,439; all people = 414,043.
2001 Muslim Registration Rates
Table 1 shows the estimated registration rates for our sample as a percentage of the voting age population (VAP) and the voting eligible population (VEP) (i.e. before and after adjustments for country of birth). It also provides a weighted estimation of registration as a percentage of VEP for England and Wales (i.e. applying design weights). As a percentage of VAP, Muslims in our sample areas were 7 per cent less likely to be registered than the population as a whole. The overall rate of 97 per cent for our sample areas is very close to other nationally based estimates 12 (Dorling, 2007), and the Muslim rate very close to the Electoral Commission (2005) estimate. However these figures make no allowance for ineligibility due to nationality. The second column however provides the figures after the adjustment described above.
The adjusted figures assume that no persons born outside the UK, Europe or the Commonwealth were eligible to vote. For the Muslim population in particular, it is important to take the number of people born outside eligible countries into account since they constitute a relatively large proportion of the Muslim population. For example, the Electoral Commission research showed that non-registration among Muslims living in the UK for ten years or more was only 6 per cent compared to 14 per cent among all Muslims. Naturally the adjusted rates are higher (97 per cent for Muslims), since the adjustment removes all people born outside eligible countries from the denominator. While the unadjusted figures may understate registration somewhat (due to the existence of genuine ineligibles), the adjusted rates may overstate registration since many persons born in ineligible countries are naturalised or enjoy dual citizenship. 13 Unfortunately, there is no basis on which to estimate the proportion of this population who are eligible to register to vote (Electoral Commission, 2005). In addition both sets of estimates may be partly inflated by redundancy in the register or by census undercount. What is clear from both the VEP and VAP estimates is that the Muslim rate is lower than that of the overall population, but that the adjustment for ineligibility is more important for the Muslim population. This reflects the greater number of Muslims counted in the census who are born outside eligible countries (e.g. in North Africa and South-East Asia) and who could not be expected to be on the register. If we take the non-adjusted rates as a baseline, over half of the difference between Muslims and the rest of the population is accounted for by differences in country of birth.
The discussion above relates to areas included in our sample. However simple design weights proportional to the sampling fraction for each stratum can be applied in order to provide estimates for England and Wales. The third column in Table 1 provides estimates for registration as a percentage of VEP after weighting. The estimates are lower for Muslims than the unweighted estimates since, as we shall see below, Muslim rates in areas with fewer Muslims tend to be lower, and these are the areas with larger design weights. 14 The weighted estimates indicate that Muslim registration as a percentage of VEP is approximately 95 per cent, but is likely to be slightly lower than this due to issues of naturalisation discussed above. The estimate is approximately five percentage points lower than that for the population as a whole, indicating a deficit in Muslim registration, albeit smaller than that found for Pakistanis and Bangladeshis in the 1980s and 1990s (Anwar, 1998).
Segregation and Registration
The primary purpose of this article is to examine the relationship between the concentration of Muslim population and the geographical variation in Muslim registration rates. It was stated above how the mobilisation thesis would predict higher rates of registration in predominantly Muslim areas. This is explored in Table 2 which, like Table 1, shows the rate of registration of the overall population and the Muslim population, but aggregating OAs according to the percentage of the population made up by Muslims.
Registration Rates as Percentage of VEP by % Muslim Population in Output Area (Unweighted)
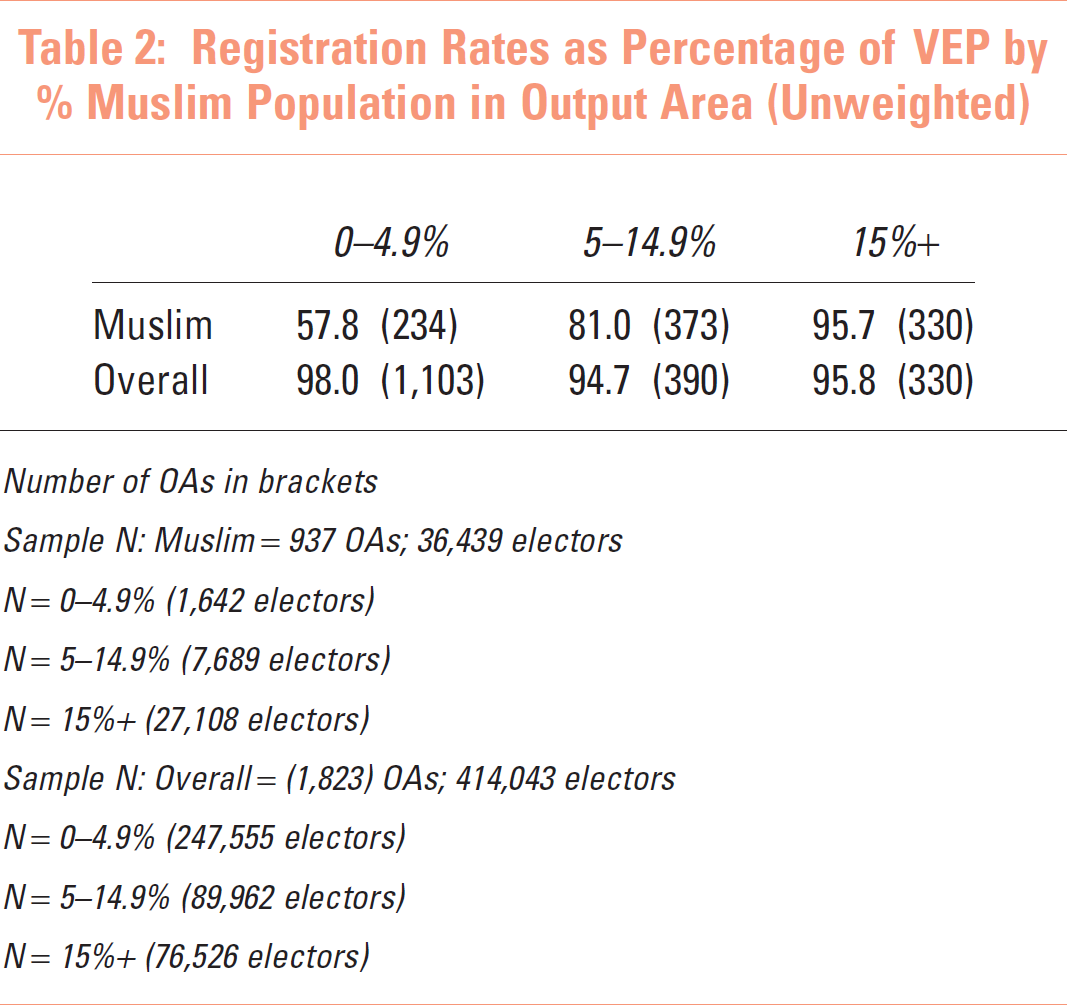
Number of OAs in brackets
Sample N: Muslim = 937 OAs; 36,439 electors
N = 0–4.9% (1,642 electors)
N = 5–14.9% (7,689 electors)
N = 15%+ (27,108 electors)
Sample N: Overall = (1,823) OAs; 414,043 electors
N = 0–4.9% (247,555 electors)
N = 5–14.9% (89,962 electors)
N = 15%+ (76,526 electors)
The table shows a very strong relationship between the size of the Muslim population and the levels of registration for Muslims. In areas with very small Muslim populations, Muslim registration as a percentage of VEP is under 60 per cent, yet this rises to 81 per cent in more mixed areas, and as high as 96 per cent of the voting age population in areas with more than 15 per cent Muslims. The same pattern is not found for the population as a whole. In other words, areas with large Muslim populations are not simply high registration areas (in fact if anything the reverse is true); rather there appears to be something going on in these areas which is affecting specifically the Muslim population. This is our first piece of evidence in support of the mobilisation hypothesis. In other words, registration appears to be affected by belonging to a ‘religious enclave’ and therefore the potential mobilising effect of living in cohesive communities. Conversely the relatively isolated are more likely to be excluded from the democratic process.
Modelling Registration
In order to confirm this relationship and take other factors which might affect registration into account we can use a simple regression modelling approach. Before we can do this we must define the unit of analysis. Census OAs are rather small units for which to estimate reliable registration rates so valid OAs (see above) originating from the same census ward were aggregated. 15 As well as allowing us to model rates based on sufficiently large denominators, this also permitted us to match our registration estimates with the widest possible range of (ward-level) Census 2001 variables. The dependent variable in the following models is the registration rate based on VAP, but later we introduce the proportion born outside eligible countries to examine the impact of eligibility. All models are weighted by the population to reflect the variation in the size of our units of analysis.
The results of a simple bivariate OLS regression are presented in Table 3. While the relationship between the proportion of the population who are Muslim and overall registration is insignificant, the opposite is true for Muslim registration. For every 10 per cent increase in the Muslim population, Muslim registration increases by 4 per cent while overall registration falls by less than 1 per cent. Furthermore, in terms of explaining Muslim registration, this one variable alone accounts for over one-quarter of the total variance, while it is a poor and insignificant predictor of overall registration. Whether or not these relationships arise directly from the mobilisation processes described above we cannot prove here, but it is clear that registration of Muslims is higher in the areas where Muslim communities are most concentrated.
OLS Regression Models of Ward Registration (Unadjusted for COB) Controlling for % All Muslim in the Ward
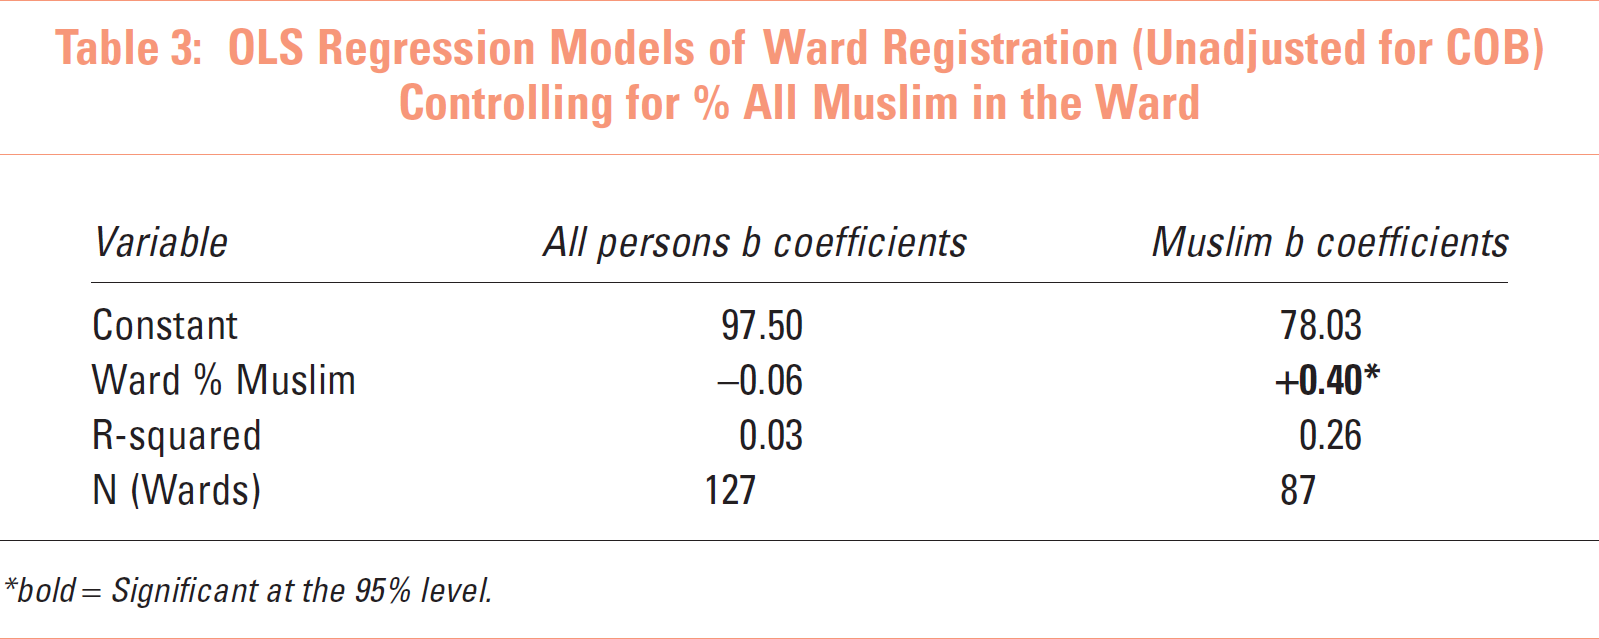
bold = Significant at the 95% level.
So far we have demonstrated not only that registration rates are generally lower for Muslims, but that these are affected by the ineligibility of large proportions of the population, and in keeping with the mobilisation hypothesis, rates are highly variable according to the religious composition of the area. To substantiate the latter finding we now test whether this might be explained by the percentage of ineligible voters in each group or by the socio-economic composition of the areas, rather than the religious composition. Again we use simple linear regression models of registration while controlling for ineligibility due to birthplace and a number of socio-economic indicators measured at the census ward level, selected according to their theoretical relationship with registration, and on the basis of previous evidence. These include variables measuring resources (e.g. per cent with degree-level education); social connectedness (e.g. home ownership, non-migrants, students); relative deprivation and affluence (e.g. unemployment, long-term illness, manufacturing, social class structure, multiple car ownership); and demographic structure (e.g. young electors, older electors).
Due to collinearity between various indicators we attempted to describe the social profile of wards using principal components analysis (PCA), conducting separate analyses for the overall population and for the Muslim population. 16 For the overall population, three factors produce a rather clear pattern describing the characteristics of wards. 17 Component 1 appears to capture the class structure; component 2 describes the level of deprivation or affluence; and component 3 captures the stability of the population or social connectedness (see Table A3). The equivalent analysis for Muslim populations, with variables measuring the characteristics of the Muslim population, uses census cross-tabulations of each variable by religion. This produces a similar structure to the overall population (see Table A4), except for an additional component, component 4, which appears to reflect the established or ageing character of areas with a particular emphasis on older electors (over 60). 18
Component scores were introduced as variables in our regression models of overall and Muslim registration, together with the key variable measuring the percentage of the population who are Muslim; the percentage born in ineligible countries; and finally whether one of the three main parties targeted the constituency in which the ward is located. For the main parties, the targeting of seats and the concentration of resources on them has become a central part of their electoral campaign strategy. Targeted campaigning is not just a four-week event, but is carried out months and often years before polling day (Denver et al., 1998). In order to capture such pre-election activity we prefer the target variable to party spending which only refers to campaign expenditure in the four-week election period. We believe there is good reason to expect target status to be associated with registration since parties and media will pay more attention to target seats in the inter-election and campaign periods, possibly encouraging supporters to register to vote.
The results for the overall population model are shown in Table 4. 19 Notably, the percentage of the population that is Muslim remains insignificant, but registration is affected by the class structure of the ward (more working-class areas have lower registration), the level of affluence and the percentage of the population born in ineligible countries. No other variables were found to be significant, but these three variables alone account for nearly 40 per cent of the variance. As would be expected, living in a working-class area has a negative effect on registration, while affluence is positively associated with registration. Notwithstanding this, the more people born in ineligible countries the lower the level of registration in the population.
Turning to the Muslim model, Table 5 shows that the percentage of the population that is Muslim remains significant and positive after controlling for the other characteristics of the ward. The effect is, however, smaller than in the bivariate model (Table 3), indicating that at least some of the impact is attributable to socio-economic and demographic factors. The other factors that proved significant were the class structure of the ward (more working-class Muslim areas having higher levels of registration); the percentage born in ineligible countries (in the direction anticipated); and whether the main parties targeted the seat (as predicted, non-targeting results in lower political activity which suppresses registration). The class effect is interesting as ostensibly it seems counter-intuitive. However, in light of the mobilisation hypothesis outlined above this does appear to make sense: Muslim immigrants, especially from Pakistan and Bangladesh, were initially recruited into working-class manufacturing occupations (e.g. textiles) and predominantly Muslim areas still tend to be very much working class (Peach, 2006). Indeed in our data we found a significant correlation between the percentage Muslim and the component 1 score (‘working class’) of 0.37. The fact that both the percentage of the population that is Muslim and the score on component 1 are positively related to Muslim registration is entirely consistent with the mobilisation hypothesis, while casting serious doubt on the alternative marginalisation hypothesis. It seems that the more economically successful and perhaps acculturated Muslim middle class, living outside the main centres of Muslim population, are least likely to be registered to vote. These four variables successfully explain over half the spatial variation in Muslim registration.
All People OLS Regression Models of Ward Registration (Unadjusted for COB) Controlling for Socio-economic and Political Indicators
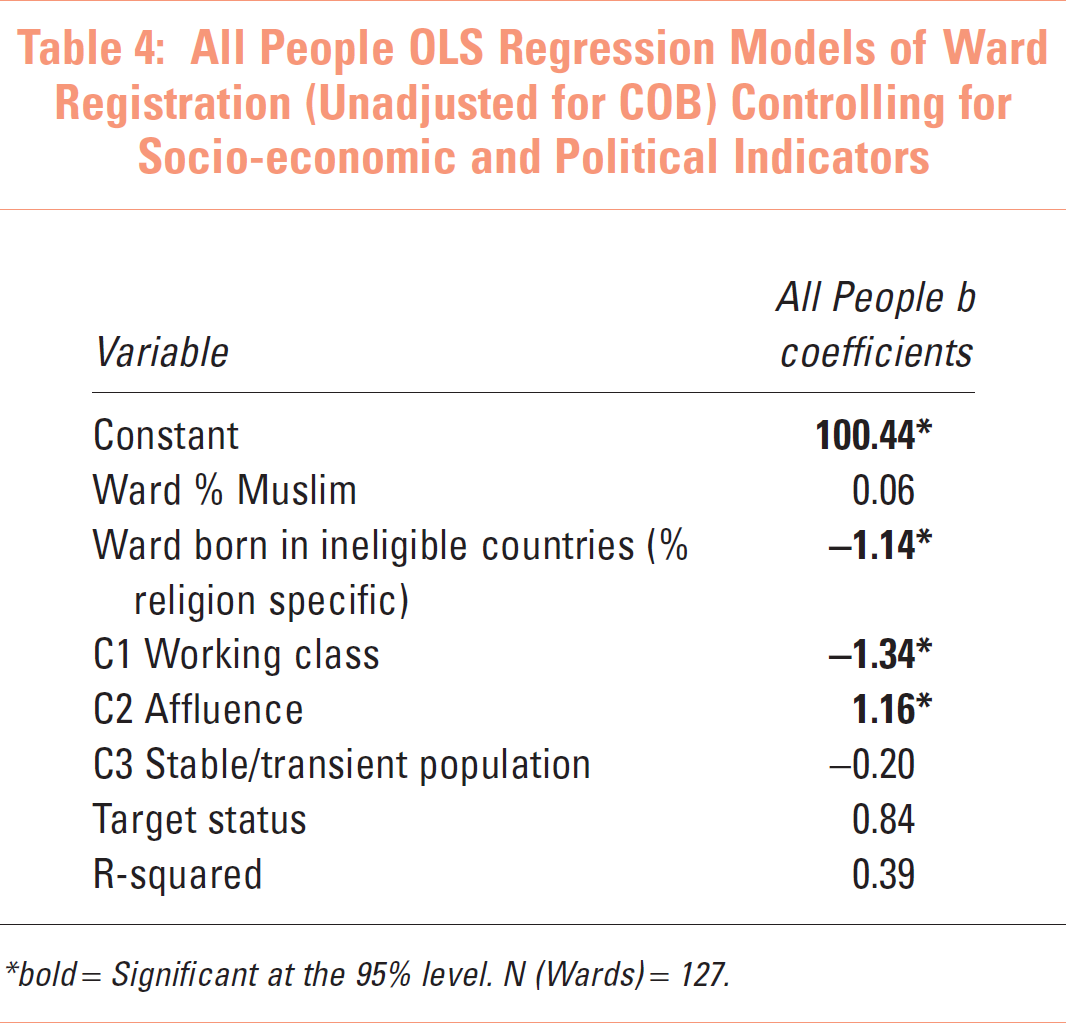
bold = Significant at the 95% level. N (Wards) = 127.
Muslim OLS Regression Models of Ward Registration (Unadjusted for COB) Controlling for Socio-economic and Political Indicators
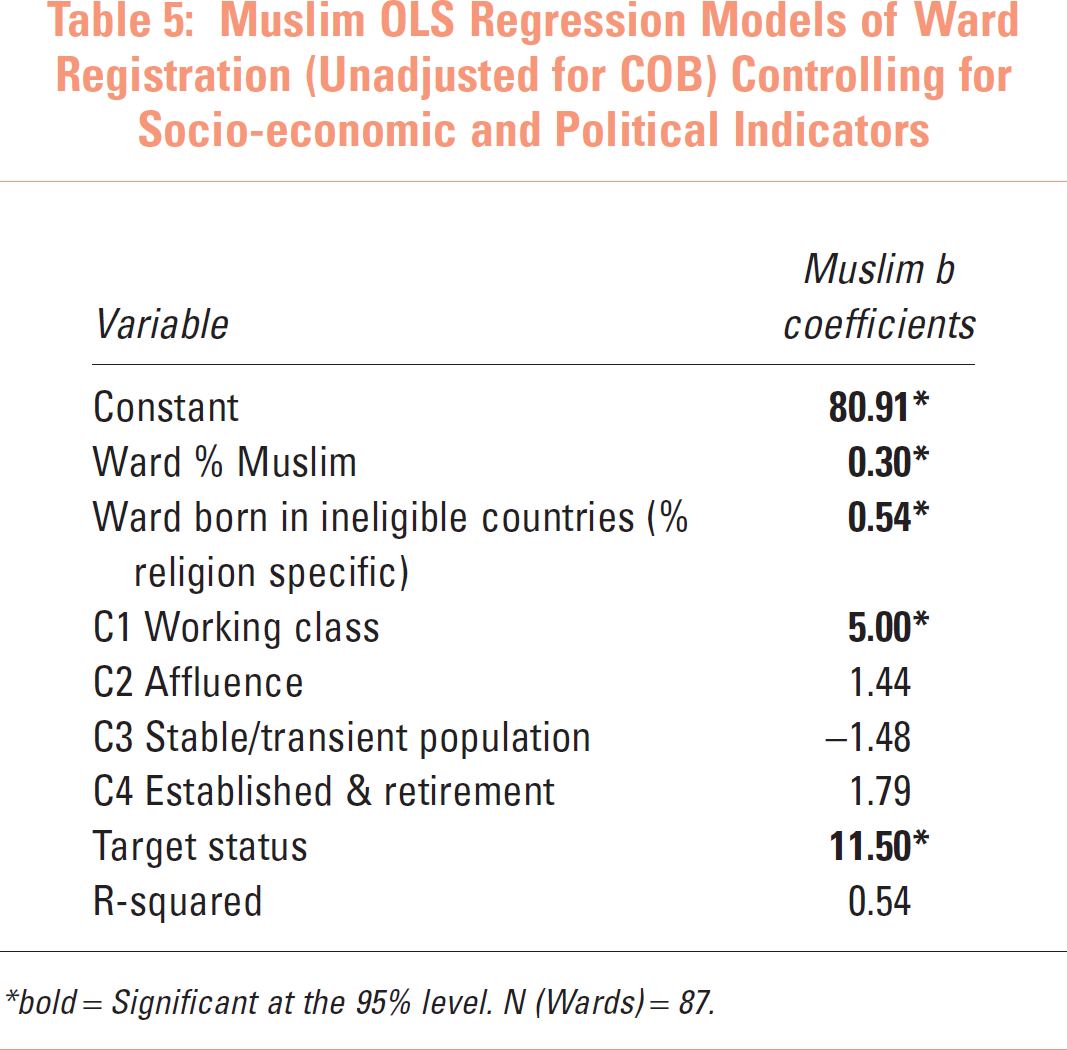
bold = Significant at the 95% level. N (Wards) = 87.
Discussion
This article had three main aims. First we sought to establish an accurate estimate of the Muslim registration rate using data from the 2001 Census of Population and a sample of electoral registers. As some (but by no means all) previous research has suggested, we found that Muslim registration rates were indeed significantly lower than the equivalent rates for the population as a whole. This is in contrast to turnout rates for the same general election for the same sample of areas, which showed no significant difference between Muslim turnout and the overall rate (Cutts et al., 2007). This pattern is a mirror image of findings from the US where precinct-level registration levels have been found to be positively associated with Asian populations, while the equivalent for turnout is negative (Pelissero, Krebs and Jenkins, 2000). Of course, US registration law is different to the UK as is the nature of the populations in the comparison.
Second, we sought to explore the relationship between the geographical concentration of Muslims and their registration levels. Our findings are completely consistent with the mobilisation hypothesis: we found that Muslim registration, like turnout, increased as the proportion of the local population that were Muslim increased, and this survived controls for various socio-economic, demographic and political features of those areas. There are a number of possible explanations for this relationship, though to establish properly the causal processes requires further research. We believe the most plausible explanations relate to the process of community mobilisation generated through social connectedness and community networks, formal and informal, secular and religious. Added to this, as ethnic community theories predict, it is likely that levels of Muslim consciousness will be greater where Muslims are living in more cohesive communities.
The third aim of the article was to explain variations in Muslim registration with reference to various factors. We have already discussed the role of the spatial concentration of Muslims, but it is worth noting that around half of the impact of this variable can be accounted for by other social, economic and political characteristics of area. Those factors that proved to be important included whether the seat was a party target in 2001 or not and the proportion of the population born in ineligible countries. The latter, perhaps not surprisingly, proved to be highly significant, and indeed the same variable accounted for around half the absolute difference between overall registration rates and Muslim rates. The other significant factor was social class, with more working-class Muslim areas displaying higher levels of registration. This underlines the potentially reinforcing effects of class and minority status in influencing political behaviour.
These findings have wide-ranging implications for policy-makers and political actors. Following social unrest in English northern cities in 2001, increasing residential segregation was pinpointed as the long-term cause (Cantle, 2001). Separate social and cultural networks had developed in towns like Bradford, which was becoming ever more divided along race, ethnic, religious and social class lines (Ouseley, 2001). The rise of ‘Islamophobia’, growing hostility to South Asian populations, particularly Muslims, and the depth of polarisation in English cities led the UK government to require each local authority to develop community cohesion plans.
Yet such a debate is occurring within a climate of misleading stereotypes which are proving unhelpful to the development of policy (Phillips, 2002; Simpson, 2004). Notwithstanding the ‘myth’ of self-segregation (Simpson, 2004), in relation to political engagement, segregation is clearly not the problem it is perceived to be. While the focus of policy-makers – for example in the Commission for Integration and Cohesion – has been areas of high concentration, it is areas of low concentration where minority groups are becoming disengaged. Muslims who have become geographically disconnected from their own social and cultural group have become less inclined to register to vote or indeed to turn out to vote (Fieldhouse and Cutts, 2007). The ‘hidden exclusion’ of Muslims in non-deprived, overwhelmingly white areas is likely to increase as the dispersal of such groups from areas of high concentration becomes more rapid over time (Phillips, 2002; Simpson, 2004).
However, public bodies such as the Electoral Commission are not unaware of the need to rethink policy initiatives and practices. A recent report on electoral registration claimed that being sensitive to growing diversity among local populations is one of the main challenges facing local authorities (Electoral Commission, 2005). Our findings suggest that registration and voter engagement campaigns need to reach beyond geographically defined notions of ‘Muslim communities’ and to target Muslim voters in areas with lower concentrations of Muslims more effectively. In short, it is incumbent on both national and local government, and leading public bodies, to refocus their policy initiatives to ensure that such groups do not become isolated from the political process.
Where Muslims become disconnected from traditional social and cultural ties, political parties could be one mechanism through which such groups in non-deprived areas could be engaged. However, the long-term decline in local party activism suggests that local party socialisation and mobilisation in themselves are unlikely to reverse this ‘hidden exclusion’. Muslims in lower-concentration areas are likely to be disconnected from the close links forged between political parties (particularly Labour) and Muslim communities in ‘Muslim areas’. They are also immune from subsequent mobilisation strategies that are often used by the parties and interest groups in high-concentration areas at election time. Not only does the ‘first-past-the-post’ electoral system allow the electorate in non-marginal seats to be largely ignored, but the explicit targeting of ethnic minority voters in so-called ‘ethnic marginals’ may further marginalise those living outside these areas. This may be exacerbated by the fact that Muslims are even less likely to hold an elected office at either the local or national level in these areas than in communities where social and cultural ties are strongly embedded (Le Lohe, 1998).
For academics, the challenge is to redress the emphasis on the negative impacts of segregation or ‘ghettoisation’ and also to consider the positive aspects of community cohesion generated by spatial concentration, and the potential negative aspects of dispersion including ‘hidden exclusion’. This evidence, and similar findings relating to electoral turnout (Cutts et al., 2007), provide some initial indication that patterns found in the US showing that diversity and immigration may have short-term damaging effects on community cohesion (Putnam, 2007) may not be simply mirrored on this side of the Atlantic (see also Home Office, 2005). We have provided evidence that these processes exist, but to understand better the driving forces behind the empirical relationships shown here, scholars need to adopt a variety of research methods including in-depth qualitative studies of political engagement and community networks as well as extensive quantitative approaches and specialised methods such as social network analysis. Such research would address questions about social identity and exclusion and kinship relationships and gauge their attachment to social and cultural networks in the community.
That Muslim registration is so closely connected to the size of the local Muslim population indicates that registration, like turnout, is affected by the forces of mobilisation. This is a novel and important finding and complements parallel evidence that ethnic, racial or indeed religious population clustering can bolster the participation levels of minority communities (Fieldhouse and Cutts, 2007; Schlichting et al., 1998). Living among people of a similar faith seems to have a mobilising rather than marginalising effect, and not just on turnout but on registration too.
Appendix
Original Stratified Random Sample
Additional Note
A step-by-step approach including the use of name recognition software and the calculation of the registration rate (in addition to that stated in the text) is available from the authors by request. Most details can be found at: http://www.ccsr.ac.uk/publications/working/ccsr-2006-07.pdf
Table A2 provides some additional information about the distribution of the dependent variable used in the modelling process.
Descriptive Statistics for the Dependent Variable (Overall Registration)

Overall Profile of Wards – Principal Components Analysis
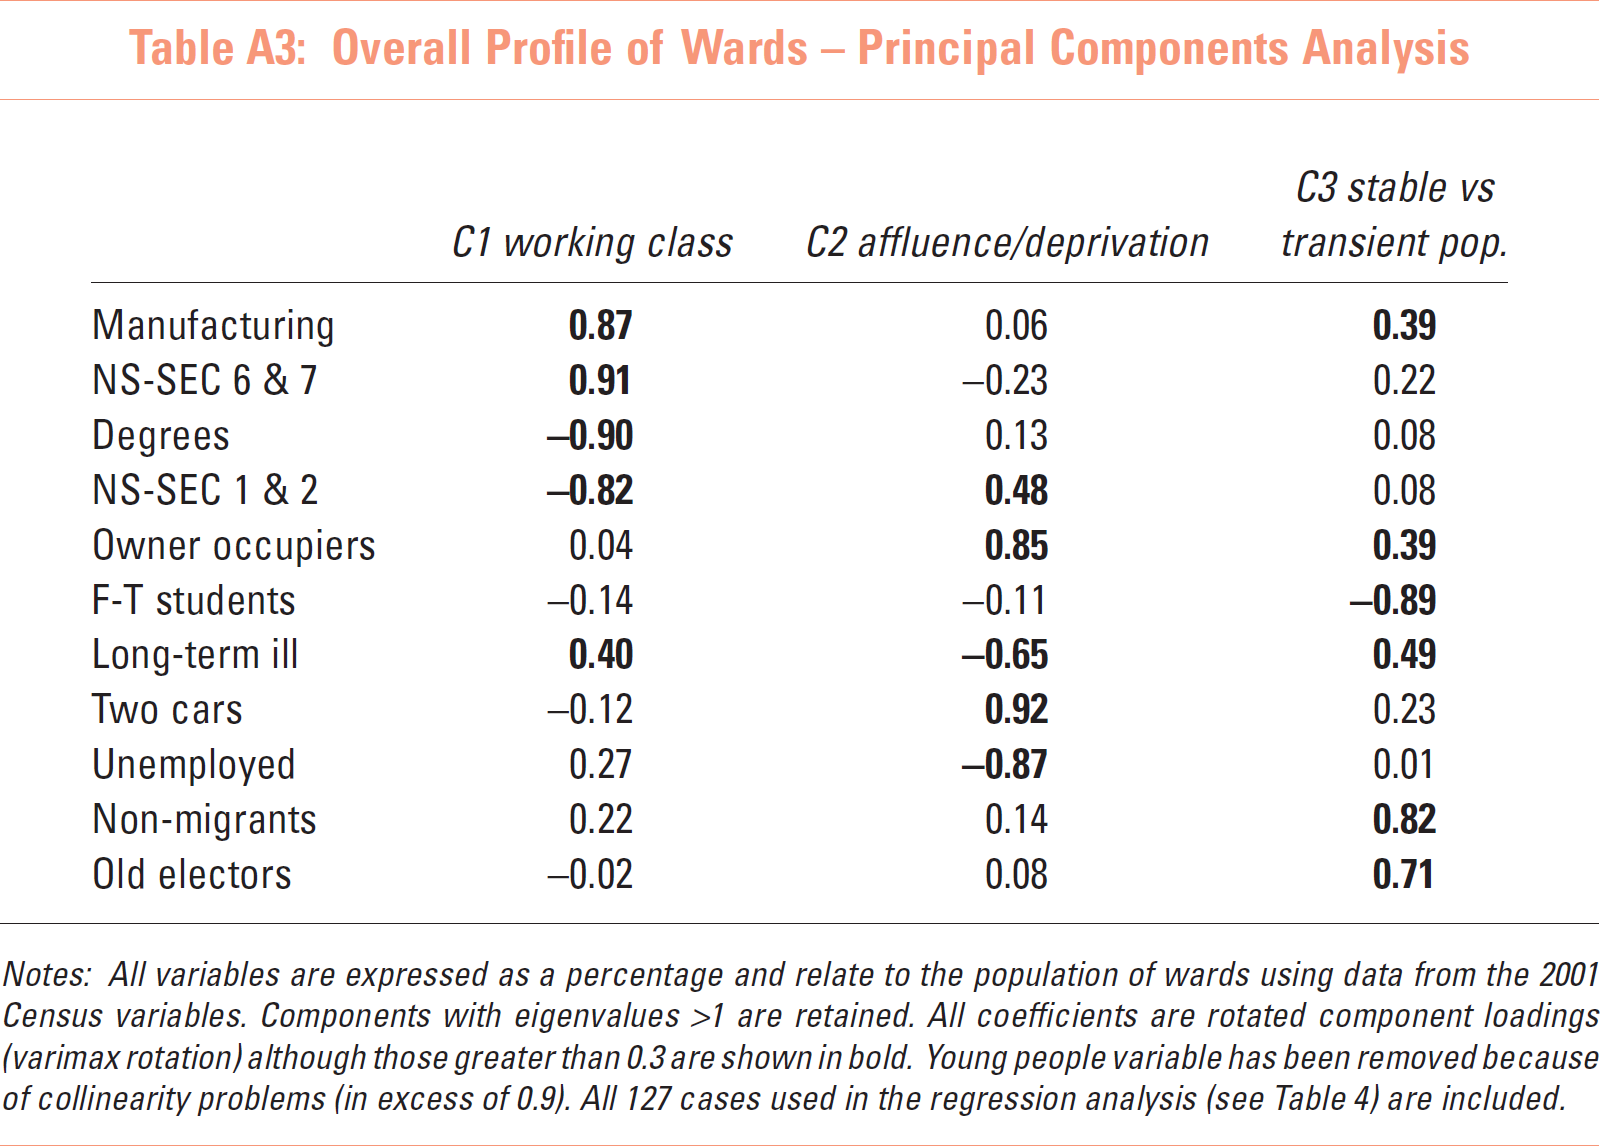
Notes: All variables are expressed as a percentage and relate to the population of wards using data from the 2001 Census variables. Components with eigenvalues >1 are retained. All coefficients are rotated component loadings (varimax rotation) although those greater than 0.3 are shown in bold. Young people variable has been removed because of collinearity problems (in excess of 0.9). All 127 cases used in the regression analysis (see Table 4) are included.
The Census Variables used in the PCA and All People Regression Analysis (Ward Level)
Muslim Profile of Wards – Principal Components Analysis
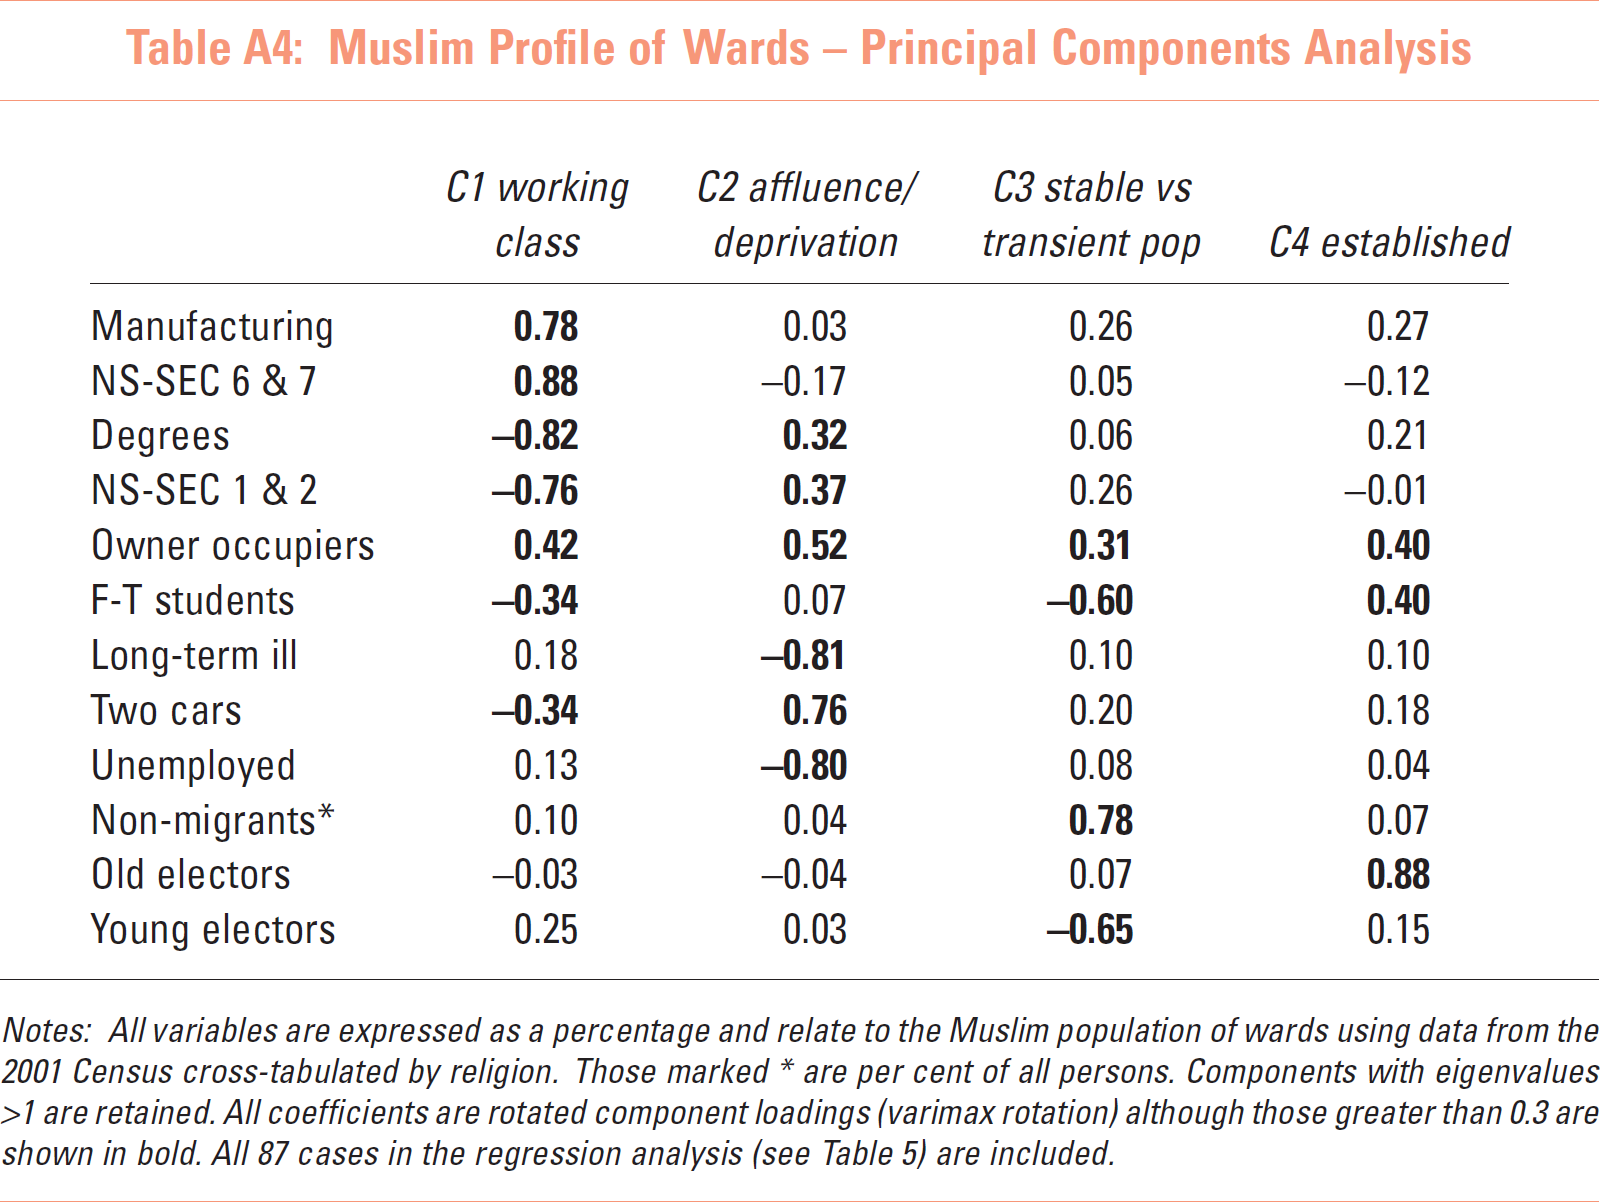
Notes: All variables are expressed as a percentage and relate to the Muslim population of wards using data from the 2001 Census cross-tabulated by religion.
Those marked are per cent of all persons. Components with eigenvalues >1 are retained. All coefficients are rotated component loadings (varimax rotation) although those greater than 0.3 are shown in bold. All 87 cases in the regression analysis (see Table 5) are included.
The Census Variables used in the PCA and Muslim Regression Analysis (Ward Level)
Footnotes
The research team would like to thank the Joseph Rowntree Foundation and the University of Manchester Research Support Fund for their support. 2001 Census data for England and Wales have been provided by the Office for National Statistics and are copyright of the Crown.
1
Much previous research is based on ethnicity. The evidence cited from Anwar and Saggar pertains to the predominantly Muslim Pakistani and Bangladeshi communities.
2
Mathews and Prothoro found a negative relationship between Negro population size and registration in Southern states.
4
There are very few areas in Britain where Muslims make up a majority of the population and thus the higher the proportion of the population which is Muslim, the greater the level of diversity. Other studies have used the percentage of the population not belonging to the subject's own ethnic or racial group as an indicator of group threat, but have found this has a depressing effect on turnout (e.g. see Leighley and Vedlitz, 1999).
5
![]() estimates from the April 2002 electoral roll that the electorate of England and Wales would have been some 39,321,217 people or 93.1 per cent of the population aged fifteen and over on census day a year earlier. Such estimates are made using the initial census data. It is also assumed that in each constituency half of all attainers (those who turn 18 in the coming year and are eligible to vote) would have turned 18 in the 6 months between October and April.
estimates from the April 2002 electoral roll that the electorate of England and Wales would have been some 39,321,217 people or 93.1 per cent of the population aged fifteen and over on census day a year earlier. Such estimates are made using the initial census data. It is also assumed that in each constituency half of all attainers (those who turn 18 in the coming year and are eligible to vote) would have turned 18 in the 6 months between October and April.
6
Due to the possibility of dual and acquired citizenship, ONS assumed that people born in countries outside Europe and the Commonwealth were eligible to be registered.
7
Valid OAs were defined as those where the number of residential postcodes identified in our sample, and matched to an OA, exactly matches the number of residential postcodes in the AFPD. Ninety-seven per cent of electors were successfully allocated a postcode, and 1,823 out of 3,192 OAs were retained as valid under the criteria described, covering 74 per cent of electors in the sample.
8
The One Number Census methodology should ensure that, after adjustments for non-response, the census figures cover 100 per cent of the population to a high level of precision, plus or minus 0.2 per cent (see http://www.statistics.gov.uk/census2001/onc.asp; also Brown et al., 2006). Notwithstanding this, as with any estimate of registration, our estimates are subject to any systematic bias or localised errors in the census count.
9
Eligible countries used in the country of birth adjustment were as follows: United Kingdom, Republic of Ireland, Channel Islands, all European Union countries, Nigeria, countries in South and East Africa, countries in South Asia, Canada, Caribbean and West Indies and Oceania countries. Estimated ward-level rates of ineligibility were applied evenly across all OAs within each ward.
10
Muslims were identified as all Muslims according to the census religion question plus those whose religion was not stated but whose ethnic origin was Pakistani or Bangladeshi.
11
Only OAs where the denominator for a group is greater than seven are included in the aggregations of each subgroup as small census cells were subject to rounding for statistical disclosure control reasons, making them unreliable (Rees et al., 2005). Empirical analyses show that cells with counts of six and under are affected by rounding. Because here adjustments are made for deaths and attainers, cells slightly greater than six were also affected. We therefore employed a cut-off at seven.
12
13
The non-Asian unweighted rate after country of birth is adjusted slightly exceeds 100 per cent, confirming that the adjustment removes excess people from the denominator.
14
Design weights are inversely proportional to sampling probability, and because we over-sampled in predominantly Muslim areas (using stratification) areas with fewer Muslims have larger weights.
15
Our register relates to electoral wards in use in 2001, which due to re-districting differ significantly from census wards which were based on 2003 statistical wards. Because 67 of the 97 wards had changed we use aggregations of OAs and not electoral wards. The resulting units are not all complete wards but aggregations of OAs originating from the same census ward. There were 127 such units in total.
16
There was evidence of collinearity between the census-based variables in both the all-people and Muslim analysis. Regarding the former, manufacturing and NS-SEC 1&2, NS-SEC 1&2 and NS-SEC 6&7, two cars and unemployment were all negatively related (correlation coefficients in excess of −0.75) while degree and NS-SEC 1&2, and two cars and home-ownership were positively related (correlation coefficients in excess of +0.80). Similar patterns existed in the Muslim analysis (e.g. degree and NS-SEC 1&2 in excess of +0.80 and degree and NS-SEC 6&7 above −0.70). To overcome this we use a principal components analysis to generate orthogonal indicators of the different dimensions of socio-economic and and demographic status.
17
Three factors or components were required to reproduce 82 per cent of the variation in the original data.
18
Four factors were required to produce 72 per cent of the variance in the original variables.
19
We have conducted numerous diagnostic tests on both the models. First, there is no evidence of collinearity. The Overall model (Table 4) has average VIF of 1.83 (greater than 10 poses a serious problem) and the tolerance statistic is well above the 0.2 criterion. Similarly, the Muslim model (![]() ) has an average VIF of 1.96 and the tolerance statistic is well above the stated guideline. For both models the variance proportions are large on the same small eigenvalues. Each predictor also has most of its variance loading on to a different dimension – both are classic examples of little or no multicollinearity. We also carried out various outlier tests (using distance – Cooks Distance – and influence statistics – DFbeta and DFfit statistics) and tests for heteroskedasticity in the data and found no significant violations of established guidelines in either model.
) has an average VIF of 1.96 and the tolerance statistic is well above the stated guideline. For both models the variance proportions are large on the same small eigenvalues. Each predictor also has most of its variance loading on to a different dimension – both are classic examples of little or no multicollinearity. We also carried out various outlier tests (using distance – Cooks Distance – and influence statistics – DFbeta and DFfit statistics) and tests for heteroskedasticity in the data and found no significant violations of established guidelines in either model.