
Abstract
A growing body of literature has found that photographs of politicians can influence electoral preferences. In this article we assess whether candidates rating higher on electoral attractiveness perform better in a series of hypothetical elections, and whether their advantage is magnified when their appearance is printed not only on campaign materials but also on ballot papers. We find that candidate appearance only had a significant impact on vote choice when photographs were printed on ballot papers, and even then there was an impact on only some of the elections, notably those pitting male against female candidates. Photographs had most impact on the choices of those least interested in politics and least likely to vote, and magnified a tendency (among voters of all ages) to favour younger candidates and to penalise older candidates. Findings suggest that the addition of photographs to ballot papers could affect the outcomes of marginal British constituency races.
In November 2005, Harriet Harman, then the UK government's Minister of Constitutional Affairs, argued that ‘ballot papers should eventually be printed with our photographs on them so that people know who we are and that we are prepared to put ourselves forward’ (House of Commons, 2005). The inclusion of candidate photographs on ballot papers is standard practice in South Africa and in several new Balkan democracies, and has recently been introduced in the Republic of Ireland. In 2003 it was proposed for piloting in the UK by the Electoral Commission (2003a; 2003b), which remains sympathetic to the idea (Horne, 2008), and the possibility is likely to rise up the policy agenda with the increasing use in the UK of electoral systems like Single Transferable Vote (STV) – used in the 2007 Scottish local elections (and widely favoured for subsequent Scottish Parliament elections) – which present voters with long lists of candidates, including several from the same party (Arbuthnott, 2006).
The government initially turned down the Electoral Commission's proposal, but its stated objections were matters of administration, notably increased printing costs, rather than any more fundamental objection to the idea (Department for Constitutional Affairs, 2004). 1 Meanwhile, MPs debating the issue were preoccupied with the possibility that candidate photographs might be manipulated. As Liberal Democrat David Heath put it, ‘we need to be extremely careful that the image of candidates standing for election is not enhanced to allure voters in the polling booth’ (House of Commons, 2005). At the very least, candidates may be less than assiduous in keeping their photographs up to date. Yet, even without manipulation, the inclusion of photographs on ballot papers could give a significant advantage to some candidates. Such an advantage need not be huge to be important: if appearance can benefit or cost a candidate 1 per cent of the vote, then it could have swung 40 constituencies in the 2005 election.
In this article we describe and present results from a rigorous experimental test of the impact of ballot paper photographs on voting behaviour. We use an experimental design based on that developed by Shawn Rosenberg et al. (1986), in which participants vote in a series of hypothetical elections. Our central aim is to test whether candidates whose appearance is rated more positively poll better in such elections, and in particular to test whether any such lead is widened if photographs are included on ballots. We also address subsidiary research questions, about the conditions under which ballot photo effects are strongest, and about the impact of photographs on other stereotyping, specifically age and gender. This article begins with some theoretical considerations about why candidate appearance might be expected to have an impact, especially if photos are printed on ballot papers. We then set out the experimental design and the results. The article concludes with a discussion of the implications of our findings, both for impression formation in elections, and in turn for ballot design.
Candidate Appearance and Voting in Britain
There is compelling social psychological evidence that we form impressions of a person's character based on immediate impressions of their appearance, and especially their facial appearance (Eagly et al., 1991; Willis and Todorov, 2006; Zebrowitz, 1997). There is no reason to suppose that this will not happen equally with politicians; indeed, Rosenberg et al. (1986) found that voters were prepared to judge a person's suitability for office on the basis of their facial appearance, and Caroline Keating et al. (1999) showed that the personalities of even the most familiar US presidents were judged differently when their facial images were subtly manipulated. Furthermore, these judgements about candidates can then play a part in determining their electoral performance. Rosenberg et al. (1986), using an approach on which we model our own experiments, set up hypothetical elections between candidates rated high and low on the basis of physical appearance, and showed that the former performed significantly better (see also Rosenberg and McCafferty, 1987). Turning to evidence from real elections, Alexander Todorov et al. (2005) report a study in which respondents were given one-second exposure to pairs of photographs, and asked for their preference between each pair. These pairs were in fact competing candidates in recent US Congressional races, and the candidate whose photograph was preferred by study participants had won in 69 per cent of those races. These results strongly suggest that an appearance advantage pays electoral dividends (see also Ballew and Todorov, 2007; Little et al., 2007).
In terms of dual process theories of social psychology (Chaiken and Trope, 1999), these impressions based on appearance are formed via ‘system 1’ processing – that is, more or less instantly, unconsciously and automatically (Winston et al., 2002). Appearance probably plays only a minimal role in ‘system 2’ processing – our subsequent more conscious thought and judgements – about a candidate. We might therefore expect any advantage accruing to a candidate from their appearance to fade as voters consider their background, their policies, their record and so on. Yet the instantaneous judgements formed within milliseconds of exposure to a face are highly durable (Willis and Todorov, 2006). In any case, such more detailed consideration of candidates is not necessarily all that common. In the US context, the sheer number of elections means that even the most diligent voters are called upon to choose between candidates about whom they know little. Moreover, many voters are not diligent, and consequently lack rudimentary political information about candidates, even for high-ranking posts (Delli Carpini and Keeter, 1996, ch. 2). For many, the remote nature of politics makes the evaluations of candidates for office a sufficiently unimportant task to be rationally delegated to the ‘system 1’ processing associated with appearance effects. In short, appearance is used as a heuristic by voters (Lau and Redlawsk, 2006; Olivola and Todorov, 2010). For those called upon to reach a judgement about a politician based on limited information, impressions of image can serve as a cognitive short cut, much like that politician's gender, race, religion and so on (Cutler, 2002; McDermott, 1997; Leigh and Susilo, 2009).
While it is crucial to note the especially prominent role played by candidates in the US, there is growing evidence that image can still play an important role in systems where party is traditionally more salient than candidates. In Germany, for example, Ulrich Rosar et al. (2008) found that attractive constituency candidates performed better in a Land election, attributing the effect to the ‘omnipresence’ during the campaign of posters with photographs of candidates. Similarly, in Australia, Amy King and Andrew Leigh (2007) found that the more ‘beautiful’ the politician on the ‘How to Vote’ information cards at the polling stations, the higher their vote share (see also Leigh and Susilo, 2009). Finally, in Finland, Berggren et al. (2010) found that, in intra-party competition on open lists, better-looking candidates outperformed rivals.
Party is arguably even more dominant in the UK. Prospective candidates are selected by the party and (aside from very recent Conservative experiments at by-elections) there are no intra-party choices in the form of primaries or lists. There are also few posters of individual candidates (beyond party leaders), and no ‘How to Vote’ information cards at the polling stations. Accordingly, voters in the UK are accustomed to choosing between parties, not people, with partisanship routinely emerging as the strongest influence on vote choice in Britain (Butler and Stokes, 1974; Clarke et al., 2004). As such, the one UK study of ballot photograph effects, based on New Deal for Communities (NDC) partnership board elections (Banducci et al., 2008), offers limited guidance for present purposes because those elections were explicitly non-partisan – there were no party labels on those ballot papers. In ‘normal’ British elections, the dominance of party implies that appearance will exert little impact on candidate evaluations and vote choice. Indeed, for many voters appearance will be irrelevant: they apply a simple partisan heuristic when choosing between candidates, neither needing nor using additional information.
Yet the dominance of party in British elections is weakening, and that in turn opens up the possibility of appearance effects. First, the proportion of British voters reporting a party identification has declined sharply in recent decades (Clarke et al., 2004, pp. 177–81). Judging by British Election Study (BES) data, ‘very strong’ and ‘fairly strong’ identifiers constituted 80 per cent of the electorate in 1964, but only 52 per cent in 2005. The percentage of ‘very strong’ identifiers within that group has fallen even more steeply (Clarke et al., 2004, p. 41, pp. 179–81). As strength of partisan identification has declined, other considerations become more salient to vote choice, one of which could be candidate appearance.
Some treatments of de-alignment have suggested that voters, free of partisan loyalties, have adopted a more cognitively demanding judgemental approach, taking into account parties' ideological and policy stances, as well as their records in government (Dalton, 1984; Denver, 2006, chs 4–5). But this fails to take into account the limits on voters' capacity and, more importantly, their willingness to process considerable amounts of political information. Richard Lau and David Redlawsk's (2006) exploration of voters' information searches and decision processes reveals that few voters engage in extensive processing of large amounts of information. Most voters, whether partisan or not, rely quite heavily on simple heuristics when making electoral choices. Again, one such heuristic could be candidate appearance.
In Britain, partisan de-alignment has been accompanied by a process of ideological convergence between the two major parties, Labour and the Conservatives. As a result, party competition has come to centre on parties' ability to achieve consensual goals. This is argued to increase the importance of leadership evaluations, which ‘enable voters to choose who is likely to do a good job in circumstances that are difficult, or impossible, to foresee’ (Clarke et al., 2004, p. 326). Voters thereby use their judgements of leaders' capacities and characters as heuristics for judging the likely performance and priorities of parties (Bartle, 2003; Clarke et al., 2004). Of course, such assessments of leaders are themselves driven in part by those politicians' appearances, not least because media commentary on politics is routinely framed in terms of the personalities, and sometimes even the personal appearances, of rival leaders (e.g. Daily Telegraph, 2010; Sylvester, 2008). That bolsters the argument that judgements about politically relevant traits are made on the basis of non-political characteristics like appearance.
Ballot Paper Photographs and the Impact of Candidate Appearance
Arguments about de-alignment and leaders' personalities bear only indirectly on the question of whether the appearance of constituency candidates might influence vote choice in Westminster elections. Since majorities of voters report seeing election leaflets (e.g. Pattie and Johnston, 2003), most voters are likely to catch at least a glimpse of constituency candidates whose photos invariably feature prominently. The ‘system 1’ nature of impression formation means that, unlike the text on such leaflets, photographs of candidates are an instant source of information of a type that requires no conscious processing effort. Even if a voter only transfers a leaflet from doormat to recycling bin, he or she may glean a clear impression of the candidate from his or her photograph on the front. Indeed, such a politically uninterested voter may enter the polling booth with little more than that impression. Few voters know a great deal about the candidates in their constituency, and many cannot even remember their names (Cain et al., 1987, p. 28). Furthermore, there is considerable evidence that the ‘personal vote’ is a relatively unimportant feature of British elections (Cain et al., 1987; Rallings et al., 1998). Yet this suggests that, on the whole, voters pay rather little attention to candidate communications. And there is a difference between ‘seeing’ an election leaflet and processing information about a face on that leaflet, let alone recalling that information – and being able to link it to a party – some days later in a polling booth. Most importantly, election leaflets include multiple pieces and types of information about candidates – biographical details, achievements, policy stances and so on – which might override or at least modify the judgements made on the basis of appearance. 2 The impact of any piece of information is constrained when received and processed among many others.
Crucially, none of these caveats would apply were photographs to be printed on ballot papers. Every voter would see every candidate. There would be no need to remember any information gleaned from appearance. And aside from candidate name and party, no other information would be supplied. The printing of candidate photographs on ballot papers makes appearance heuristics instantly accessible. It primes voters to consider image.
It is worth re-emphasising that, even though appearance is a powerful cue for judgement, it seems unlikely to override long-held partisan loyalties. 3 Ballot paper photos are liable to have similarly little impact on those voters who, while non-partisan, hold a very clear vote intention. The significant influence of image is likely to be confined to those voters who enter the polling station without a prior commitment to choose one of the candidates. Our point is that this group of voters is not negligible in size, and is growing.
Besides partisanship, political sophistication is another likely moderator of appearance effects. For the less aware and less interested in a topic, accessibility rather than effectiveness is often the most desirable feature of a heuristic (Lau and Redlawsk, 2001). So voters need not believe appearance to be an accurate guide to candidates' suitability for office in order to be influenced by ballot paper photographs. The influence may be subconscious. More generally, as George Marcus et al. (2000; see also Brader, 2005) show, voters are inclined to use heuristics unless jolted by anxiety or enthusiasm into more active consideration of a political choice. So those for whom voting is a routine activity, to which they have limited emotional commitment, seem particularly liable to use appearance as a heuristic. In a study of reactions to the Nixon—Kennedy debate, James Druckman (2003) shows that less politically sophisticated voters gleaned a disproportionate amount of information from television images of that debate. Moreover, King and Leigh's (2007) work in Australia indicates that candidate beauty has a greater influence on voting behaviour among electorates with a higher share of apathetic voters.
Ultimately, though, these theoretical discussions are necessarily speculative. It is very difficult to determine a priori either how many or which voters will be affected by appearance. Hence empirical investigation is crucial.
Age, Gender and Ballot Paper Photographs
So far, we have not considered which features of candidate appearance might deliver an advantage at the ballot box. That issue has been addressed in detail elsewhere (Banducci et al., 2008; Funk, 1999; Rosenberg et al., 1986; Shephard and Johns, 2008; Todorov et al., 2005). Studies have shown that a wide range of traits are inferred from facial appearance, and that several of these – particularly compassion, likeability, authority and honesty – significantly boost the willingness to vote for candidates displaying such traits. This bundle of traits can be summarised by a concept that we refer to as ‘attractiveness’, defined as the degree to which a candidate's appearance has the potential to win him or her votes. It is not simply equivalent to physical attractiveness, although the two are plainly correlated, as indicated by the studies cited above that report a positive correlation between beauty ratings and electoral success. Physical attractiveness is one of the facets of appearance that can make a candidate electorally attractive. In this study, we assess whether candidates rating lower on attractiveness perform worse in our hypothetical elections, and whether their disadvantage is magnified when their appearance is printed not only on campaign materials but also on ballot papers. 4
However, the inclusion of photographs may have other impacts beyond the gains it offers to more attractive candidates. Specifically, it may trigger other stereotypes that are read automatically from appearance. Here, we consider two possibilities: age and gender. MPs have expressed concerns about candidates using out-of-date photographs, indicating that they fear prejudice against more senior candidates (House of Commons, 2005). On the other hand, Susan Banducci et al. (2008) found that older contenders tended to win more positive trait evaluations, and those trait evaluations were in turn strongly influential over vote choice. There is insufficient evidence to judge whether British voters are inclined to prefer older or younger candidates. Clearly, however, in so far as there is such a bias, printing photographs on ballot papers is likely to accentuate it by priming voters to consider age.
Things are somewhat different with gender since that can usually be read from candidate names, and so photographs might be thought to have little additional effect. It may be thought that visual cues will serve to enhance the prominence of candidate gender. Certainly it has been argued that the salience of gender is enhanced by the relative rarity of women candidates (Conover, 1981; McDermott, 1997). However, the rarity value of female candidates has declined quite considerably (Childs et al., 2005). In the 2005 general election, 23 per cent of major party candidates were women. 5 It therefore seems unlikely that a voter would be startled if confronted by a female candidate or her photograph. It is also worth noting that, if ballot photographs of women do prime gender considerations, it is unlikely that this will have a substantial aggregate impact on vote shares. Gender biases tend to cancel out due to voters being inclined to support candidates of the same gender (Cutler, 2002; Smith and Fox, 2001). Hence Banducci et al. (2008) found no evidence that ballot photographs generated a gender effect on voting, even in the non-partisan NDC board elections.
An interaction between gender and attractiveness is also possible, and indeed quite likely according to some MPs in the Standing Committee debate on the issue. They argued that female candidates are judged more by appearance than males, and so will be more affected by the inclusion of photographs on ballot papers. Carol Sigelman et al. (1986) suggest otherwise, though their study was based only on physical attractiveness rather than more directly political traits. More compellingly, Banducci et al. (2008) found no evidence of an interaction between candidate sex and trait evaluations when predicting candidate success in the NDC elections. Women were not judged more by the information gleaned from ballot photographs. Here, we test that null finding in the context of a partisan election – a useful step given prior evidence of a complex interrelationship between gender, party and trait evaluations in Britain (Johns and Shephard, 2007) – and address a further speculative question: does appearance matter more in same-gender or mixed-gender contests? It might be thought that, in the latter, appearance effects will be overridden by more general gender effects. Alternatively, if mixed contests heighten the salience of gender, and if women are judged more by appearance, then perhaps those races will be more influenced by appearance.
So far in this section we have been concerned with the age and gender of the candidate. We might also add age and gender to the list of voter characteristics that might moderate the influence of ballot paper photographs. Gender differences in childhood socialisation have been argued to leave males less likely to use image as a heuristic for political judgement (Hess and Torney, 1967; Jackson, 1992). These differences could mean that females derive more information from, and are perhaps in turn more influenced by, photographs of candidates. With age, the arguments are still more tentative. Ellen Riggle and Mitzi Johnson (1996) provide some evidence that older voters are more candidate-centred in their decision making, which might in turn suggest that appearances influence them more. However, there is a common perception that ‘young people today’ are obsessed with image and personal appearance (see Graber, 2001; Payne et al., 2007). Given the speculative nature of these discussions, we err on the side of caution and specify null hypotheses concerning voter age and gender.
Hypotheses
In the absence of clear pointers from theory or previous empirical research, we are obliged to specify a mixture of directional, non-directional and null hypotheses. We begin with the basic hypotheses about the impact of attractiveness on the results of our experimental elections:
H1a: When photos are on election flyers but arenot on ballot paper photographs, candidates rated higher on attractiveness perform better in the experimental elections.
H1b: When photos are on election flyers and are on ballot paper photographs, candidates rated higher on attractiveness perform better in the experimental elections.
The next set of hypotheses concern the types of voter likely to be more influenced by appearance, and thus especially by ballot paper photographs:
H2: The tendency to support attractive candidates is …
stronger among non-partisans
stronger among those less engaged with politics
unrelated to voter gender
unrelated to voter age.
Then we consider candidate characteristics, first those relating specifically to attractiveness:
H3a: The impact of appearance differs according to the gender composition of the contest.
H3b: These differences are greater when ballot paper photographs are included.
And second, those relating to more general gender and age biases:
H4a: Any tendency to prefer candidates of a particular gender is magnified when ballot paper photographs are included.
H4b: Any tendency to prefer candidates of a particular age is magnified when ballot paper photographs are included.
Next, we describe the data and methods used to test these hypotheses.
Data and Methods
Prior Exploratory Study
Before setting out the experimental study in more detail, it is necessary briefly to describe the earlier exploratory phase of our research, because its results provide the basis for the current project. In the initial study we asked 345 students to rate 36 (low-profile) MPs on various character traits, and to report their likelihood of voting for that candidate. Half of the respondents were shown the photos and the candidates' names and party labels (as they would in the polling booth were photographs to be printed on ballot papers). The other half saw only the photos. The ratings from this second half of the sample can be regarded as a pure measure of attractiveness for the 36 MPs included: that is, the respondents were reporting their likelihood of voting for the MPs based on nothing other than their photograph. These ratings on attractiveness were the basis for selecting MPs for the current study. 6
Experimental Design
Our approach is a modified version of that taken by Rosenberg et al. (1986). Those authors ran three split-half experimental elections, each pitting a pair of candidates rated differently on appearance against one another. For each election, two campaign flyers were designed, featuring the candidate's party affiliation and various issue positions, and these two flyers were randomly allocated to the two candidates. 7 Hence, in Rosenberg et al. (1986), half of the sample saw an attractive Democrat and a less attractive Republican, and vice versa for the other respondents. The logic of these experiments is simple: if respondents vote on party and issues alone, the results will be the same in each half of the sample, and the attractive and unattractive candidates will poll the same overall. In so far as there is an overall advantage for one candidate, it must be due to appearance.
Our major modification of that design is to run each experimental election twice so that we can control for partisan differences as well as differences due to the presence or absence of photos on ballots. Therefore, for each two-candidate contest (for example, Jones versus Smith), respondents will be randomly assigned to one of four conditions:
By comparing conditions A1 and B1 we can measure the impact of appearance where photos are printed on ballot papers. By comparing conditions A2 and B2 we can measure this impact in the absence of ballot paper photographs. Taken together, the two comparisons enable us to gauge the extent to which ballot paper photographs magnify any impact of attractiveness on election results. And experimental control ensures that if, in any comparison, a particular candidate (photo) receives significantly more votes, appearance alone accounts for this. 8
To test the hypotheses specified earlier we used four such experimental elections, with the British parties replacing Democratic and Republican candidates. We used two-party contests mainly because the introduction of third candidates would have complicated the design exponentially. There was no need to use the same two parties, though, and so we varied the ‘battleground’ on offer across the experiments. 9 These variations, and other key details of the experiments, are summarised in Table 1.
The Design of the Four Experimental Elections
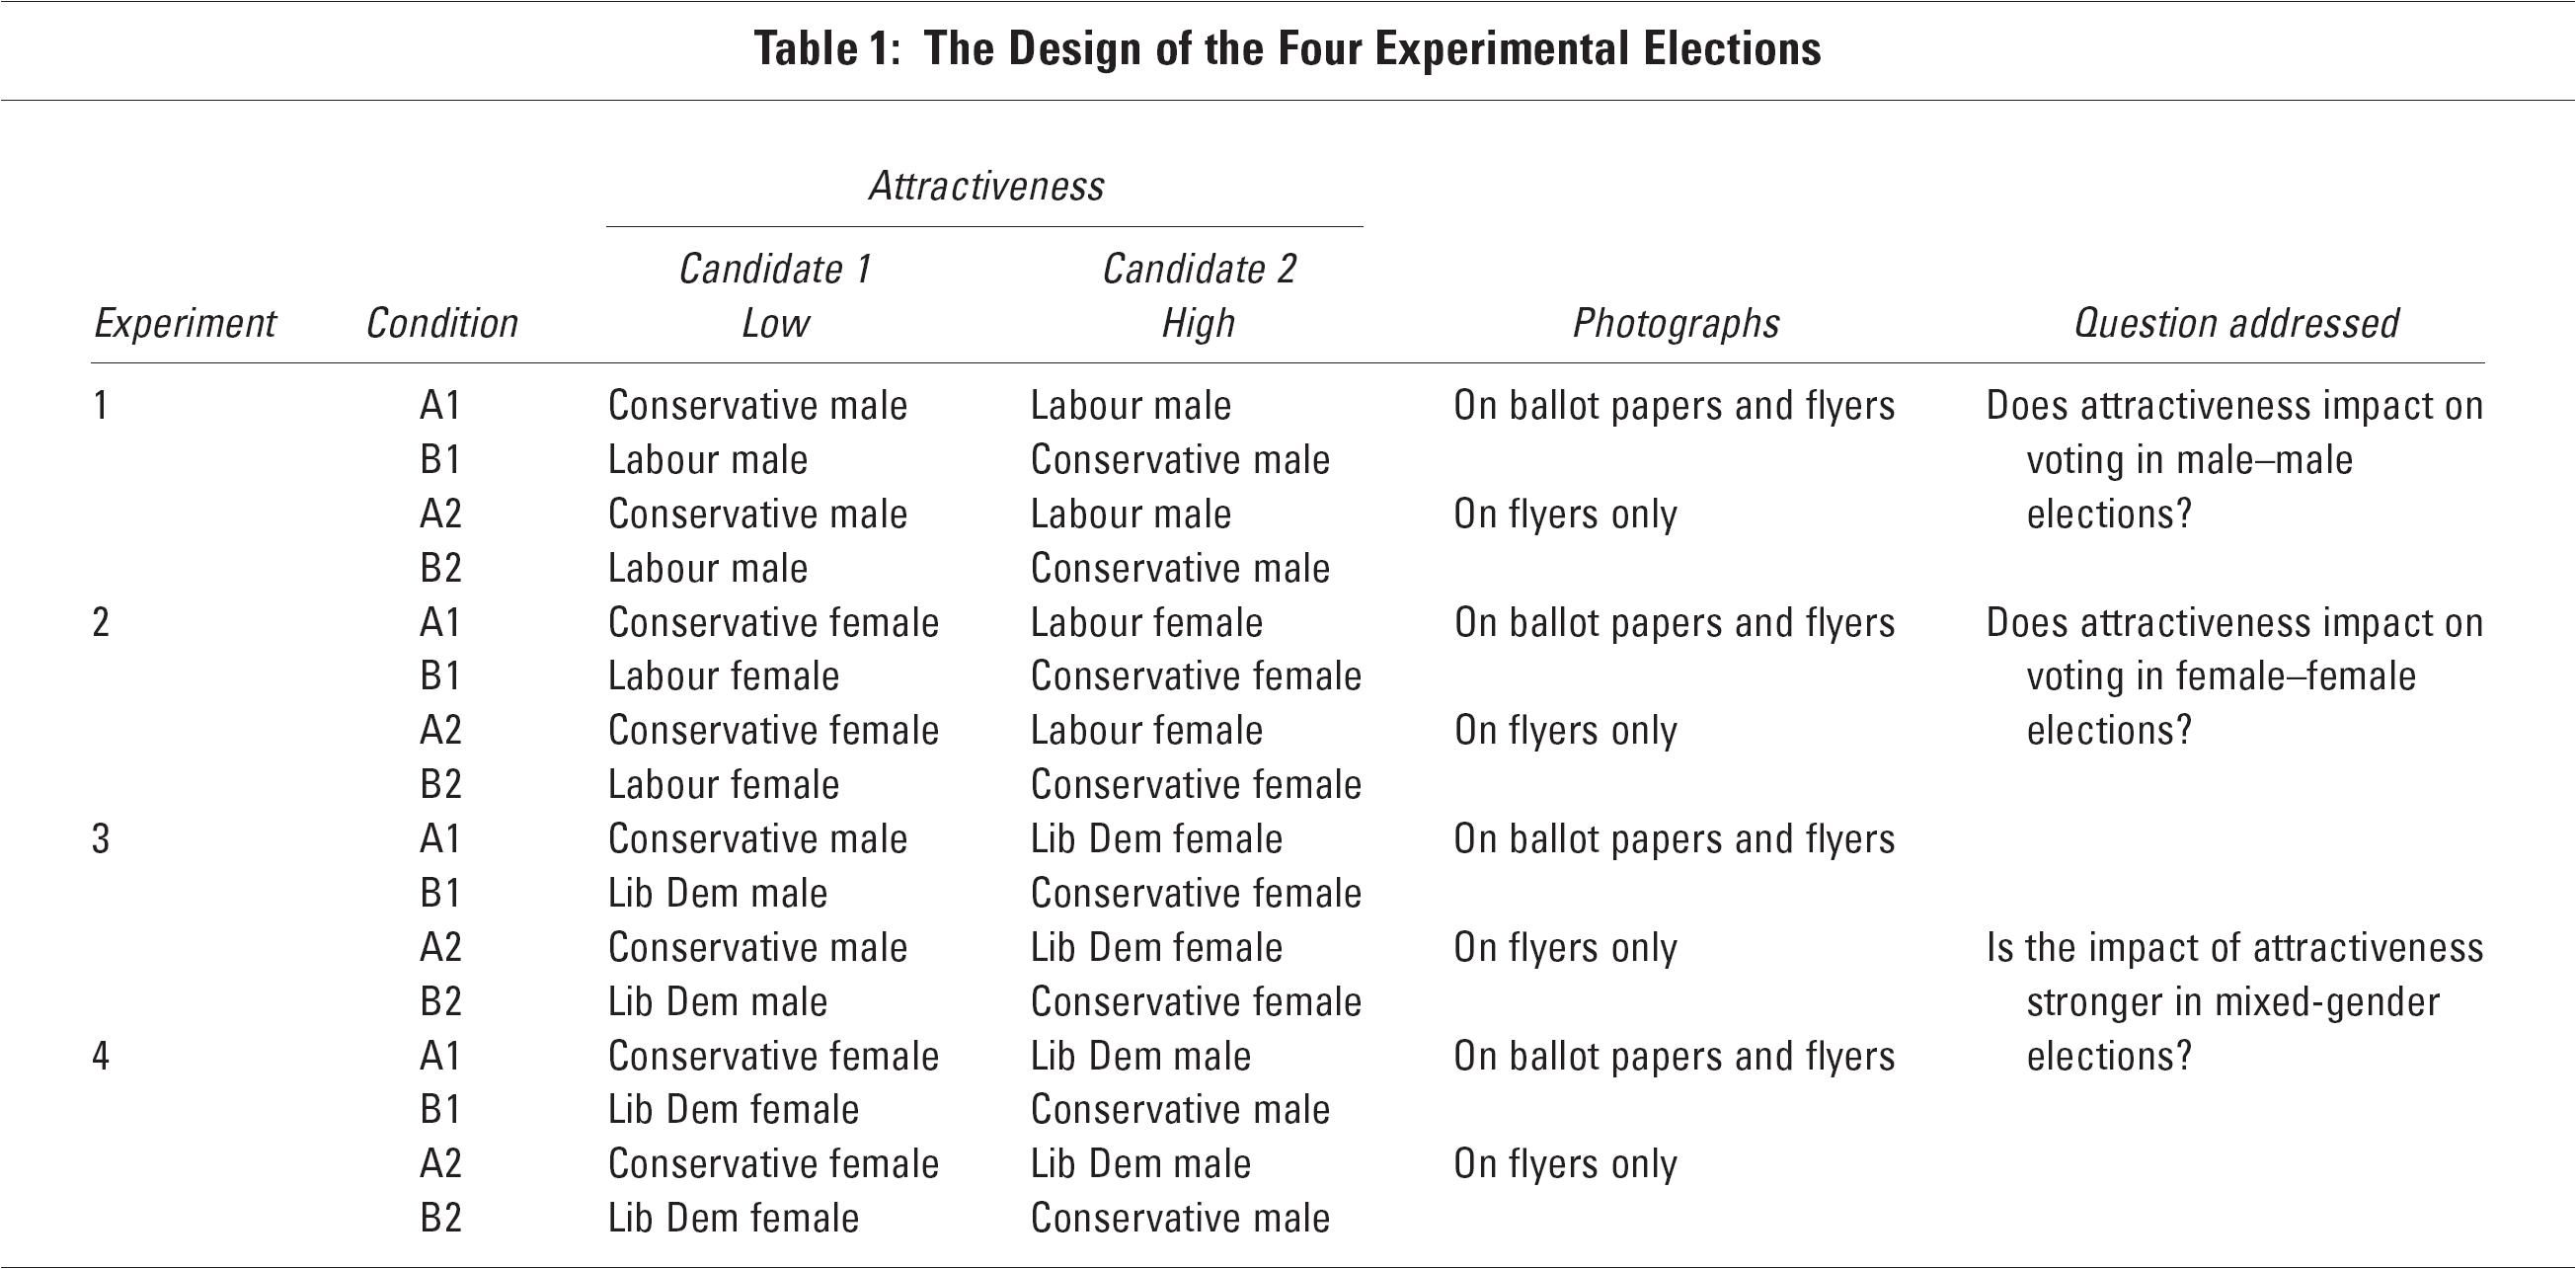
All four elections are contests between candidates rated low and high on attractiveness. 10 That reflects the primary purpose: to gauge whether a more appealing appearance generates an electoral advantage. The varying gender make-up of the experiments is intended to provide indicative evidence on the interaction between gender and attractiveness. In the first two, gender is held constant: they measure the impact of attractiveness on all-male and all-female contests, respectively. Thus, if the experimental differences are greater in Experiment 2 than in Experiment 1, that would support the notion that female candidates are judged more by appearance than male candidates. Experiments 3 and 4 are included partly on grounds of realism, since there are many more female—male than female—female contests in actual elections. They also test whether mixed-gender elections tend to see stronger appearance effects. That would be the implication of bigger differences in Experiments 3 and 4 than in Experiments 1 and 2. It should be emphasised, though, that evidence on these gender points can only be suggestive. That is because differences attributed to gender may in fact result from other characteristics of the pairs of MPs chosen, such as differences in age. This caveat should be borne in mind, and will be restated, when looking at the results.
We did not ask respondents to undertake all of the experiments in case the task became arduous, prompting them to give up halfway through or to rush through the experiments (which risks inflating image effects since these are probably stronger where voters have little other information). Respondents were therefore randomly assigned to one set of experimental elections: half did Experiments 1 and 3; half did Experiments 2 and 4. In each case, the experiments were always presented in that order.
Mode and Format of Data Collection
The experiments were administered over the internet by YouGov. Online administration of the experiment is very straightforward, and allowed for a far larger sample than any conceivable alternative approach. One obvious objection is that real votes are not – yet – cast electronically, let alone from home. The key question, though, is about experimental rather than mundane realism (McDermott, 2002; Morton and Williams, 2008). What matters is not verisimilitude in the external circumstances, but whether respondents behave roughly as they would in actual elections. It is difficult to validate the experimental realism of our own experiments, but Lau and Redlawsk (2006) provide powerful evidence that web-based hypothetical elections can engage participants and generate valid results. Clearly respondents will not have been fooled into believing that these were real elections, but then that is equally true of non-electronic versions of such experiments (e.g. Rosenberg et al., 1986).
Each experimental election consists of two parts: first, respondents consult the campaign flyer pages for each candidate; second, they mark their choice on the ballot paper page. Respondents were able to spend as much or as little time as they want on any page – as in real elections, in which voters may spend very little time reading campaign literature. The two phases of the elections were kept separate: that is, respondents consulted the pair of flyers for both elections, before moving to voting in those elections. Buffer questions served further to separate the two phases. They provide the additional variables required for the study. Respondents were asked how likely they would be to vote in an election held on the following day, allowing a test for image effects excluding those who probably would not turn out anyway. We also use self-reported interest as a proxy for political engagement. Partisanship is measured by the British Social Attitudes (as opposed to the British Election Study) measure of party identification (see Sanders et al., 2002). Respondents were asked two questions after voting. After each ballot paper, they had an opportunity to report whether they would have chosen ‘neither of the above’ had it been an option. Then, at the very end of the experiment, we asked whether respondents recognised any of the candidates. We removed any data collected from the 5 per cent of respondents who claimed to do so. 11 The finalised Ns reflect this trimmed data set. The full survey took the average respondent around ten minutes.
Materials
Although viewed electronically by the respondents, the flyers were closely based on those put through electors' letter boxes during campaigns, because in real elections many more voters would see such literature than would access the party's or candidate's website. To avoid overburdening respondents, the flyers were confined to a single page. Each featured the name, party affiliation and photograph of the candidate, brief biographical detail and key policy priorities. Thus, as in a real election, photographs were just one of many possible bases on which the respondent could choose. The ballot papers were based on those used in real British general elections, albeit half with photographs added. A sample flyer and a sample ballot paper are provided as Figures 1 and 2.
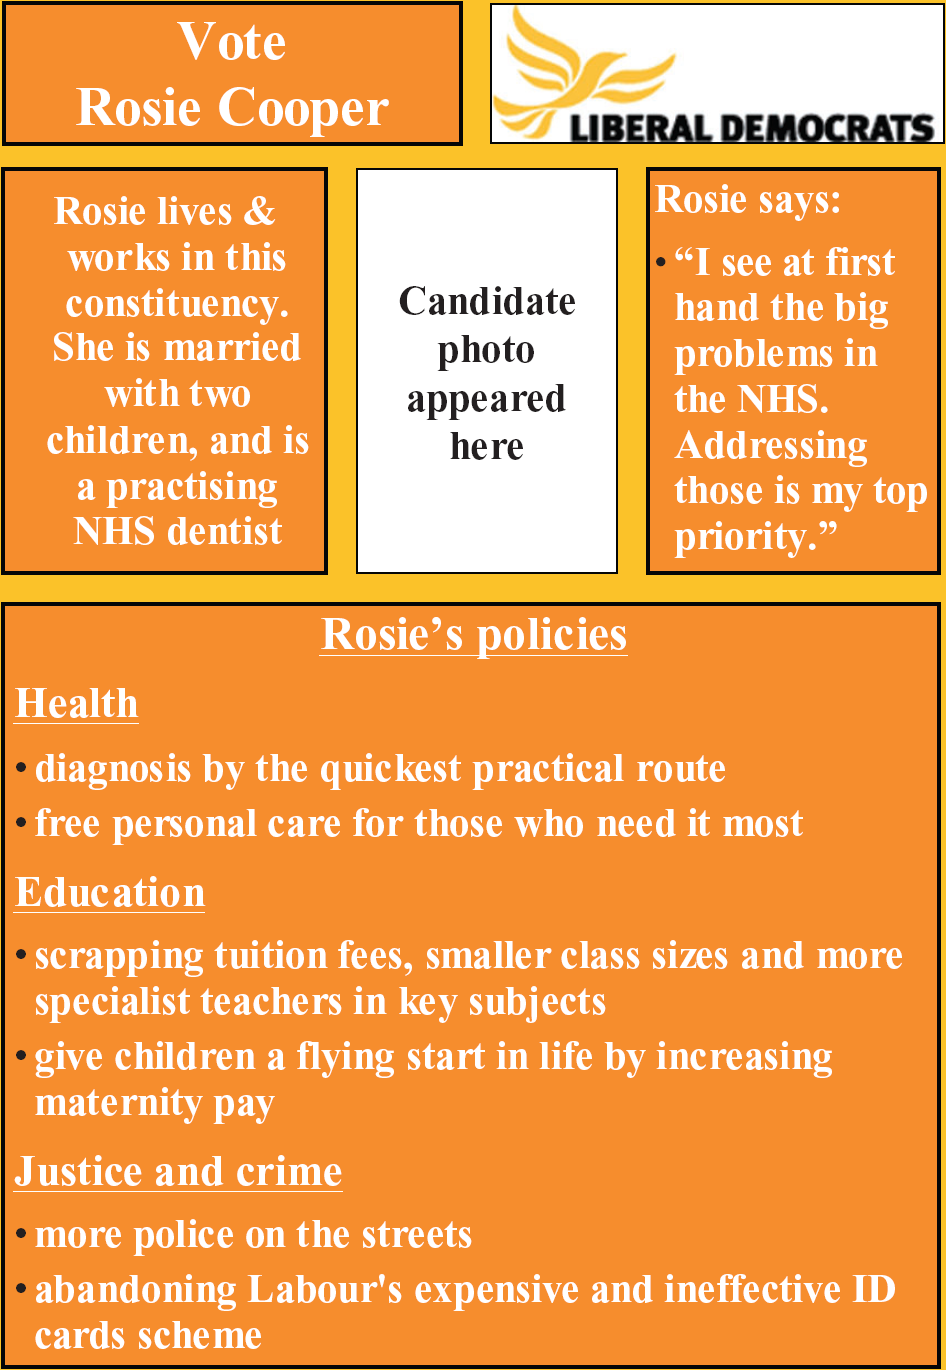
Sample Campaign Flyer
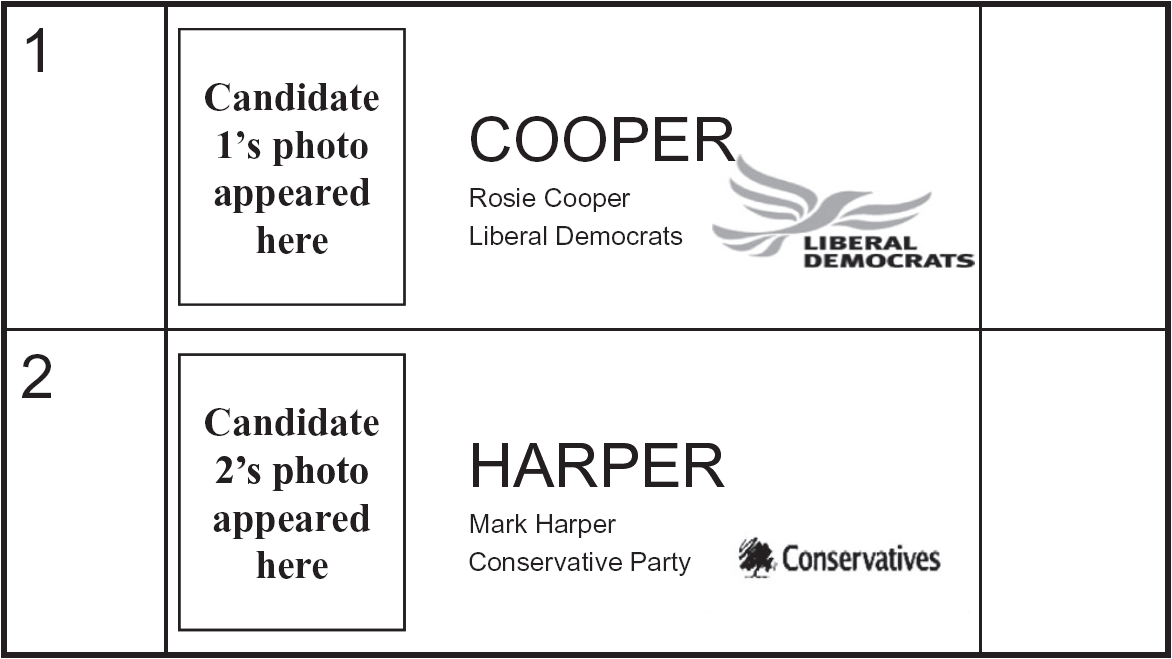
Sample Ballot Paper with Photographs
Respondents, Weighting and Data
Our target N was 500 respondents in each experimental condition for each election. This capitalises on the low costs per respondent of internet data collection. We would not expect huge image effects in the experiments, since respondents had many other bases for the voting decision. Yet, as noted, even small effects can be very significant in electoral terms. It is therefore vital to have enough respondents to ensure statistical significance for small but real effects, or to be sure that null findings are not misattributed to inadequate sample size.
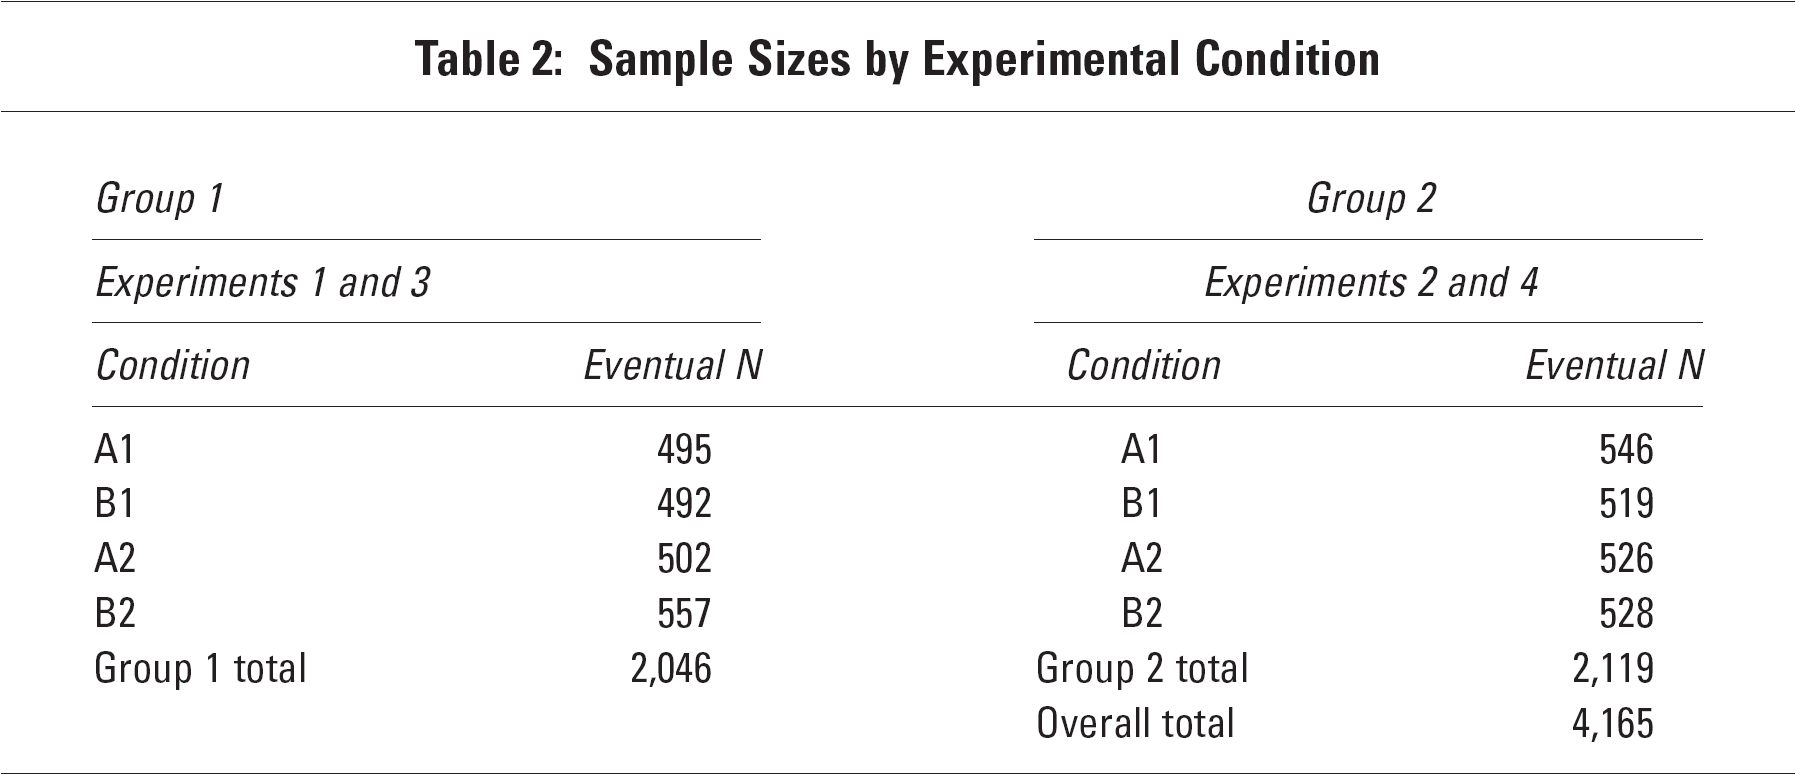
Since each participant took part in two of the four experimental elections and our target N was 500 in each of the four conditions for each election, our target sample N was 4,000. Ultimately that target was slightly exceeded: once those respondents who recognised MPs had been removed, the total sample was 4,165. The subdivision of Ns between experimental groups is shown in Table 2, and is slightly uneven due to differential rates of non-response by condition. The weights applied to the data are adjusted to even out these marginal differences.
Sample Sizes by Experimental Condition
YouGov's approximately 150,000 panel members formed the sampling frame. 12 The company has an impressive track record of sampling and weighting to achieve representative samples of the British electorate – as measured by their accuracy in predicting election results. So while previous studies (including our own) have used student or other non-representative samples, this research is a more valid measure of the potential impact of candidate appearance in the electorate as a whole. Party choice is not the only dimension of political representativeness, however, and there is consistent evidence that self-selecting approaches like the YouGov panel generate samples disproportionately high on political interest (e.g. Malhotra and Krosnick, 2007). Given that we would expect ballot photograph effects to be stronger among the less interested (an expectation confirmed below), any such effects observed here are likely to be conservative estimates.
In the data set we have four elections, each with around 2,000 (4 × 500) votes. There are two ways of analysing these data. First, we can treat the experiments separately, and analyse the factors accounting for the result of each. Second, we can create a stacked data set in which each of the cases, rather than representing a respondent, represents a respondent*election combination: in other words, a vote. 13 The other variables in the data set were copied alongside the stacked evaluations such that each respondent*election case was accompanied by the respondent- and candidate-level information. This allows us, for example, to explore whether male respondents were more likely overall to vote for male candidates. There were 8,328 cases for analysis in this stacked data set.
Results
Results of the Experimental Elections
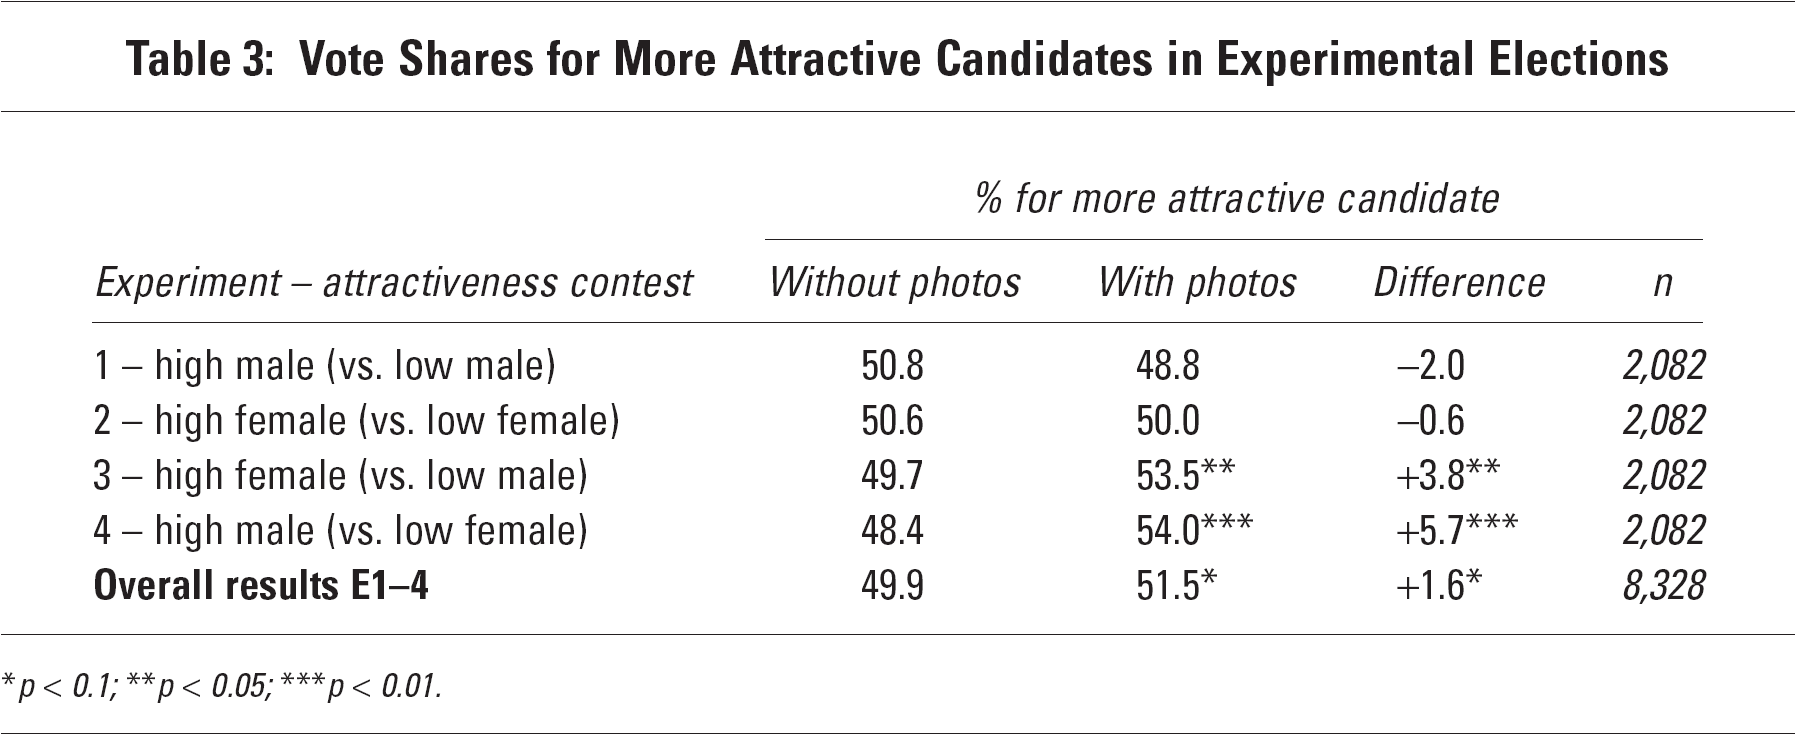
We begin with the basic results of our experimental elections. Table 3 reports the percentage of total votes won by the candidate hypothesised to have the advantage in each of the four races: that is, the most attractive candidate. 14 The random assignment of flyers to the candidates means that, should appearance have no impact, these percentages should not be significantly different from 50 per cent. We report the results of chi-square tests of that null hypothesis, and in the rightmost column we also report a significance test of the difference between the results with and without ballot papers. In the bottom row of each panel, we use the stacked data to calculate the overall proportion of votes going to the expected winner, again with significance tests.
Vote Shares for More Attractive Candidates in Experimental Elections
p < 0.1;
p < 0.05;
p < 0.01.
The first message from the table is that H1a can be rejected. In the absence of ballot photos, there is no advantage for any candidate, with none of the vote shares significantly different from 50 per cent. Taking the four experiments together, almost exactly half of the votes (49.9 per cent) were given to the less attractive candidate. Even with ballot paper photographs, two of these elections saw no significant advantage for the candidate expected (on the basis of ratings from our prior study) to perform better. The exceptions are the two mixed-gender contests, in which the higher-rated candidate did win significantly more votes. So there is only partial support for H1b, a point reinforced by the fact that the overall advantage with ballot paper photos is significant only at the p < 0.1 level. It should be recalled, though, that the average difference of 1.5 percentage points, though not strongly significant statistically, would, if replicated in real elections, be sufficient to swing plenty of constituencies, which in a close-race year could decide an election. And the magnitude of the ballot paper photograph effects in Experiments 3 and 4 is considerable.
Voter Characteristics and the Impact of Appearance
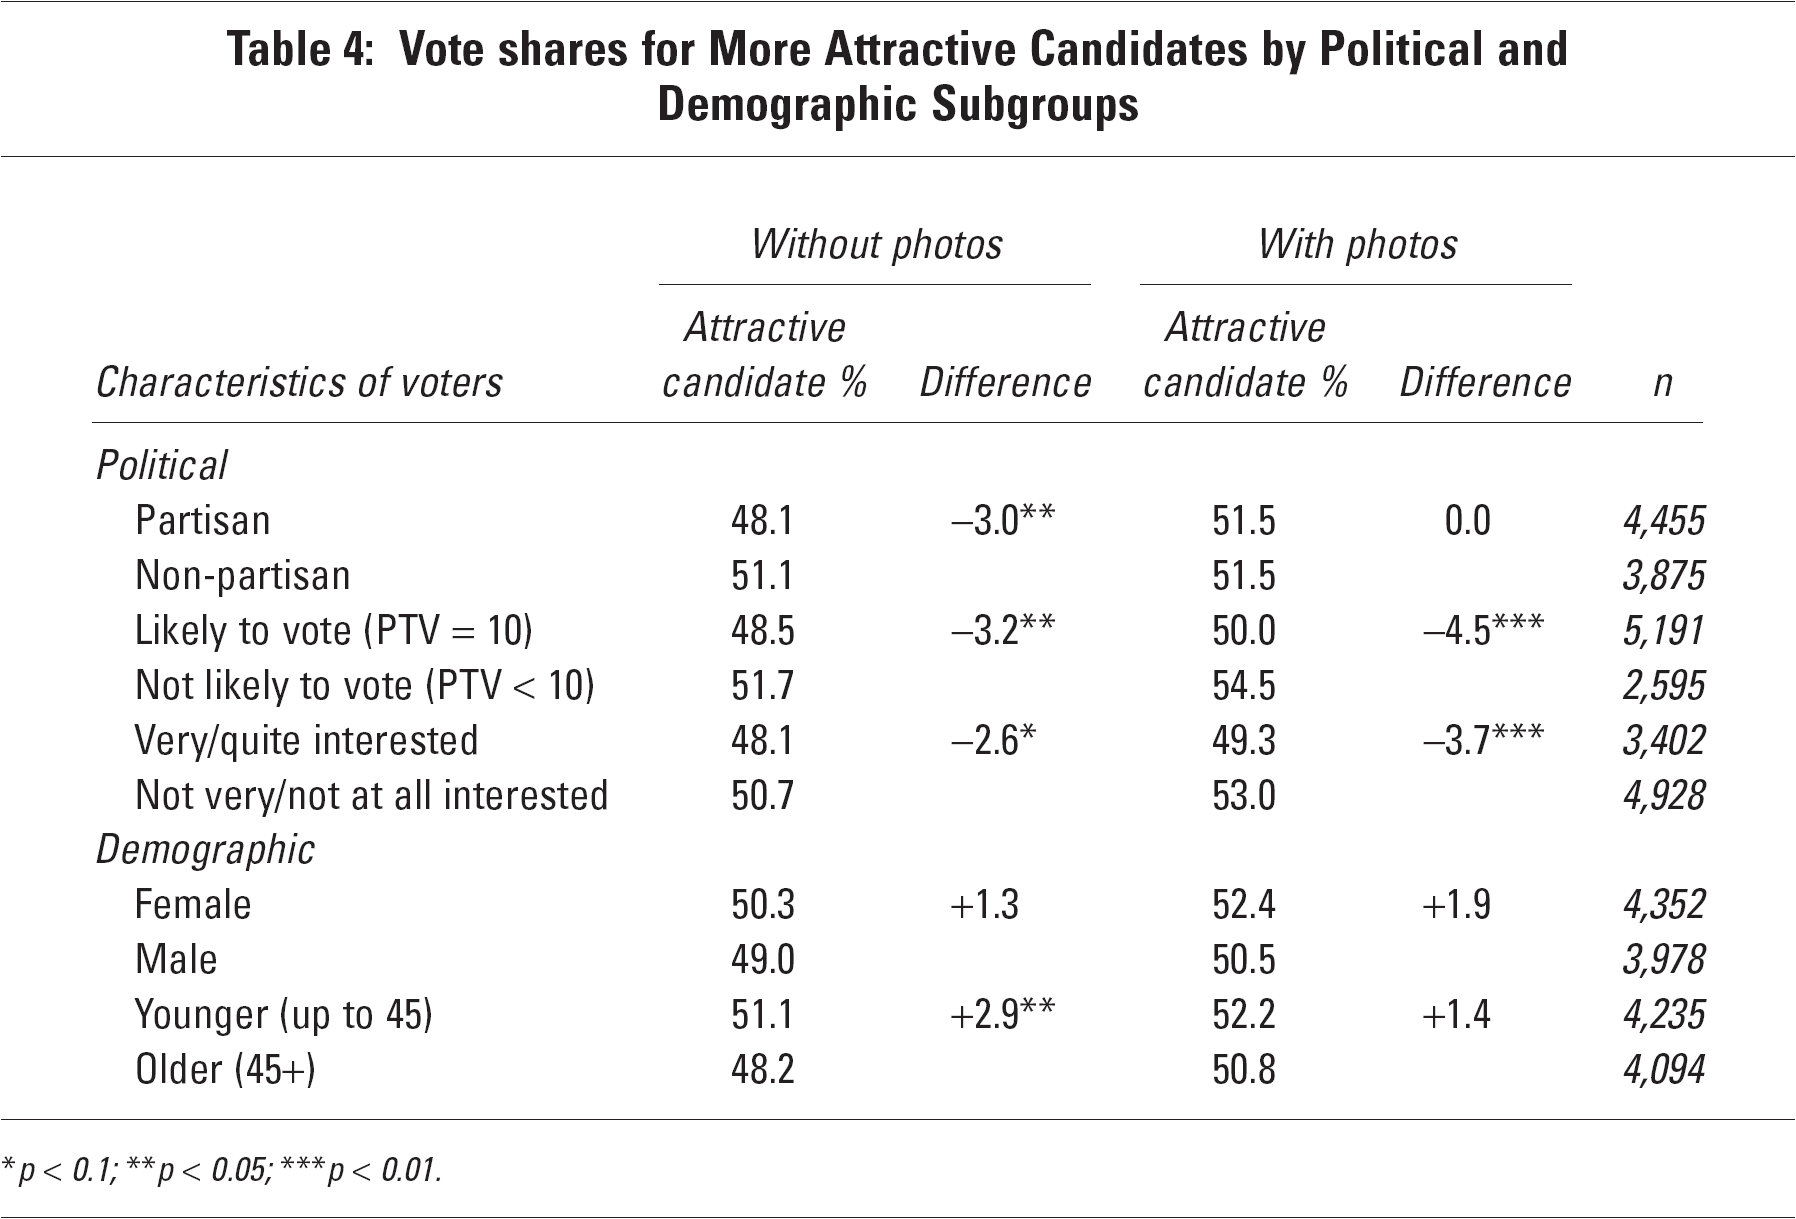
Although the results were mixed, we have at least some evidence from Table 3 that, when photographs appear on ballot papers, they influence the behaviour of at least some voters. The question for this section is: which voters? In Table 4, as in Table 3, the dependent variable is again the percentage of votes given to the more attractive candidate, both with and without ballot paper photos. This time, rather than treating each experiment separately, we use the stacked data to explore how voters in different political and demographic categories voted in each election. 15 And rather than testing whether each percentage is different from 50 per cent, we test the differences between categories of voters.
Vote shares for More Attractive Candidates by Political and Demographic Subgroups
p < 0.1;
p < 0.05;
p < 0.01.
The hypotheses that make up H2 can be tested both with and without ballot paper photographs. In the absence of photos, there is support for both H2a and H2b, in that non-partisans and the less engaged – both in terms of interest and likely participation – were significantly more likely to support the more attractive candidate. The null hypothesis H2c also receives support, with no significant relationship between gender and influence of appearance. However, on the basis of these data H2d should be rejected, because younger voters did indeed appear to be more influenced by image. 16 Moving to the votes of those who did see ballot paper photographs, the patterns change rather. The gender difference remains non-significant, although the tendency for females to prefer candidates rated higher on appearance becomes a little more noticeable. In contrast, the age difference narrows to non-significance, because photos eliminate the apparent tendency among older voters to prefer less attractive candidates. With ballot photos, then, we cannot reject either of the demographic null hypotheses H2c and H2d. 17 Meanwhile, there is stronger support for H2b, with ballot photos magnifying the influence of appearance on the choices of the less interested and the less likely to vote in real elections. Yet H2a should now be rejected, because the gap between partisans and non-partisans disappears. Surprisingly, the inclusion of photographs on ballot papers seems to render partisans just as open to influence by appearance as are non-partisans. 18
Candidate Characteristics and the Impact of Appearance
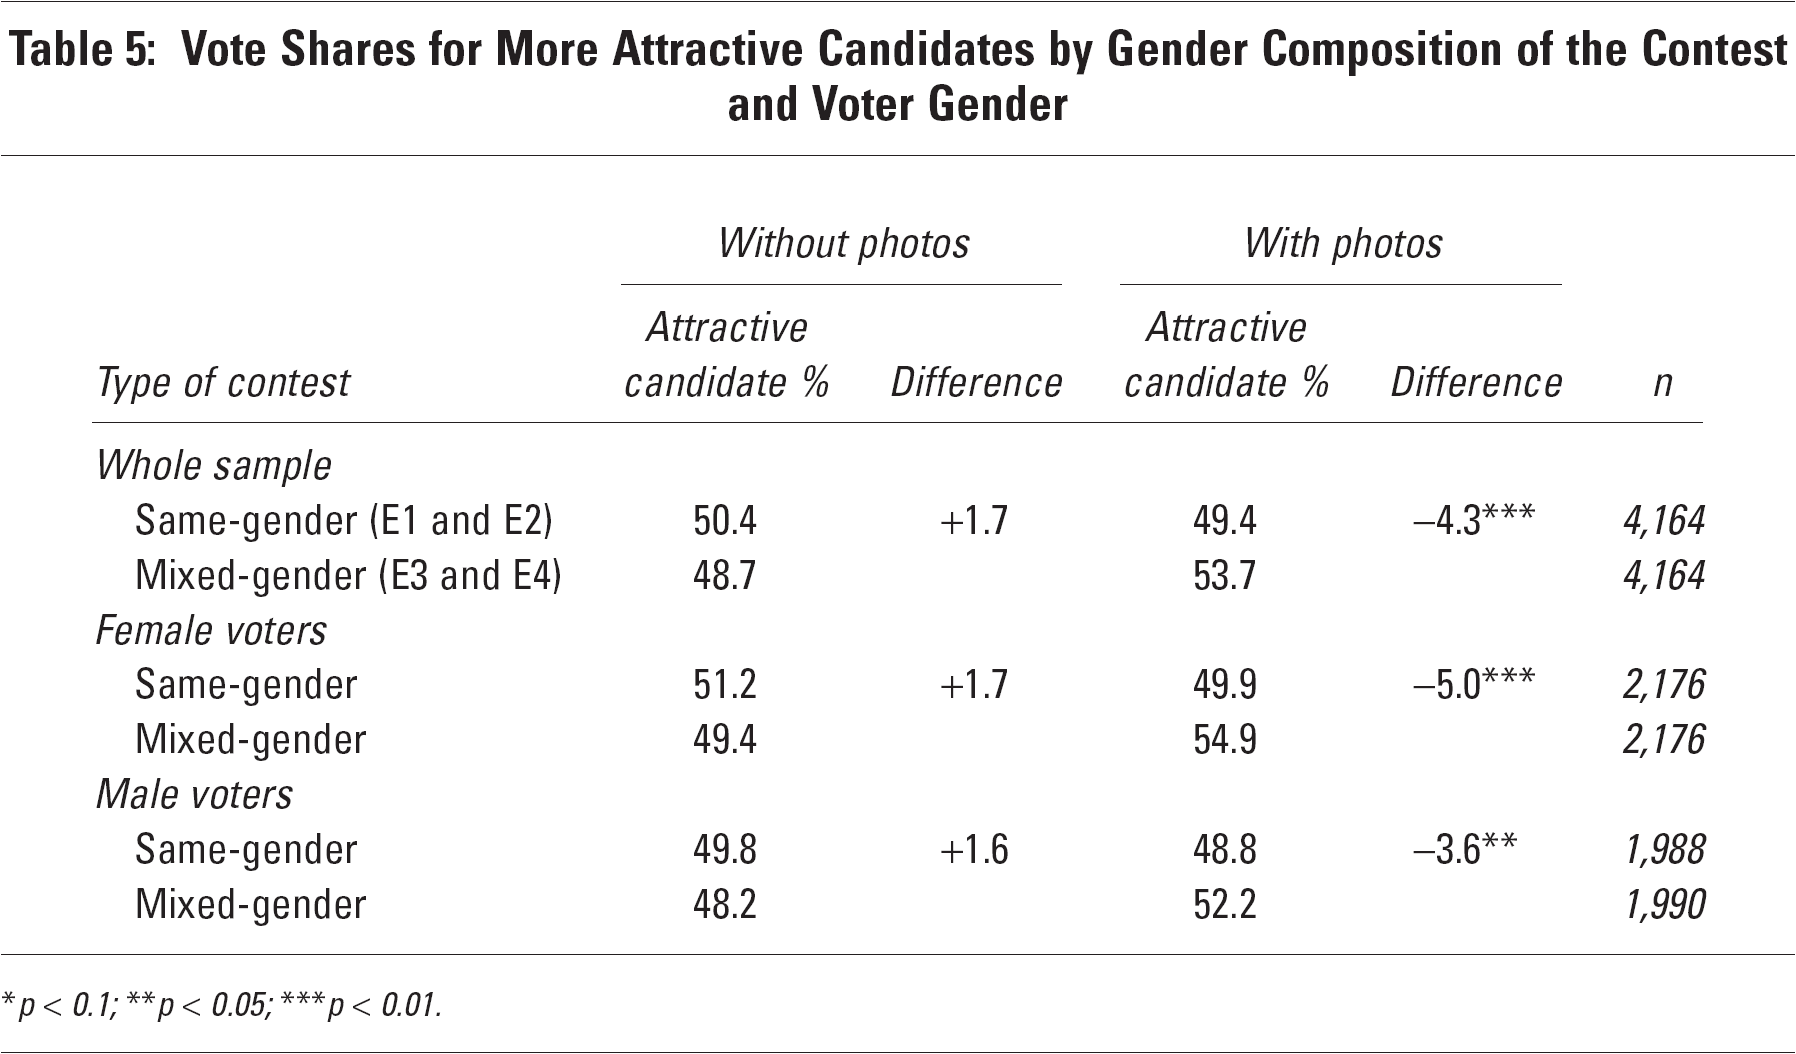
To begin this section, we refer back to the results from Table 3 which pointed to a stronger effect of appearance in mixed-gender contests. Here, we consider that possibility in more detail, thereby providing a test of H3, about the impact of image and the gender composition of the race. Table 5 begins with a basic comparison of voting in same- and in mixed-gender experimental elections. The same comparison is then broken down by voter gender, with a view to exploring which voters are influenced particularly by the gender composition of the contest.
Vote Shares for More Attractive Candidates by Gender Composition of the Contest and Voter Gender
*p < 0.1; p < 0.05;
p < 0.01.
The first rows of data confirm the impression from Table 3 that there is an advantage for more attractive candidates in mixed-gender races, but that this gap opens up only if voters are reminded of the candidates' appearance at the time of voting. H3a therefore receives only qualified support: the impact of appearance is dependent on the gender composition of the contest, provided that photographs are included on the ballot papers. H3b receives less equivocal support. The breakdown by voter gender reveals that a mixed-gender contest seems to raise the salience of appearance for all voters, but especially for females, who voted almost 55:45 in favour of the more attractive candidate in mixed-gender races. 19
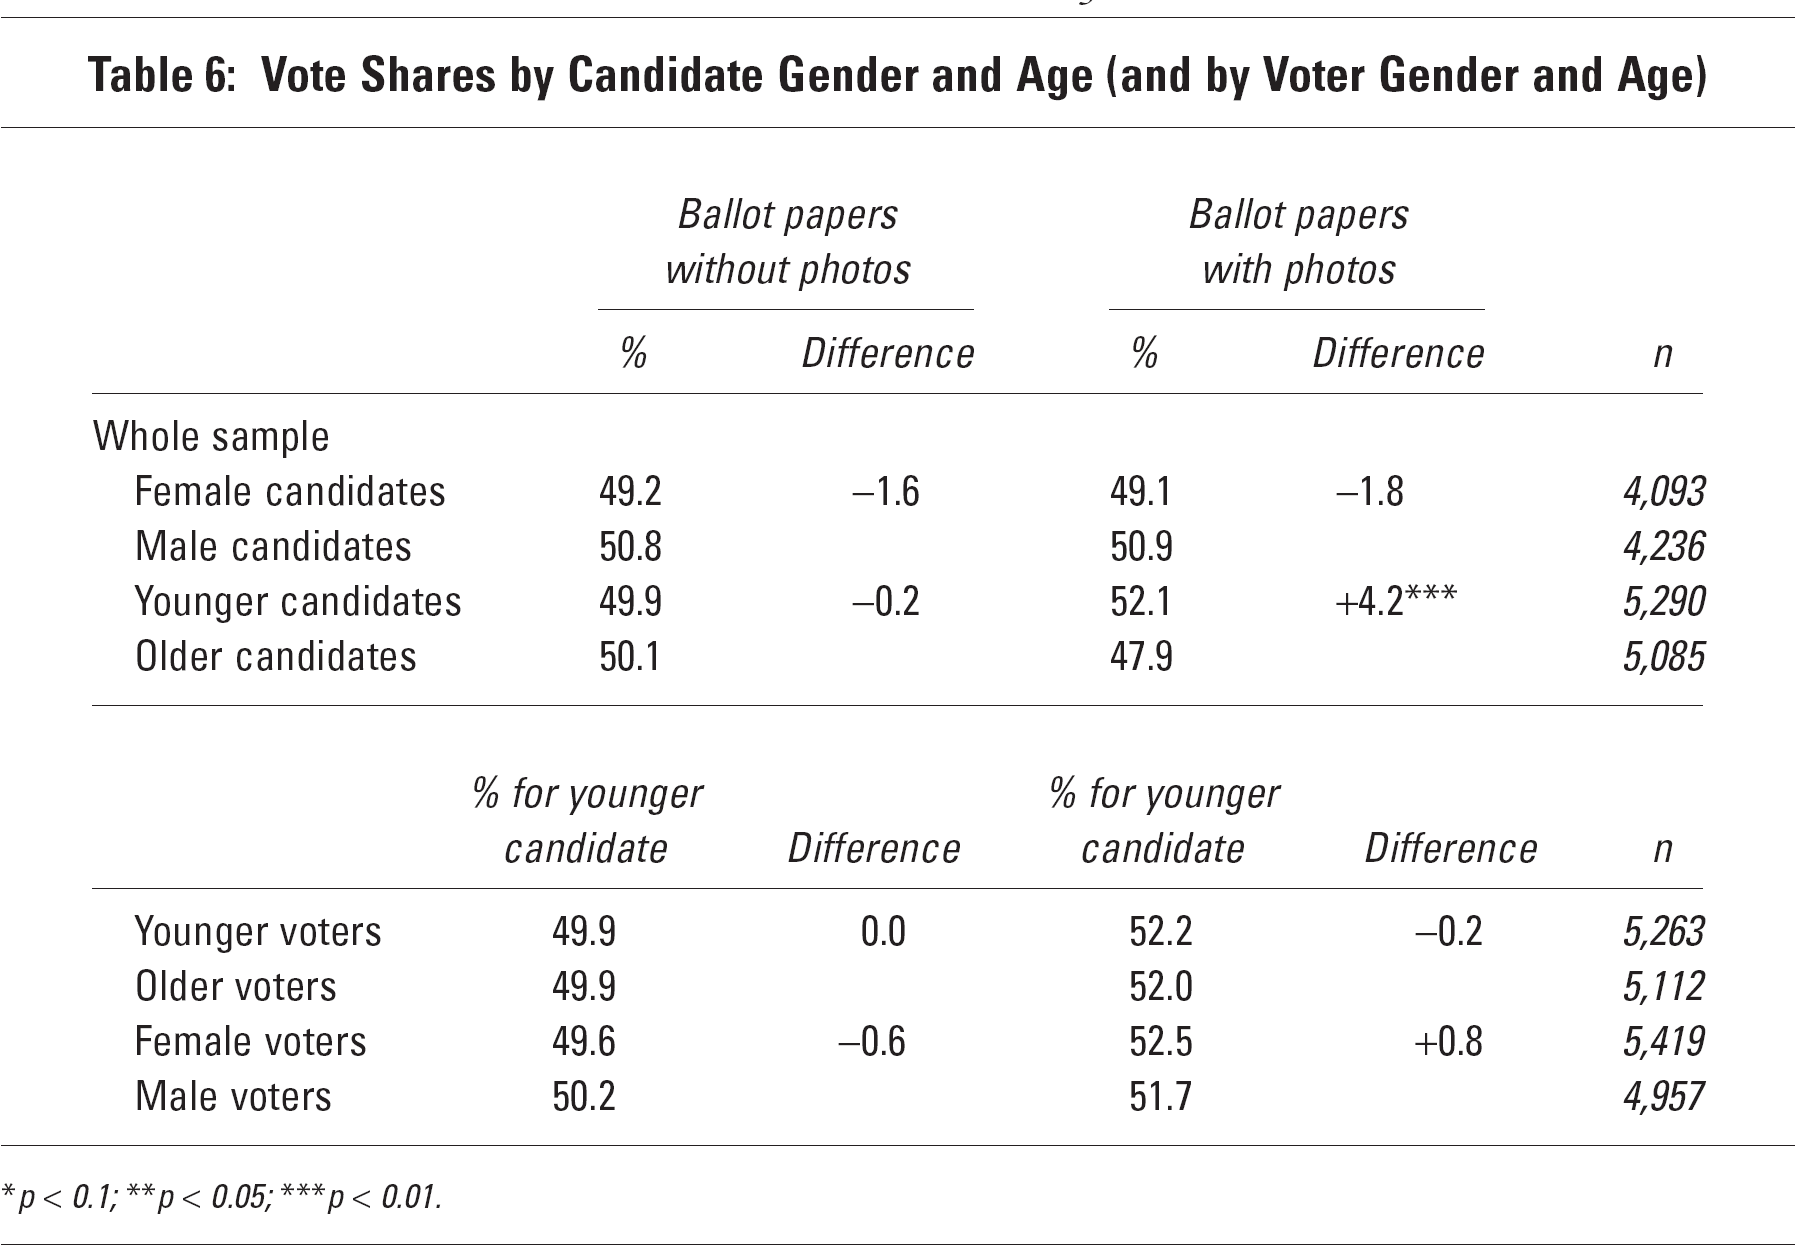
The implication of these results, which would probably not surprise many psychologists, is that gender differences cued respondents to take account of appearance. Next, we consider whether the connection works in reverse, such that being (re-)exposed to candidate appearance at the time of casting a ballot tends to reinforce gender effects on voting behaviour. We also look for parallel effects with age, another consideration likely to be cued by photographs. In Table 6, then, the dependent variable is no longer whether the vote was cast for the more attractive candidate, but whether it was cast for a male or female candidate (in the two mixed-gender contests) and for an older or younger candidate. 20 In the lower half of the table, we investigate which voters are driving the effects observed.
Vote Shares by Candidate Gender and Age (and by Voter Gender and Age)
*p < 0.1; **p < 0.05; p < 0.01.
Looking first at candidate gender, we can immediately reject H4a. The slight (though not significant) tendency for voters to prefer male candidates was no more evident with ballot paper photographs. Perhaps the cues in candidate names are sufficient to induce whatever gender effects are observed in British elections. Either way, our earlier speculation that simply cueing appearance at the time of voting would magnify the impact of gender has been refuted. With candidate age, however, things are different. Here, there is support for H4b: a null result turns into a significant advantage for younger candidates when the ballot papers feature photographs. Age gaps, then, apparently not pertinent when considered alongside the other information on the flyer, become more important when, as on a ballot paper with photographs, they are highlighted at the crucial juncture.
In the lower part of the table, we explore the sources of this age effect. The percentages correspond to the votes for the younger candidate – now the ‘expected winner’, given the result above. Interestingly, there is little connection between voter age and the age bias: younger and older voters alike favour younger candidates, but only when their photographs are included on ballot papers. A similar story can be told with voter gender: although there is some evidence that, as in some previous analyses, female voters are slightly more influenced by the inclusion of photographs, the differences are marginal and non-significant. In sum, all voters show this small but non-negligible tendency to penalise older candidates (or to reward younger candidates – we cannot ascertain which on the basis of these data) when the contrast is highlighted via ballot paper photographs.
Summary and Implications
The key question motivating this research was whether the inclusion of photographs on ballot papers would give an electoral advantage to some candidates. Judging by these data, the short answer to that question is: yes. A longer answer is needed to avoid overstating the case, however, and to clarify the conditions under which photos had an impact. Most of the impacts registered here were fairly small. Although ballot paper photos are a prominent cue, available right at the moment of decision, they do not wield a strong influence over voting behaviour. One reason is that candidate appearance is just one of many factors at play, both in these experimental and in real elections. And it appears to interact with some of these other factors in ways that are relevant for the ballot photograph debate. First, we saw that photos had most impact in contests between male and female candidates. One plausible explanation is that such contests bring gender to the forefront of voters' minds, which in turn cues considerations related to appearance. Second, younger candidates appear to benefit from the inclusion of photographs. This will not surprise those MPs who feared that candidates would use out-of-date photographs in a bid to gain an advantage. Third, ballot photographs influenced the choices even of voters reporting identification with one of the competing parties. By rendering an appearance heuristic just as accessible as a partisan cue, photographs enabled the former sometimes to trump the latter.
There are two question marks over the internal validity of our findings. The first relates to the ratings from the earlier study, and the fact that, unlike these experimental data, they were not obtained from a representative sample of the population. Perhaps our UK respondents simply disagreed with our undergraduates about who is attractive. If indeed we chose pairs of candidates that did not much differ in visual appeal to the current sample, the most likely result is that our results would understate potential ballot photograph effects. The second question mark would apply in any case, and is an inevitable consequence of being able to run only a small number of elections. We have drawn tentative conclusions here, for example, about mixed-gender versus same-gender contests, yet we have only two examples of each. Moreover, we were unable to control statistically for such potential confounding factors as the age differentials between the candidates. It may be that the size and patterns of the results obtained were a function of the particular MPs involved in, rather than the gender composition of, those races. This should not obscure the point that, in a tightly controlled experimental context, we have found clear evidence of potential ballot photograph effects. Plainly, however, further research would be needed to draw more robust conclusions about the conditions under which that potential is fulfilled.
Turning to external validity, the question is whether the magnitude of effects registered here would be different in real elections. There are two reasons to suppose that the experiments overstated the impact of photos. The first is that, in real elections, numerous factors might influence voting decisions, and our flyers go only a little way to recreating such complexity. The second is that the pairs of candidates were specifically chosen to be a long way apart on ratings of appearance. Such uneven contests will occur from time to time in actual elections but will not be the norm. Another artificial feature of the experiments might point in a different direction, though. Most real constituency elections are fought by incumbents, often of long standing, who – unlike the MPs in our experiments – are likely to be at least vaguely familiar to many voters when aided by a photo. There is ample evidence from US elections that recognition contributes to a personal vote; here, then, photographs might give a boost to incumbents.
While recognising that more and different studies would boost confidence in this conclusion, we believe that ballot paper photographs would have a small but perceptible impact on voting behaviour. Moreover, there is a strong case for arguing that even small effects should be avoided if possible. Although instantaneous judgement based on appearance, with its roots in evolutionary social psychology, is often surprisingly accurate (e.g. Zebrowitz, 1997), that is still some way from positing it as a desirable basis for vote choice. If, then, there are at least small costs involved in printing photographs on ballot papers, the question becomes: what is there to gain? On this the evidence is especially sparse. The Electoral Commission (2003b) referred to two possible advantages: making the ballots more user-friendly and encouraging turnout. There is no scope here to assess the likelihood of these outcomes. But we should highlight one result of this study, namely the finding that ballot paper photographs encouraged appearance effects particularly among those reporting themselves unlikely to vote in elections. Thus, if such an innovation does attract reluctant voters to the polling station, it will be attracting precisely those voters most easily swayed by appearance.
The final point relates to another noteworthy finding from this study, namely that appearance had virtually no effect on voting behaviour in the absence of ballot paper photos. This is particularly striking given that, unlike in real elections, respondents had seen – and probably in most cases processed information from – photos of the candidates only a few minutes before choosing between them. That result provides strong support for the conventional wisdom that, in contrast to their American counterparts, most British voters are less accustomed to candidate-centred judgement. In turn, it might suggest that studies like that reported by Todorov et al. (2005), in which candidate appearance alone predicted startling proportions of US electoral contests, would yield less impressive if not null findings in Britain. It is open to debate whether this is a normatively preferable state of affairs. Those who believe that it is should regard the potential inclusion of ballot paper photographs with some suspicion.
Footnotes
1
This perhaps implies that, should electronic voting be introduced more widely, the inclusion of photographs becomes more viable and more likely.
2
For example, an apparently kindly face may be of little use to a candidate revealed in the biography to be an estate agent.
3
That said, some of the various electoral systems now used in Britain require voters to choose between multiple candidates of the same party. In such cases, appearance has been shown to have a substantial effect on voting decisions (Banducci et al., 2008).
4
5
Looking only at the two leading contender candidates in each seat in 2005, 59 per cent of races were all male, 35 per cent were mixed and 6 per cent were all female. (This calculation is based on the British Parliamentary Constituency Database, 1992–2005, and the 585 seats in which two of the three major parties were the leading contenders.)
6
Ratings from the exploratory study are therefore provided by a population – undergraduate students – that is not representative of the sample sought for the current study. Admittedly, the students' ratings did have ‘face validity’ (i.e. they conformed to our own prejudices). Nonetheless, this is an important limitation, which should be kept in mind. It is also another reason for choosing candidates with markedly different ratings on attractiveness, in the hope that the gaps remain even among a different sample.
7
The experimental design requires the MPs chosen to be willing to have their photograph included on a campaign flyer for the ‘wrong’ party, and alongside issue positions attributed arbitrarily to them. Around half of the initial 36 MPs agreed to this. Ultimately, eight MPs were used for the experimental elections reported here: Rosie Cooper, Edward Garnier, Mark Harper, Alan Keen, Martin Linton, Theresa Villiers, Joan Walley and Angela Watkinson. Naturally, we do not report here whether they scored high or low on attractiveness.
8
Strictly speaking, the candidates' names are another possible source of experimental differences. Since sometimes we pit female against male candidates, we cannot vary names along with party labels and policy positions. It seems likely that photos are far more influential, visual cues being more immediate and powerful. Nevertheless, we avoided using MPs with names likely to trigger strong social or geographical prejudices.
9
Since ballot papers invariably feature more than two candidates, this aspect does not score well on mundane realism (McDermott, 2002). However, it fares better in terms of reflecting party competition: three-way marginals are very thin on the ground. In the experiments reported here we use the two scenarios, Labour versus Conservative and Conservative versus Liberal Democrat, that are the most common two-party battlegrounds in British constituencies. In analysis, we take account of respondents' partisanship, since that obviously influences their reactions to the constraints on choice.
10
Those rated high on attractiveness scored on average around 5.5 on the 0–10 probability to vote scale in the exploratory study, compared to around 3.5 for those rated low. Among 36 MPs rated in that study, the standard deviation of attractiveness was 0.8. The high—low gap is therefore around two and a half standard deviations.
11
Our sample excluded anybody living in the eight constituencies represented by the MPs chosen.
12
Most are actively recruited (using targeted campaigns via non-political websites) rather than volunteering for the panel. Similarly, respondents cannot choose in which surveys to take part: they are either sampled or not. Party political surveys, let alone unusual experimental surveys like this, are the exception rather than the rule – much of YouGov's data collection is in the fields of market research or more general opinion polling. Respondents are paid small incentives – between 50p and £1 for surveys of this length – for taking part.
13
This procedure mirrors that used by Van der Eijk and Franklin (1996), whose preference for measuring voters' reactions to each party leads them to assemble a stacked data set of respondent*party combinations. Stacking the data in this way means that each case is linked to one other in the data set, that is, the other vote cast by the same respondent. This violates the assumption of independent observations that underlies the general linear model. We therefore present analyses based on standard errors clustered by respondent. These were obtained via STATA's ‘Cluster’ command (Rogers, 1993).
14
When we refer to ‘the candidate’, we mean simply the photograph (and the name), and not the party, the biographical details, the issue stances or anything else – all of these are switched with the flyer.
15
Respondents are classified as ‘partisans’ if they expressed identification with either of the parties involved in the election in question. Political interest was dichotomised as shown in the table. Likelihood to vote in a general election was initially measured on a 0–10 scale, and previous analyses have shown that the proportion answering 10 tends fairly closely to reflect the actual turnout figure. Hence that variable was also dichotomised as shown. The age cut-off of 45 is rather arbitrary, but at least splits the sample roughly in half.
16
There is a caveat about these significant results, though: none of the percentages in the left-hand column are significantly greater than 50 per cent. The significant gaps are in each case due to the ‘other’ group voting on balance more often for the expected loser.
17
These overall null findings conceal an interaction between age, gender and the impact of appearance. This impact, and in particular the effect of ballot photographs, was strongest for younger female and older male voters. We have no ready explanation for this intriguing result.
18
We obtained a similarly surprising result when taking account of whether respondents said that they would have chosen ‘none of the above’. We would expect ballot photos to have more of an impact on such voters, supposing them to be more likely to draw on superficial reasons when forced into making a choice they would have preferred to avoid. No such pattern emerged.
19
The same interaction (see Note 17) between voter gender and voter age was visible in this analysis too: the corresponding ratio among younger female voters was 58:42.
20
In all four contests there was a noticeable age gap, that is, one that we deemed to be reasonably obvious, and that had an objective basis, with the candidates being more than five years different in age.