
Abstract
While every student in American politics knows that the incumbency advantage grew post-1965, it is less clear as to whether or not this growth has been sustainable throughout the 1980s, 1990s and 2000s. Focusing on the last three decades, we show that the electoral margins of sitting members of the House of Representatives have not linearly grown over the past 60 years. On the contrary, the constant increase in incumbents' vote shares between the 1960s and 1980s could not be sustained in the 1990s. In fact, in the 1990s, the incumbency advantage dropped sharply to levels experienced in the 1960s. In recent years, the electoral margin of sitting House members seems to have grown again to levels comparable to those in the 1970s.
Introduction
Scholars of American politics treat the growth of the incumbency advantage in the US Congress in the 1960s in an almost axiomatic fashion. Since David Mayhew (1974) declared the ‘vanishing of the marginals’ in House elections and provided some descriptive evidence of the growth of the incumbency advantage after the 1960s, most electoral analyses take for granted that a ‘pre-’ and a ‘post-1960s’ exists, with 1965 being the conventional watershed date. However, while numerous analyses (e.g. Cox and Katz, 1996; Mayhew, 1974) have established that the electoral margins of House members increased in the 30 years between 1960 and 1980, it is less clear whether incumbents' vote gains continued to increase in the following decades (Abramowitz, Alexander and Gunning, 2006; Petrocik and Desposato, 2004).
This article tests the growth of the incumbency advantage for the past 60 years. We find that Mayhew's (1974) analysis of the increased electoral margins of sitting members of Congress provides only a partial description of the development of the incumbency advantage. In fact, while the overall electoral advantages enjoyed by incumbents grew between the 1960s and the 1980s, it appears that in more recent years such advantages have been declining. More specifically, we find that in the 1990s the overall incumbency advantage seems to stand roughly at the levels registered in the 1960s, while in the 2000s it moved to levels comparable to those in the 1970s.
Our analysis is simple and straightforward. First, we briefly review some of the existing works dedicated to the study of the incumbency advantage in the United States, demonstrating how the pre- and post-1960s paradigm influenced their analyses. Second, we present some descriptive evidence that casts some doubt on the substantial difference between the role that the incumbency advantage played in the 1950s and 1960s and its role in successive years. Third, we introduce two different ways to measure the incumbency advantage, namely the difference in the vote a sitting member of Congress receives in any given election as compared to his or her first electoral victory. Based on these two measures, we estimate two simple univariate statistical models that confirm our hypothesis of the growth and decline of the incumbency advantage over the years. In conclusion, we summarise the main argument of this article and provide some avenues for future research.
The growth of the incumbency advantage: consequences of a paradigm
The incumbency growth paradigm holds that incumbent US House candidates have seen an increase in popular electoral support since the mid-1960s. Mayhew (1974) laid its foundation in the Congress literature. In his seminal work Congressional Elections: The Case of the Vanishing Marginals, he analysed electoral data between 1956 and 1974. He concluded that, in the 1970s, incumbent congressmen had a much better chance of winning elections with larger electoral margins than in the past (Mayhew, 1974, p. 304) and that ‘congressional seat swings [were] declining in amplitude’ (Mayhew, 1974, p. 313). By providing a watershed point after which the incumbency advantage started to grow significantly (i.e. the mid-1960s), Mayhew (1974) influenced all subsequent research on the topic. Supported by his seminal findings, a large body of future works (e.g. Abramowitz, 1975; Ferejohn, 1977; Fiorina, 1977; Mann and Wolfinger, 1980; Coates, 1995; Cox and Katz, 1996; Herrera and Yawn, 1999) has taken the existence of the incumbency advantage and its growth for granted and shifted the attention to its possible explanations, such as the growth of bureaucracy (Fiorina, 1977), the change in relations between incumbents and constituents (Fenno, 1978; Romero, 2006) or the influence of the media (Prior, 2006).
However, it is rather peculiar that the incumbency advantage has been treated in a static manner with a focus on the ‘pre-’ and ‘post-1960s’ paradigm. Admittedly, the growth of bureaucracy or the changing relations between voters and candidates are potentially still valid explanations if the incumbency advantage followed the trajectory of the 1960s and 1970s in subsequent decades. However, if the dynamics surrounding the incumbency advantage have actually changed at any given point within the past 50 years, then its causes might have to be – at least partially – changed accordingly. In this sense, it is somewhat surprising that more recent studies (e.g. Coates, 1995; Herrera and Yawn, 1999) have persistently taken the continued growth of the incumbency advantage for granted.
Even contradictory findings on the causes of the incumbency advantage do not give rise to any explicit challenge to the ‘pre- and post-1965 divide’. 1 There are only a few works which entertain the possibility that the incumbency paradigm might be flawed or at least partially incorrect in the period following the 1970s (Carson, Engstrom and Roberts, 2007; Gross and Garand, 1984; Jacobson, 1987). Entertaining these warning voices, we analyse the incumbency advantage over the past 60 years and highlight that the incumbency advantage has not grown linearly.
In the following section, we present three pieces of descriptive evidence which hint at the fact that, between the early 1950s and 2008, there was no linear growth in the incumbency advantage in US House elections. To confirm this finding, we first look at the development of the overall vote share of incumbents over the past six decades. Second, we graph the number of marginal races according to the 55 per cent threshold. Finally, we display the number of incumbents per election year who lost their electoral bid.
Where is the continued growth?
We start our analysis with the straightforward notion that if the incumbency advantage grew after the 1960s and the marginals progressively regressed, then the average aggregate share of the vote received by incumbent candidates should be higher in recent years than in the past. Figure 1 shows the mean percentage of the total vote received by successful candidates in US House elections between 1952 and 2008. 2 It features, for comparative purposes, separate aggregate values for successful incumbent candidates and for candidates who won ‘open-seat’ races. As shown, there is no discernible pattern of constant growth and only a slight increase in the average share of the vote obtained by incumbents between the 1950s and the 1980s. However, this increase disappears in the 1990s.
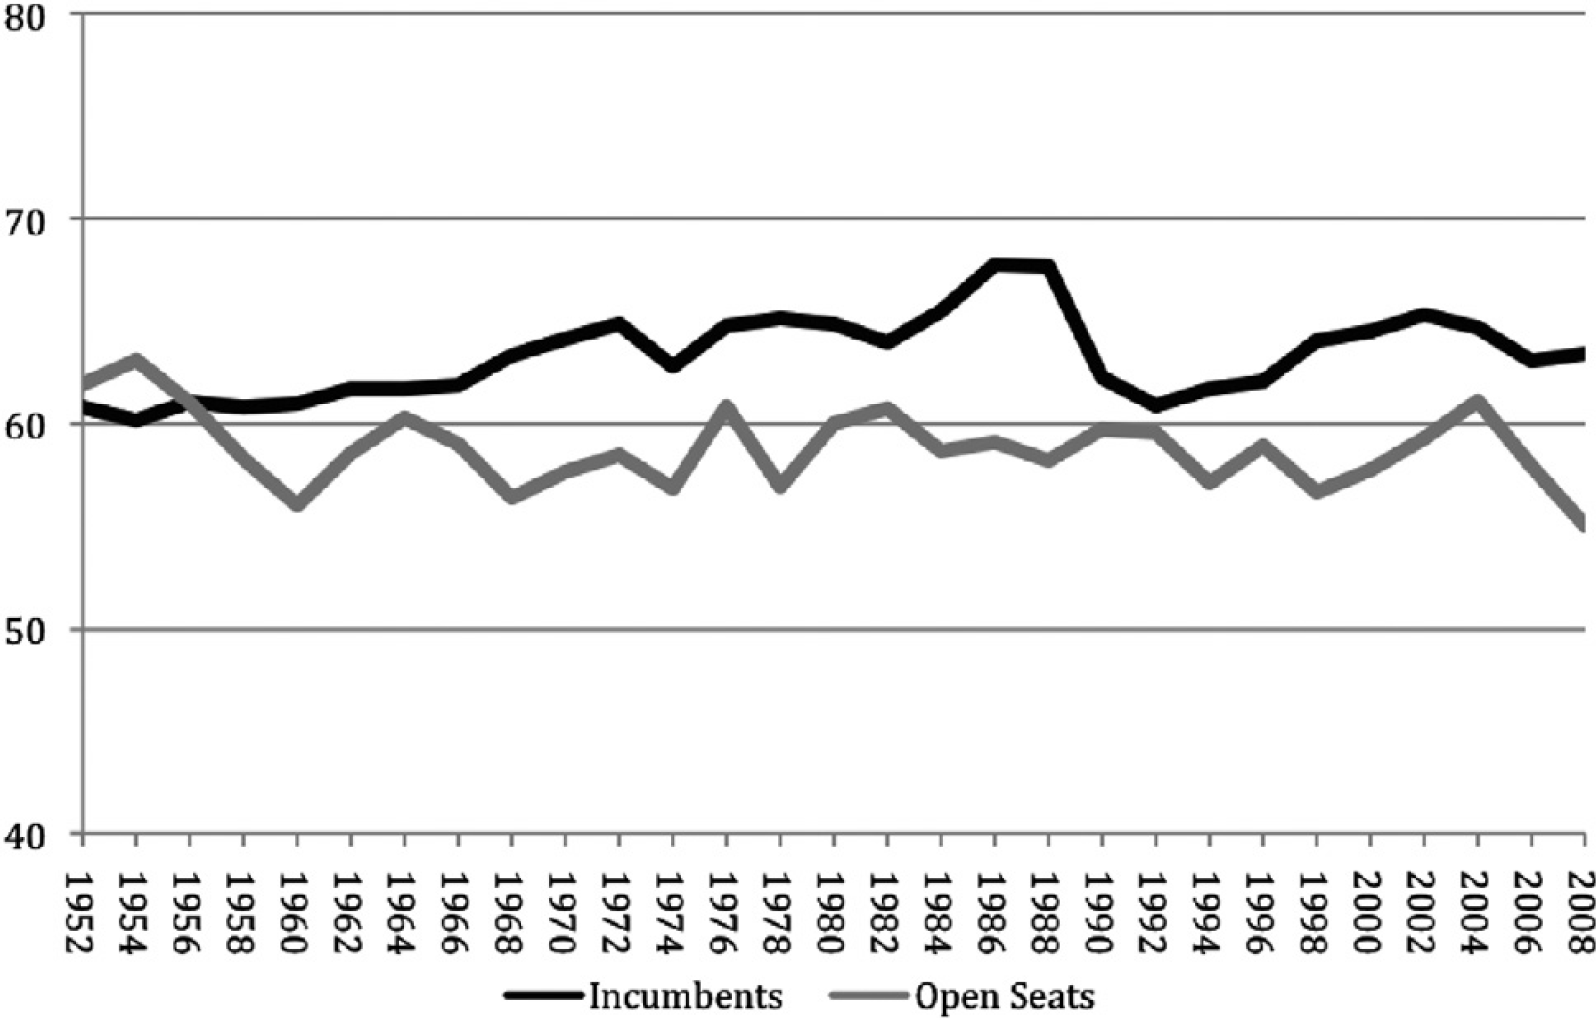
Winner candidates' mean percentage of the total vote in US House of Representatives contested electoral races, 1952–2008
Figure 2 illustrates that, in addition to incumbent candidates failing to increase their vote share sustainably over the past 60 years, there is also no systematic reduction in the number of marginal races over time. While our analysis confirms Mayhew's (1974) study of a clear downward trend in the number of marginal races between 1962 and 1972, we also highlight that this reduction in the amount of competitive races could not be sustained. In fact, Figure 2 displays that, in 1974, the number of marginal races reached levels registered in the 1950s. It then fluctuated constantly, reaching an all-time low in 1988 and an all-time high in 1996.
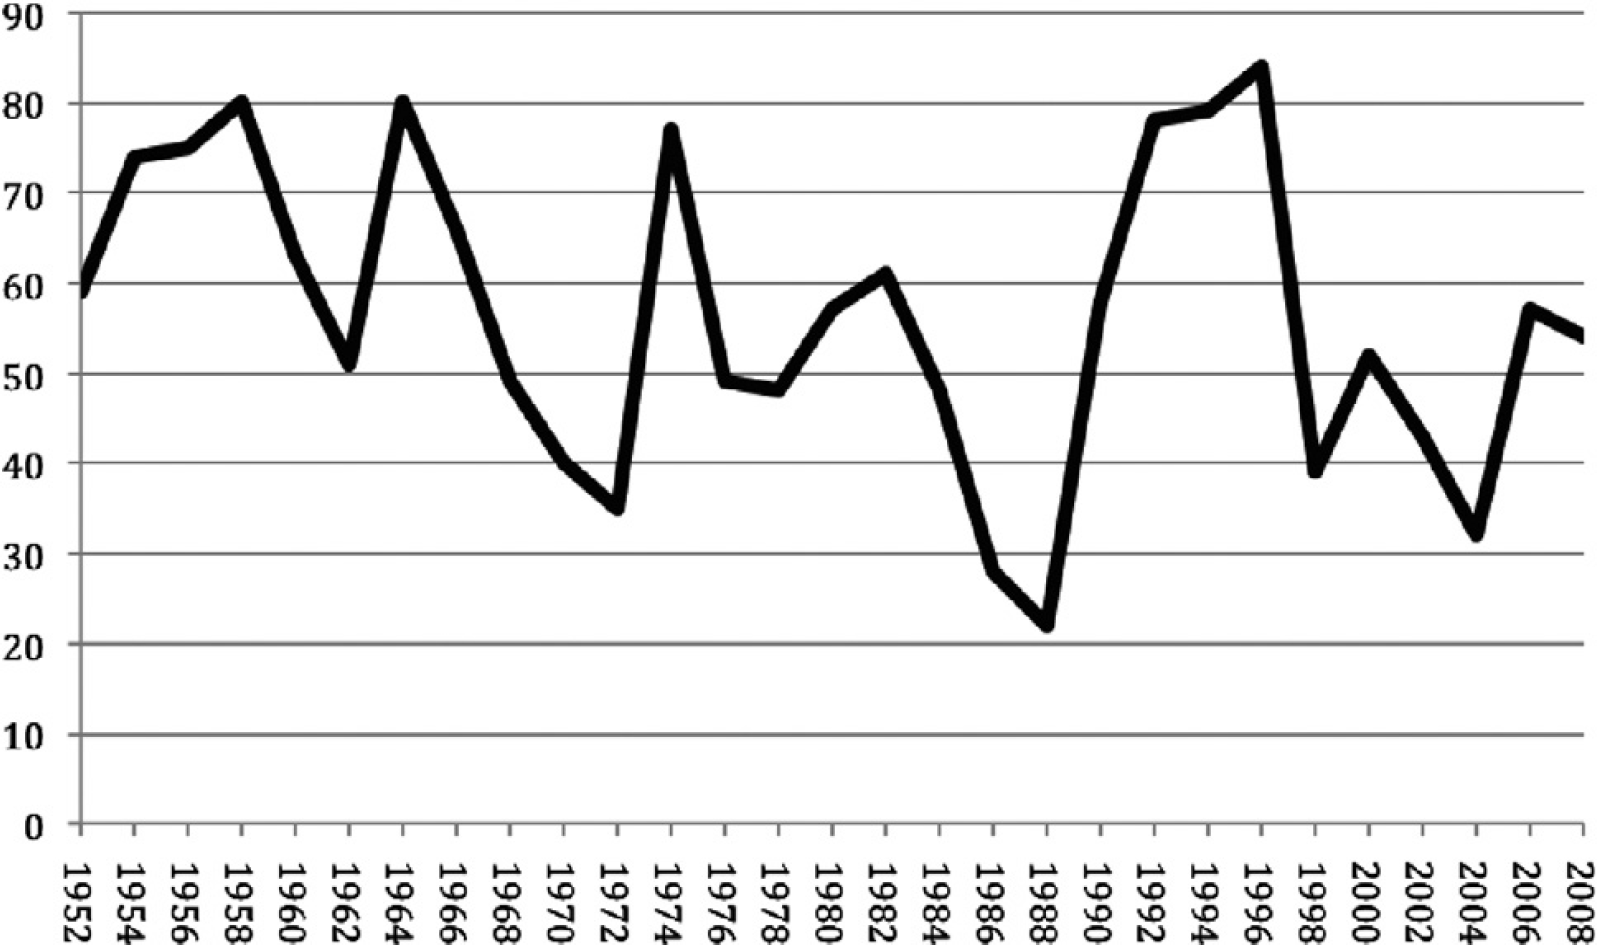
Number of US House of Representatives electoral races won in the ‘marginal’ range (55 per cent threshold) by incumbents, 1952–2008
We obtain the same result if we look at districts that feature incumbent losses. Figure 3 shows the percentage of House races that led to political party switches as a result of an incumbent losing his or her electoral race. Yet again, between 1952 and 2008, there is no discernible decline pattern – only a constant fluctuation. For instance, House incumbents' re-election rates stood at 92 per cent in 1950, at 90 per cent in 1960, at 85 per cent in 1970 and 91 per cent in 1980 (see also Friedman and Holden, 2009). Even more pronounced is a recent tendency of incumbents to lose a non-negligible number of seats (e.g. 36 and 54 running incumbents lost their House seat in the 1994 and 2010 midterm elections, respectively). The fact that, in the last two decades, we find one of the lowest and one of the highest points of both incumbency ‘safety’ (i.e. 2002) and ‘vulnerability’ (e.g. 1994) demonstrates how any pattern of growth or decline of the incumbency advantage seems to be nonexistent (see Figure 3).
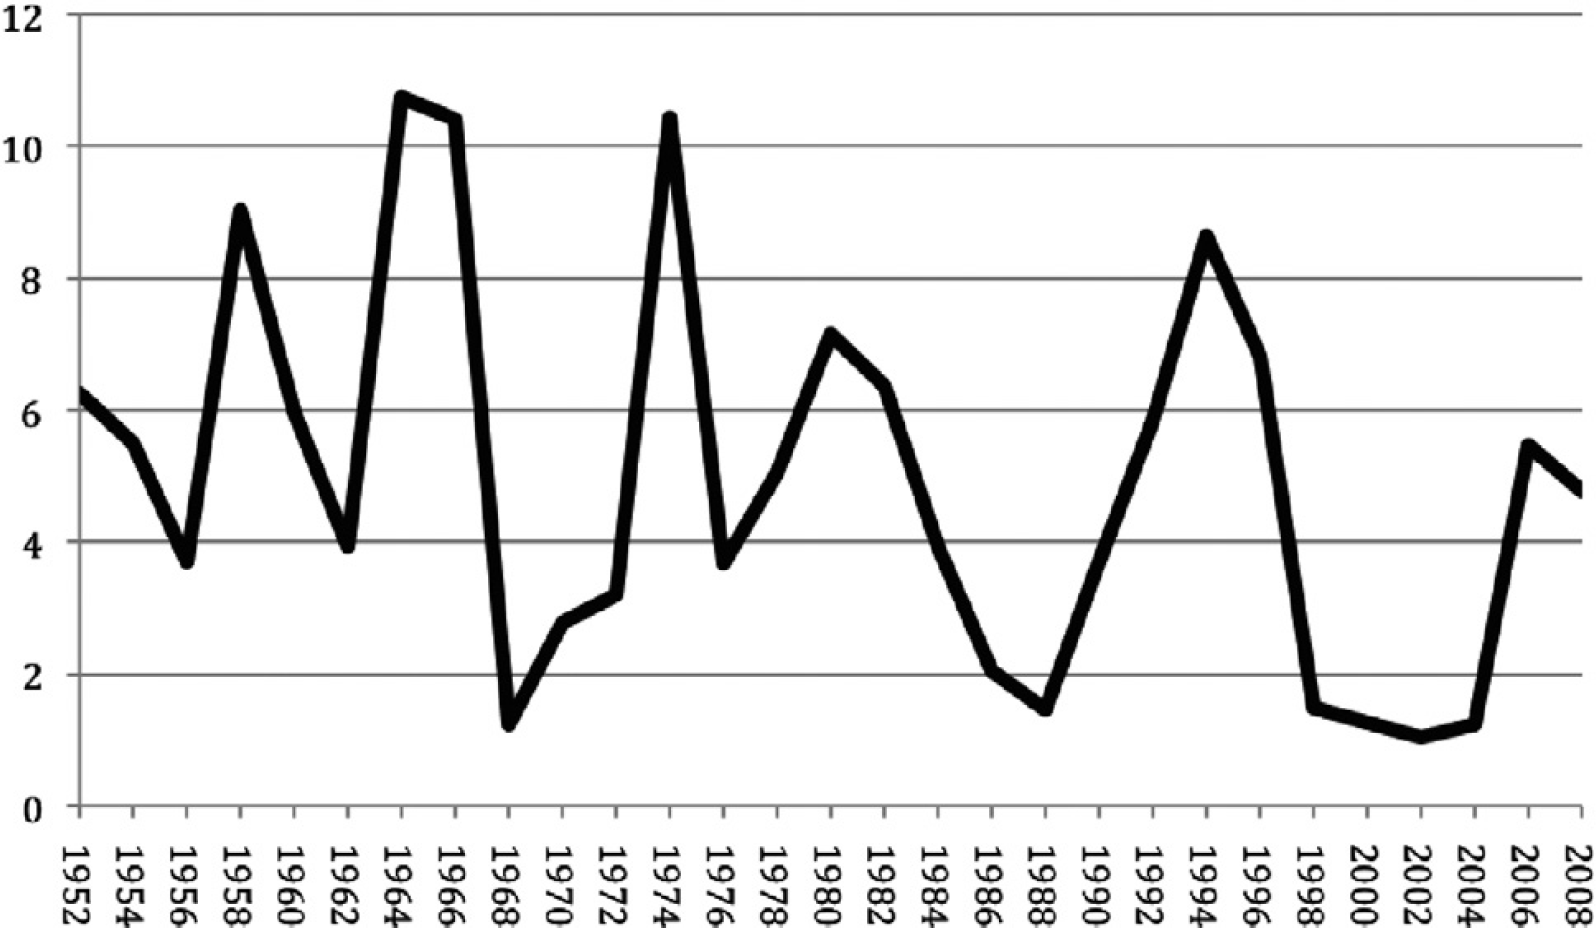
Percentage of US House of Representatives electoral races featuring an incumbent where the incumbent lost the race, 1952–2008
In brief, the data presented here suggest that the incumbency advantage did not start to play a consistent and more important role in congressional elections over the past six decades. On the contrary, it seems that there is no clear pattern of growth of the incumbency advantage over the years. In the next section, we abandon the descriptive year-by-year approach adopted thus far. Instead, we estimate, with the help of multiple comparison statistical techniques, two ANOVA models that compare aggregate-level data of the incumbency advantage across decades. In contrast to Figure 1, this more inferential technique allows us to determine whether the differences in the incumbency advantage are statistically different across decades. It also complements the election year by election year approach adopted up to this point, in that it allows us to detect general patterns in the incumbency advantage over time. Before presenting the results of our two ANOVA analyses, we will operationalise the incumbency advantage.
Defining the incumbency advantage: two very simple measures
We adopt two definitions of the incumbency advantage. For our first measure, we assume that there is an ‘incumbency advantage’ if winning incumbent candidates receive more votes than winning non-incumbent candidates at any given election (cf. Gross and Garand, 1984; Jacobson, 1987). Our second measure of the incumbency advantage is slightly more sophisticated in that it considers the different starting points of congressional careers. For instance, if Representative X gets elected to office for the first time with 80 per cent of the total vote, obtaining 88 per cent two years later could be attributed to his or her incumbent status. Conversely, a very successful victory with 70 per cent of the total vote two years later must be somehow accounted for since any speculation of the incumbency advantage does not hold in this case, regardless of his or her comfortable, ‘non-marginal’ electoral victory. Consequently, our second measure of the incumbency advantage is defined as follows:

where: Ψ is the incumbency advantage obtained by an incumbent candidate at election t; Vt is the total share of the vote obtained by an incumbent candidate at election t; and Vt0 is the total share of the vote obtained by the same candidate the first time he or she was elected.
In essence, this second measure illustrates whether a specific candidate gathers more or fewer votes in successive elections than the first time he or she was elected to office. In the following section, we estimate two simple univariate statistical models that compare our two measures of the incumbency advantage throughout the years. Both analyses reveal that the incumbency advantage grew from the 1960s to the 1980s and then returned to its 1960s levels in the 1990s and to its 1970s levels in the 2000s.
Comparing the incumbency advantage across decades
To determine whether there is any significant difference in the vote share of incumbents across decades, we created an ordinal time variable by coding the 1950s zero, the 1960s one, the 1970s two, the 1980s three, the 1990s four and the 2000s five. 3 For both analyses, we used this time variable as the grouping variable in two LSD ANOVA analyses. The dependent variable in our first model is the share of the total vote obtained by incumbent candidates in every US House election between 1952 and 2008. In our second model, the dependent variable is our alternative measure of the incumbency advantage based on the difference of votes obtained by incumbent candidates keeping their first electoral victory as the baseline. Recall that we assume that if there is a sustained incumbency advantage, we should see an increase in the vote share and vote margins between incumbents and non-incumbents across decades.
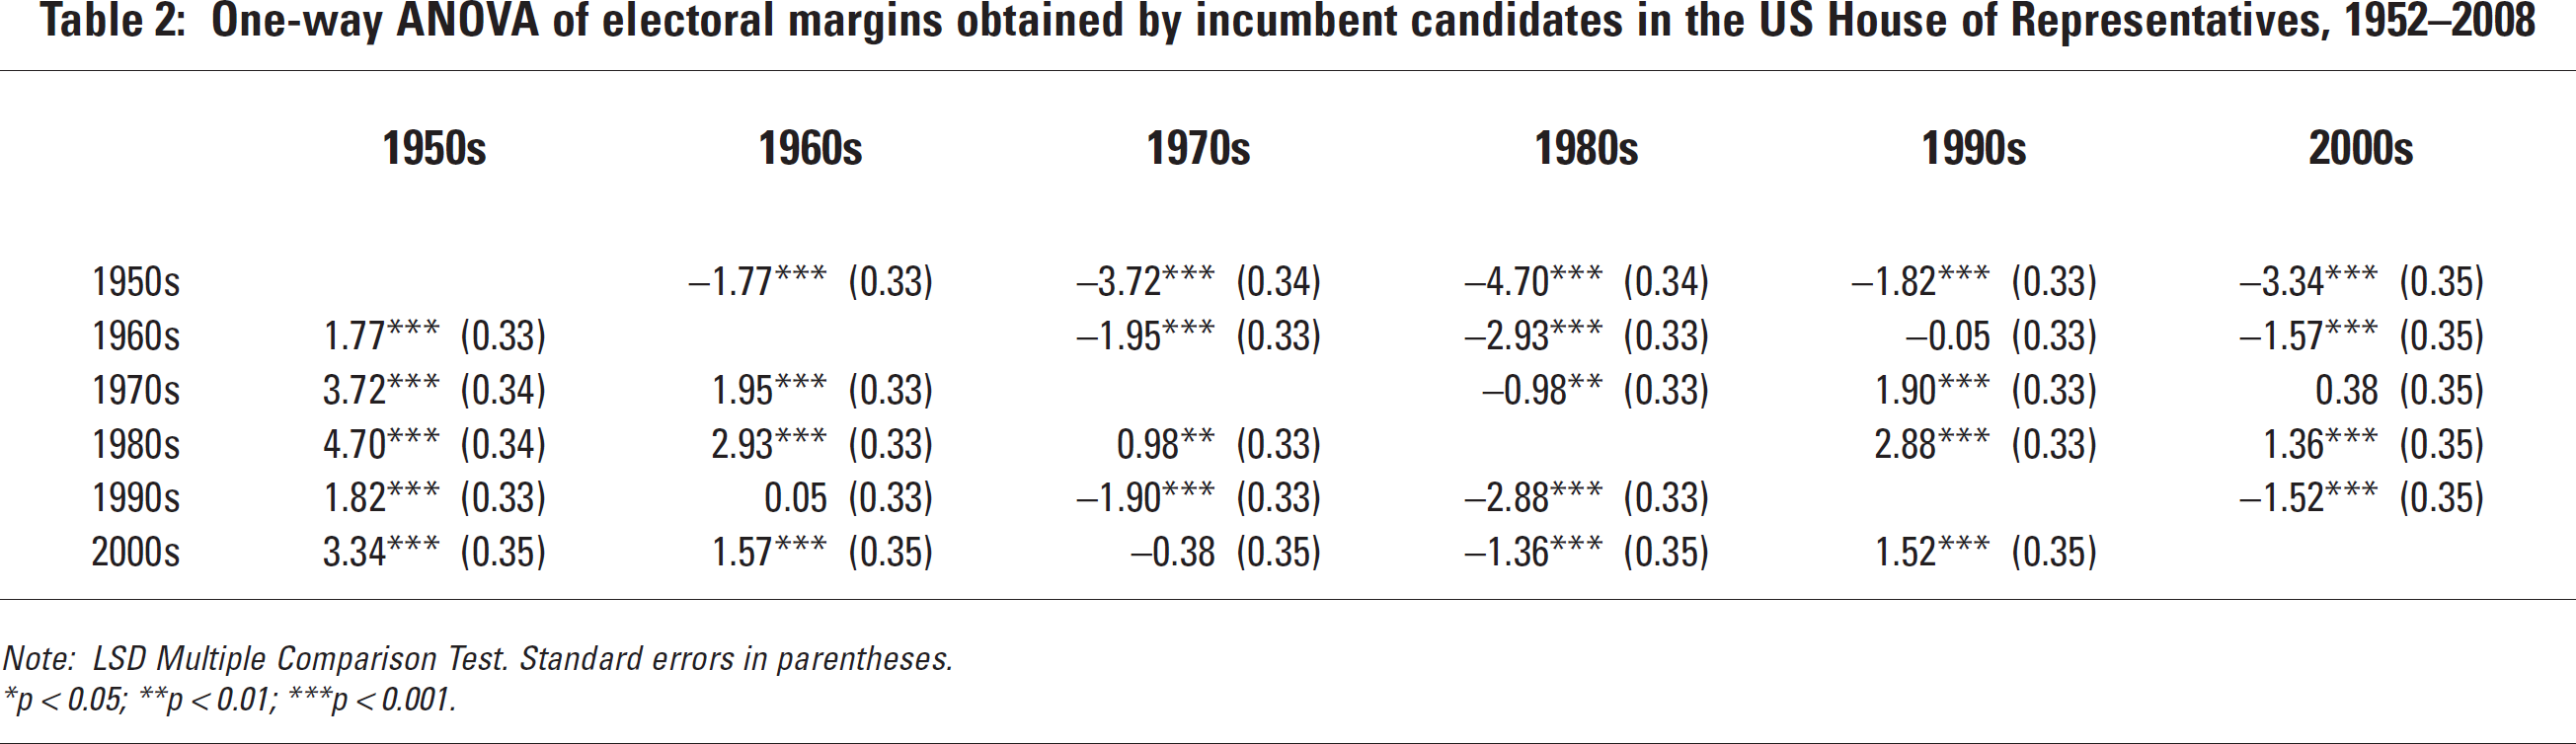
Tables 1 and 2 illustrate that, regardless of the measure used for the incumbency advantage, there is a moderate incumbency advantage in the 1960s and 1970s, which tapers off or even declines thereafter. More specifically, the third column of Table 1 compares the overall vote share incumbents receive in each decade – 1950s, 1960s, 1980s, 1990s and 2000s – to their percentage of the vote obtained in the 1970s. In interpreting this column, we find a rather substantive increase in the 1970s from the 1950s and, to a lesser degree, from the 1960s but no sustained growth thereafter. To the contrary, in the 1990s, the average incumbent received approximately 1.6 fewer percentage point votes than he or she did two decades earlier. In the 2000s, a sitting member of the House of Representatives was expected to receive a very similar vote share as in the 1970s. Table 2, which compares the average vote margins between incumbents and non-incumbents, supports this prediction. If we go back to the third column, which features the 1970s as a reference category, we see that incumbents respectively increased their vote margins by close to 4 percentage points from those in the 1950s and nearly 2 percentage points from those in the 1960s. However, subsequent decades did not see any sustained growth. Rather, incumbents' vote difference decreased by 1.6 points in the 1990s and remained the same in the 2000s as compared to the 1970s.
One-way ANOVA of total incumbency advantage obtained by incumbent candidates in the US House of Representatives, 1952–2008
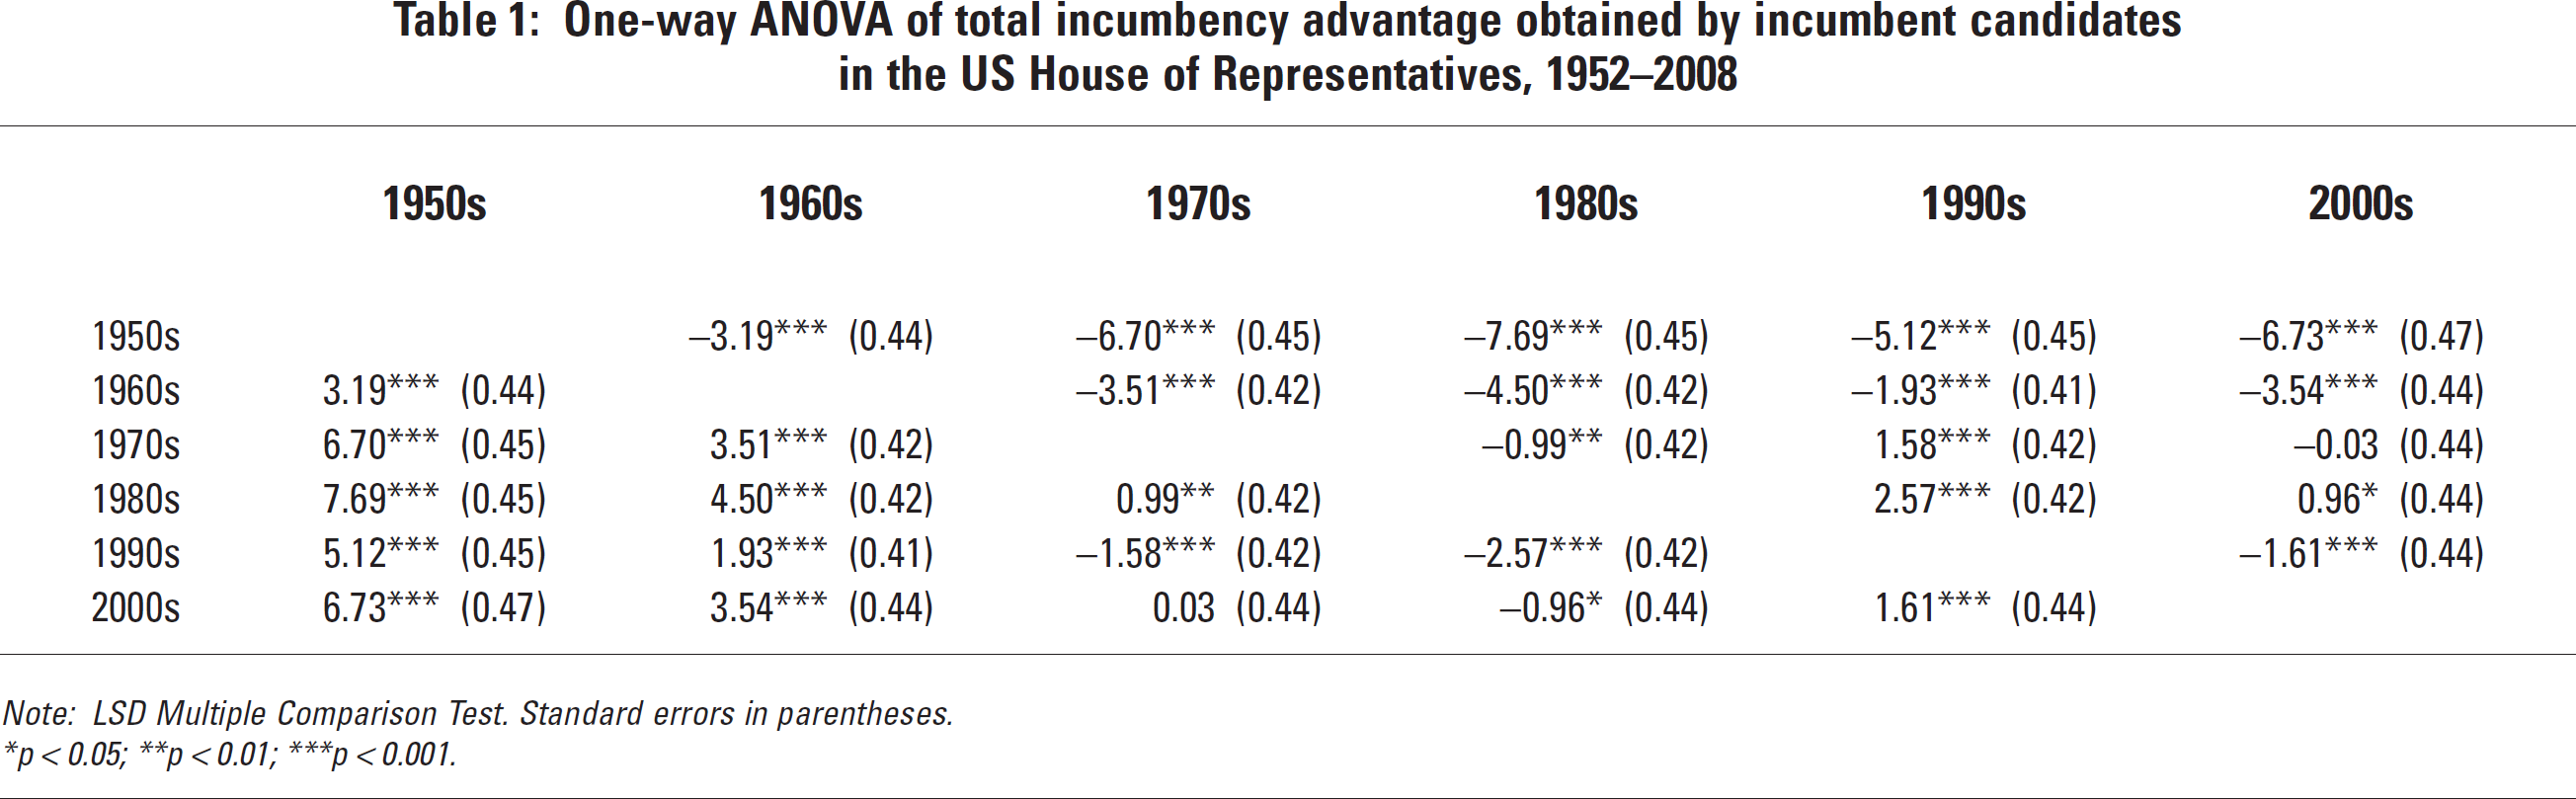
Note: LSD Multiple Comparison Test. Standard errors in parentheses.
p < 0.05;
p < 0.01;
p < 0.001.
One-way ANOVA of electoral margins obtained by incumbent candidates in the US House of Representatives, 1952–2008
Note: LSD Multiple Comparison Test. Standard errors in parentheses.
p < 0.05;
p < 0.01;
p < 0.001.
All in all, our analysis indicates a moderate growth of the incumbency advantage in the 1960s, the 1970s and to a lesser degree in the 1980s. Following the 1980s, the growth in the vote of sitting House members could not be sustained or even reversed. In the 1990s, the aggregate level of the incumbency advantage stood roughly at the levels registered in the 1960s. Interestingly, in the successive decade (the 2000s), the incumbency advantage seemed to grow once again, standing at levels comparable to those registered in the 1970s. Consequently, it appears that the upward trend manifested in the 1960s and 1970s was more of a temporary growth in the incumbency advantage rather than any sustainable and systematic pattern. In this sense, rather than following a linear trajectory, the incumbency advantage has followed more of a roller-coaster pattern with ups and downs over the past six decades.
We invite scholars to reconsider, not only the paradigm of the growth of the incumbency advantage in the decades following the 1960s, but also its possible causes. If the incumbency advantage grew between the 1960s and the 1980s, and then reverted in the 1990s to its 1960s overall size, then most of the suggested causes of the incumbency advantage based on the pre- and post-1960s paradigm will likely turn out to be invalid or offer partial explanations, at best. While this might involve some reorientation in the Congress literature, it can nevertheless create some much-needed clarity within the incumbency scholarship and beyond.
Conclusion
Our article has contributed to the incumbency literature in two distinct ways. Using two simple, intuitive and efficacious ways to measure the overall size of the incumbency advantage (i.e. the overall vote share of incumbents and the winning margins), we provided considerable descriptive and inferential evidence that the vote of incumbents has not constantly increased in US House of Representatives elections in the past 60 years. Rather, we highlighted that the incumbency advantage grew in the 1960s and 1970s, grew to a lesser degree in the 1980s, and then retrogressed to its 1960s level in the 1990s and to its 1970s level in the 2000s.
Ultimately, our analysis is extremely important for future work dealing with the causes of the incumbency advantage. Scholars have been consumed for the past 30 years with trying to understand why the incumbency advantage grew after the 1960s. As pointed out, to date, there is no definitive answer; only a number of plausible hypotheses corroborated by different statistical correlations. The fact that the magnitude of the incumbency has not risen monolithically but rather followed a roller-coaster relationship adds a new chapter to this body of work. In fact, thanks to the pattern we unveil, it is possible to re-evaluate whether the causes of the incumbency advantage lie, indeed, in the growth of the bureaucracy (i.e. Fiorina, 1977), in different relations between representatives and constituents (i.e. Abramowitz, 1975; Feldman and Jondrow, 1984; Jacobson, 1981; Johannes and McAdams, 1981; Mann and Wolfinger, 1980; Parker, 1980; Ragsdale and Cook, 1987) or in the change of voter behaviour due to a decline in partisan identification (i.e. Ferejohn, 1977; Krehbiel and Wright, 1983; Nelson 1978). All of these major events changed the political landscape of the 1960s.
Some of these same ‘causes’ might also explain the regression in the vote margins of sitting Members of Congress in the 1990s. While the bureaucracy has continuously grown over the past 50 years, and hence can be ruled out as a trigger for the changing nature of the incumbency advantage in the 1990s and 2000s, the same does not necessarily apply to the two other factors – the relations between representatives and voters, as well as the partisan identification patterns. For instance, the Republican revolution of the 1990s, which brought the Grand Old Party (GOP) back in control of the House of Representatives after four decades of uninterrupted Democratic control, might not only have been a major cause of many incumbent Democrats' electoral losses, it might have also brought down the vote margins of sitting Democratic members of Congress. These are two scenarios that might have contributed to the declining incumbency advantage in the 1990s. While we cannot sustain or reject such speculations here, we invite scholars to undertake the important task of finding the major sources of the incumbency advantage. We strongly believe that knowing the pattern of growth and decline of this phenomenon will help our understanding of American politics and beyond.
Footnotes
1
2
Data for the three figures as well as for the calculation of both measures of incumbency were gathered from the Office of the Clerk of the House of Representatives.
3
In order to take into account redistricting activities, each decade starts with the year ending in ‘2’ and includes the first election in the successive decade ending in ‘0’. Therefore, the 1970s, for instance, include the elections held in 1972, 1974, 1976, 1978 and 1980.