
Abstract
One way to increase choice of healthy over unhealthy behaviors is to increase the cost of less healthy alternatives or reduce the cost of healthier alternatives. The influence of price on purchases of healthy and unhealthy foods was evaluated in two laboratory experiments. In Experiment 1, thirty-two 10- to 12-year-old youth were given $5.00 and allowed to purchase multiple portions of a healthy food (fruit or vegetable) and a less healthy food (higher-fat snack). The price of one type of food varied from $0.50 to $2.50, while the price of the other type was held at $1.00. Increasing the price of a type of food reduced purchases of that type of food, but did not lead to substitution with the alternative type of food. In Experiment 2, twenty 10- to 14-year-old youth were given $1.00, $3.00, and $5.00 to purchase healthy and unhealthy foods. The price of each food was raised and lowered by 25% and 50%. Raising the price of healthy or unhealthy foods resulted in decreased purchases of those foods, and income available interacted with price to predict the pattern of substitution of alternative foods. These results show the potential for controlled laboratory studies of price and food purchases, and show that the substitution of healthier for unhealthy food is related to available money.
The prevalence of overweight and obesity in American youth is increasing (Kuczmarski, Flegal, Campbell, & Johnson, 1994; Ogden, Flegal, Carroll, & Johnson, 2002). Obesity is a result of positive energy balance and is due, in part, to excess intake of energy-dense, nutrient-poor foods and a sedentary lifestyle (Epstein, Roemmich, & Raynor, 2001). Interventions to treat or prevent obesity must shift food choice from energy-dense foods to healthier low-fat, nutrient-dense alternatives. One way to shift choice from less healthy to healthier foods is to place constraints on access to unhealthy foods (Goldfield & Epstein, 2002; Smith & Epstein, 1991). An alternative approach to shifting choices is to vary the cost of alternative commodities (Hursh & Bauman, 1987; Rachlin, 1989). Increasing the price of unhealthy foods by taxing high-fat, low-nutrient snack foods (Jacobson & Brownell, 2000) may reduce consumption of less healthy foods, and decreasing the price of healthier, low-fat snack foods in vending machines (French et al., 1997) and the prices of fruits and vegetables and low-fat foods in cafeterias (Cinciripini, 1984; French et al., 1997; Jeffery, French, Raether, & Baxter, 1994) can increase consumption of healthy alternatives.
Increasing the price of a commodity should reduce consumption of that commodity, a phenomenon termed same-price elasticity (Bickel, Madden, & Petry, 1998). In addition, if the price of a commodity increases and the purchase of another commodity decreases (e.g., as the price of hot dogs increases, purchases of mustard decrease), that indicates a complementary relationship between price of the first commodity and purchase of the second. Increasing the price of one commodity may also increase consumption of a substitute commodity, a phenomenon called cross-price elasticity. The tendency to substitute may be affected by income. Laboratory research has shown that when the income available to purchase puffs of a cigarette is reduced, smokers are more likely to substitute puffs from an alternative brand that is lower in price than to stay with their preferred brand (DeGrandpre, Bickel, Rizvi, & Hughes, 1993). Extended to food purchases, this research suggests that relative to other children, those who have less available money to spend may choose healthier foods when the price of less healthy foods increases, despite having a greater preference for unhealthy foods.
In this article, we present two experiments that tested the relationship between changes in price and purchases of food in a laboratory setting. Experiment 1 tested the influence of price changes and overweight status on purchases of food in 10- to 12-year-old youth. Obese youth may value energy-dense foods more than nonobese youth and may be less responsive to shifts in price. Experiment 2 used a similar paradigm to assess the influence of changing prices on purchases of foods in 10- to 14-year-olds when their available income was manipulated.
EXPERIMENT 1
Method
Participants
Participants were thirty-two 10- to 12-year-old children recruited through flyers distributed to students in school and through newspaper advertisements. Interested parents and children were screened by telephone to ensure that they met the following study criteria: at least moderate liking (rating ≥ 4 on a 9-point Likert-type scale) for one snack food, one fruit or vegetable, one sedentary activity, and one physical activity; no current psychopathology or developmental disability; and no medical condition that would prevent the child from engaging in usual physical activities. The study sample was 20% African American and 65% Caucasian; 15% of the children were of other races or mixed race. Fifty-three percent of the children were overweight or at risk for overweight, with overweight or at risk for overweight defined as being above the 85th body mass index (BMI) percentile (Kuczmarski et al., 2002)
Eligible participants were scheduled to attend one 90-min laboratory session. They were asked not to eat for at least 3 hr or engage in vigorous physical activity for 8 hr prior to the appointment. Subjects could earn up to $20 for completing the experiment. The study was approved by the University at Buffalo Social and Behavioral Sciences Institutional Review Board, and parents and youth signed consent and assent forms prior to participating.
Design and Procedure
Participants were studied in each of two food conditions that involved purchase of a snack food versus a fruit or vegetable. In one condition, the cost of a preferred snack food varied from $0.50 to $2.50 in $0.50 increments, while the cost of a preferred fruit or vegetable remained constant at $1.00. In the other condition, the cost of a preferred fruit or vegetable was varied from $0.50 to $2.50, while the cost of a preferred snack food remained constant at $1.00. After making purchases in the two food conditions, the youth also participated in conditions involving purchases of physical activities and sedentary behaviors, but this second phase of the experiment is not reported here.
Upon arrival at the laboratory, the youth and their parents read and signed assent and consent forms, respectively; parents also completed a demographic questionnaire that included assessment of socioeconomic status (Hollingshead, 1975). Each child was asked to list the foods he or she had eaten that day, and the child's level of hunger was measured on a 5-point Likert-type scale (1 =not hungry, 5 =extremely hungry). The child's weight and height were measured on a digital scale and stadiometer to determine his or her BMI (kg/m2) and BMI percentile based on age and sex (Kuczmarski et al., 2002). The child was then presented with bite-sized portions of 12 different foods to taste: 1 Chips Ahoy!® chocolate-chip cookie, 2 plain M&M's®, 1/4 Ho Hos® chocolate cake roll, 1 Lay's® potato chip, 1/12 Hershey's® chocolate bar, 1 Doritos® Nacho Cheese Tortilla Chip, 1 cherry tomato, 1/2 baby carrot, 1 small wedge of D'Anjou pear, 1 green Chilean grape, 1 baby corn, and a 2.7-g wedge of Empire apple. If the child ate all the foods in the taste test, the energy consumed approximated 146 calories. The child rated how much he or she liked each food using a 9-point Likert-type scale (1 =do not like, 9 =like very much) and indicated his or her favorite snack food and favorite fruit or vegetable; these favorites were then used in the food choice task.
In the choice tasks, participants used plastic tokens to purchase food. On each trial, their favorite energy-dense snack food and their favorite fruit or vegetable were available for purchase. They were provided 20 red, plastic tokens worth $0.25 each, for a total of $5.00. In one choice task, the price of one commodity (e.g., apple) increased from $0.50 to $2.50 (in $0.50 increments) over five trials, while the price of the other commodity (e.g., potato chips) was held constant at $1.00. In the other choice task, the commodity that previously rose in price (e.g., apple) was held constant at $1.00, and the price of the other commodity (i.e., potato chips) changed from $0.50 to $2.50 across five trials. After the experimental trials were completed, the youth were provided the foods purchased on an arbitrarily selected choice trial.
On each trial, the experimenter placed two plates of food on the table. One contained a $1.00 portion of the child's favorite snack food, and the other contained a $1.00 portion of the child's favorite fruit or vegetable. For each food, the $1.00 portion was calculated from local supermarket prices. The $1.00 portions were as follows: 7 Chips Ahoy!® chocolate-chip cookies (67 g), almost two 1.69-oz bags of M&M's® (79.8 g), 2 Ho Hos® (57 g), 40 Lay's® potato chips (57 g), 1½ 1.55-oz Hershey's® chocolate bars (67 g), 26 Doritos® Nacho Cheese Tortilla Chips (66 g), 1 half-pint of cherry tomatoes (147 g), 2/3 of a 16-oz bag of baby carrots (303 g), 1 pear (255 g), 1.8 cups of grapes (305 g), 9 baby corns (91 g), and 1 apple (228 g). Prior to the choice trials, the children were told that they would be making several food purchases and that the cost of each plate of food could change for each purchase. They were provided a practice trial to ensure that they understood the instructions. On each trial, they began with $5.00 (i.e., leftover money did not apply to later trials) and were allowed to purchase as many portions of either or both foods as they wanted without exceeding that amount. Whether the price of the healthy or less healthy alternative was manipulated first was counterbalanced across subjects. We asked 8 of the participants to repeat the experiment after 12 months to assess the reliability of the results.
Analytic Plan
We used one-way analysis of variance (for continuous variables) and chi-square tests to determine whether the boys and girls who participated in this experiment differed in height, weight, BMI, liking ratings, hunger ratings, and socioeconomic status. Separate random regression models with random intercepts were used to assess same- and cross-price elasticity for purchases of healthy or unhealthy foods. Log values of the purchases and prices were used in the regression models. Additional factors of age, sex, BMI, average liking for foods in the study, socioeconomic status, and hunger were added to the models. All predictors were initially put into the models, and nonsignificant variables were removed using backward regression to identify the best-fitting model.
Negative estimates for the relation between the price of a type of food and purchases of that type of food (e.g., as the price of snacks went up, purchases of snack foods decreased) indicate same-price elasticity, whereas positive estimates for the relation between the price of a type of food and purchases of the other type of food (e.g., as price of snack foods went up, purchases of fruits and vegetables increased) indicate cross-price elasticity, or substitution.
We report both traditional probability levels and p rep, the probability of replicating the results (Killeen, 2005). Effect sizes for the regression models were calculated by the following formula: regression coefficient/√cluster variance + residual variance. Analyses were completed using Systat software (Systat Software, 2004). The analytic plan to assess the repeatability of the findings was similar, with session added in the regression model.
Results
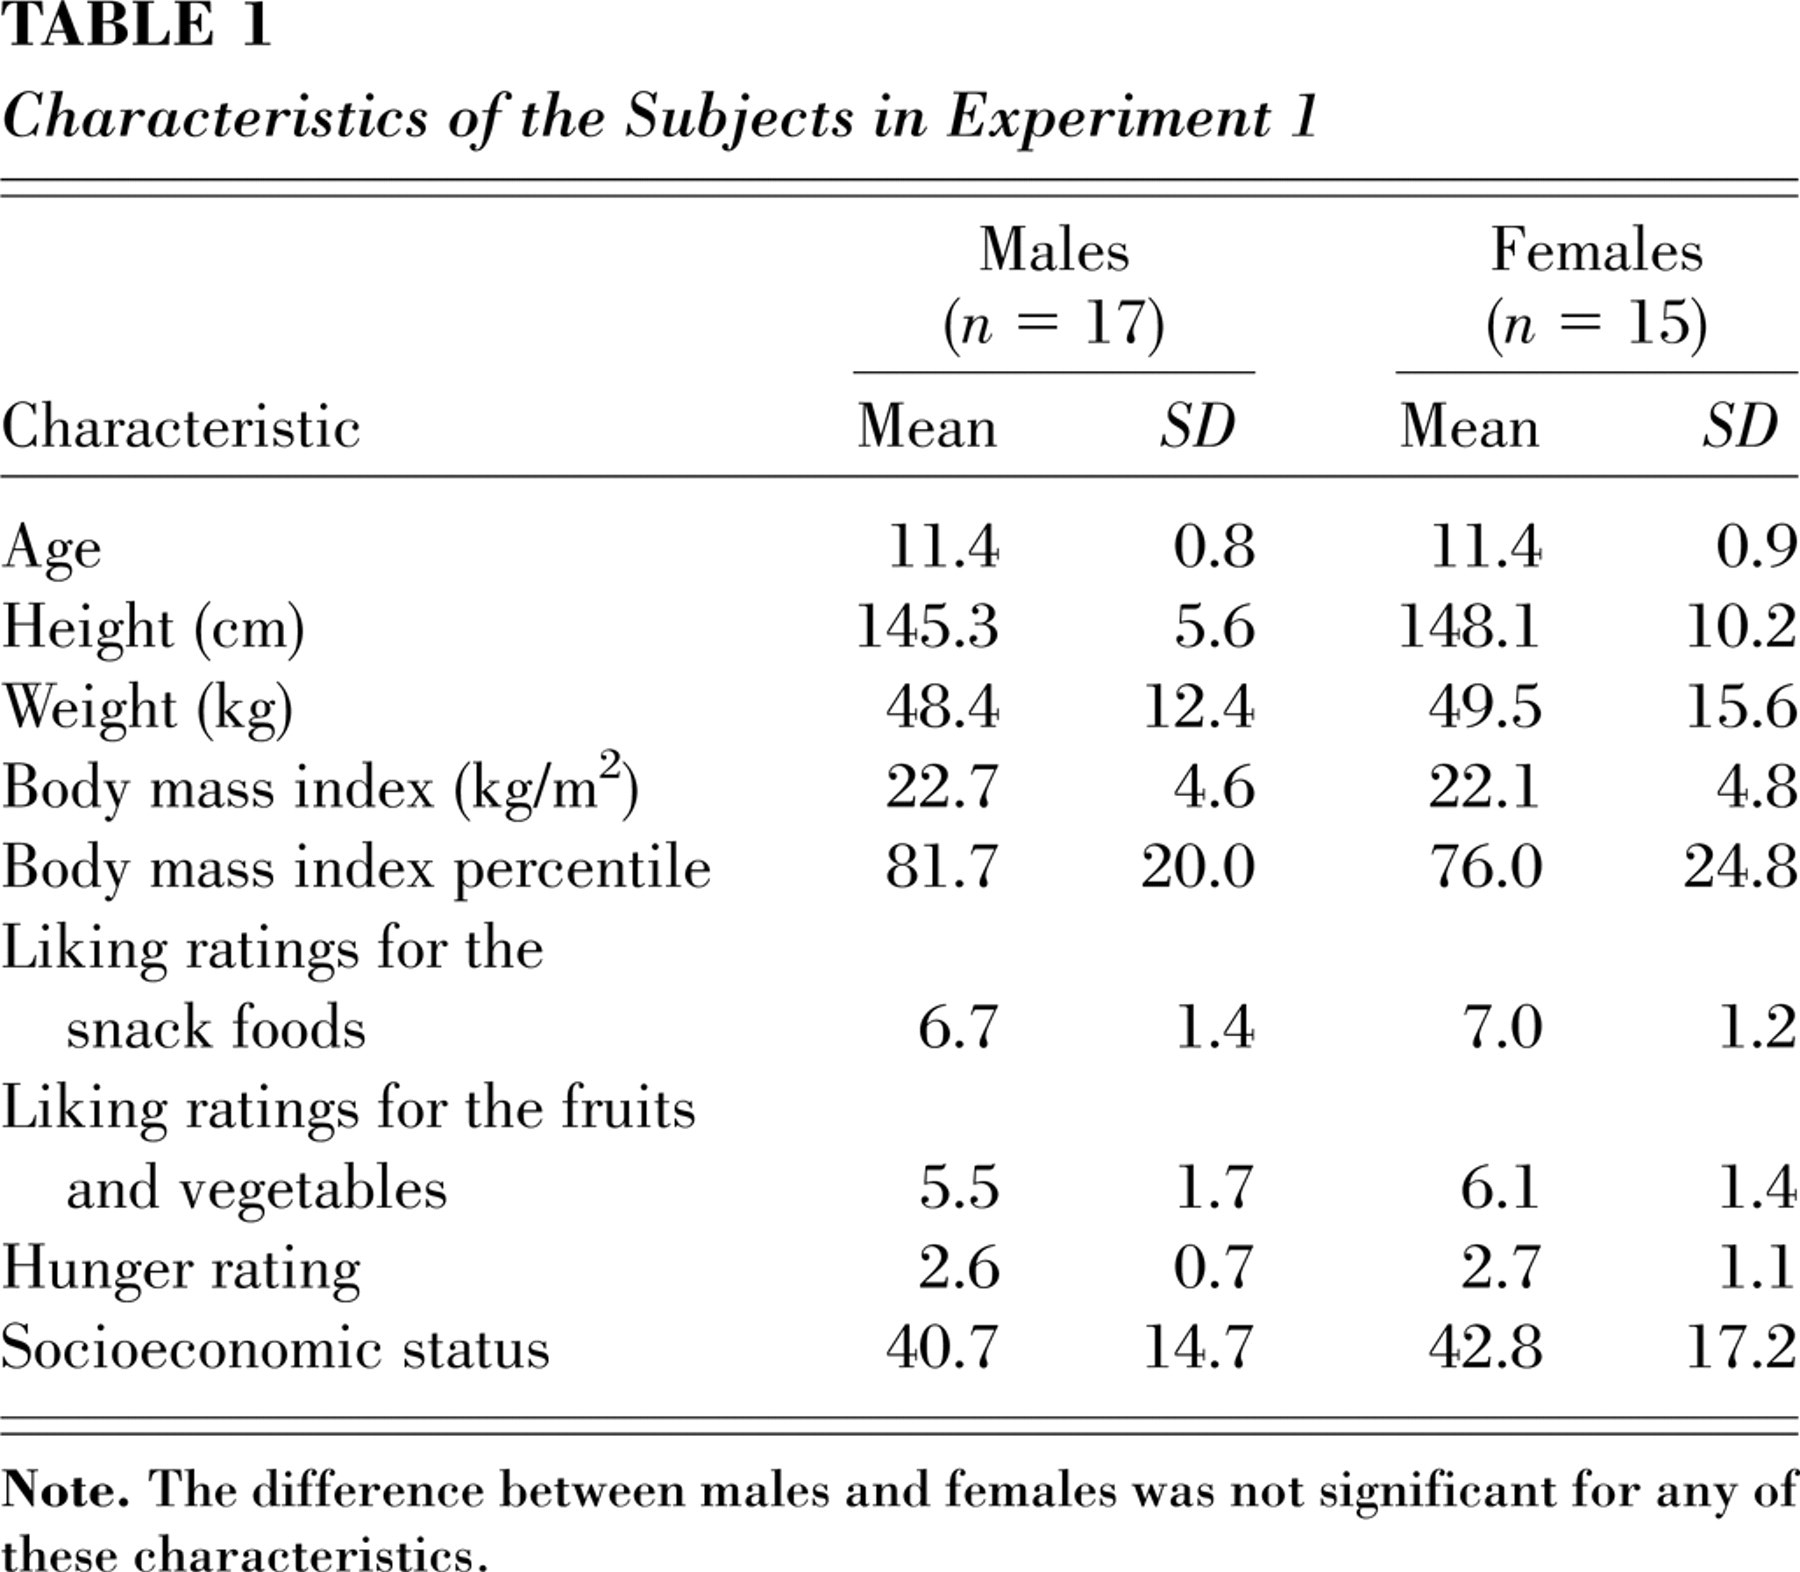
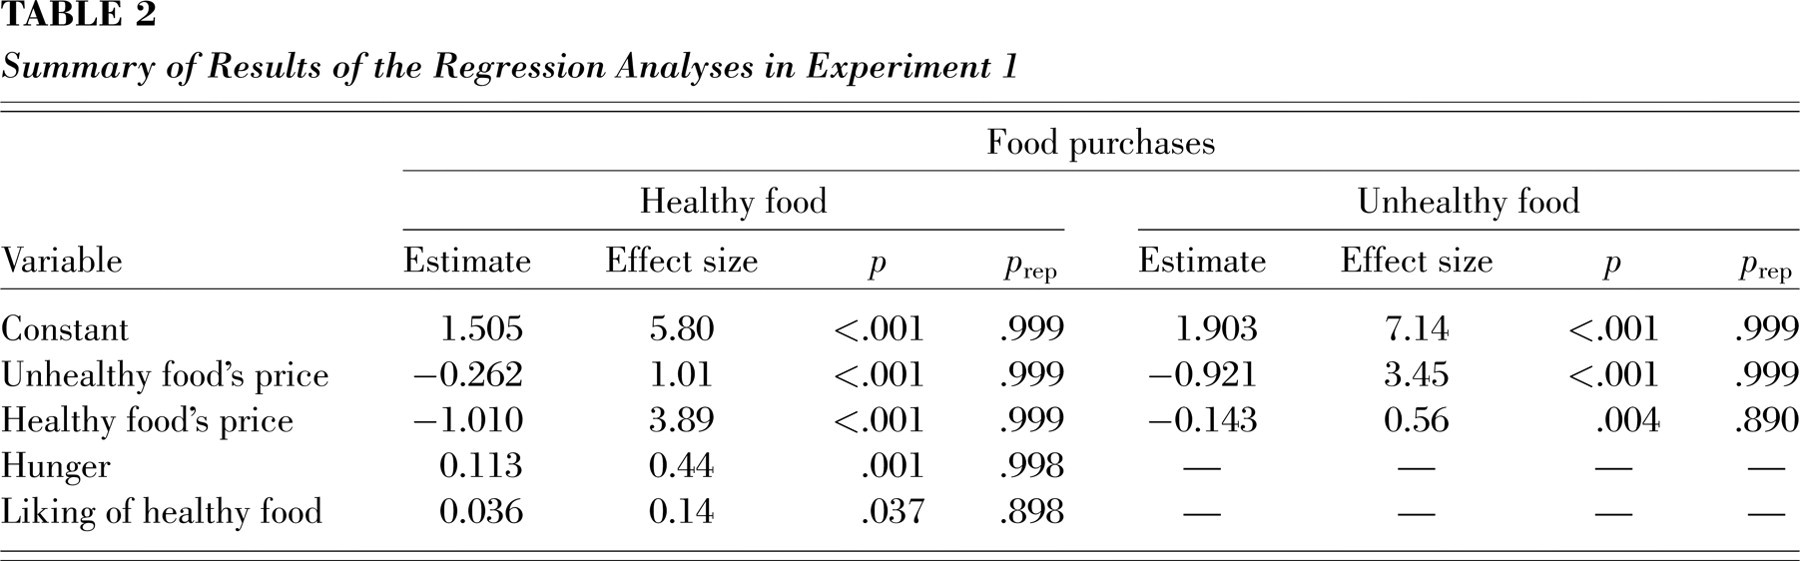
The statistical tests revealed no significant differences between males and females in age, height, weight, BMI, liking ratings, hunger ratings, or socioeconomic status (see Table 1). The regression models are summarized in Table 2. The estimates for same-price elasticity for healthy and unhealthy foods were significant and strong (−1.010 and −0.921, respectively). The estimates for cross-price elasticity were also negative and significant (−0.262 and −0.143 for healthy and unhealthy foods, respectively), but lower than the estimates for same-price elasticity. These results indicate complementary relationships between price of one type of food and purchase of the other. Hunger and liking also predicted purchases of healthy, but not unhealthy, foods. The other predictor variables, including BMI, were not significant predictors of purchases. In the models describing purchasing behavior in the repeated testing, session did not interact significantly with the price of healthy or unhealthy foods in predicting the relation between prices and purchases.
Characteristics of the Subjects in Experiment 1
Summary of Results of the Regression Analyses in Experiment 1
EXPERIMENT 2
The results of Experiment 1 showed same-price elasticity, as the purchase of foods was strongly dependent on their price. However, there was no evidence of substitution, which may have been a function of the amount of money available to the children. Outside of the laboratory setting, youth will have varying amounts of money available when they go to the store to purchase food. The money they have available depends in part on their allowance, parental rules about having money, and family income. Because income has been observed to influence substitution in laboratory research (DeGrandpre et al., 1993), we varied participants' income in Experiment 2 to see if substitution was more likely when participants had less money available to buy foods.
Method
Participants and Procedure
The participants were twenty 10- to 14-year-old children. Seventy-five percent were Caucasian, 10% were African American, and 15% were of other races or mixed race. Thirty percent were at risk for overweight or overweight. The methods were identical to those of Experiment 1 with the following exceptions. Subjects could earn up to $15 for completing the experiment. We studied purchases of eight foods, classified as lower in fat, sugar, and calories (more healthy) or higher in fat, sugar, and calories (less healthy). The healthy foods were one wedge of Empire apple (2.7 g, 3.2 kcal), one pretzel (Rold Gold® Twist, 3.1 g, 12.2 kcal), approximately one tablespoon of vanilla yogurt (Dannon® Lite ‘n’ Fit, 28.3 g, 15 kcal), and approximately 3 fl. oz. of milk (Upstate Farms® Fat Free Milk, 33.75 kcal). The four less healthy foods were one chocolate-chip cookie (Mini Chips Ahoy!®, 5.8 g, 28.3 kcal), one potato chip (Lay's® Original, 1 g, 7.5 kcal), approximately one tablespoon of chocolate pudding (Wegman's Food Markets, 28.25 g, 40 kcal), and approximately 3 oz. of cola (PepsiCo, 37.5 kcal). Consuming all foods during the taste test would amount to an intake of approximately 177 kcal.
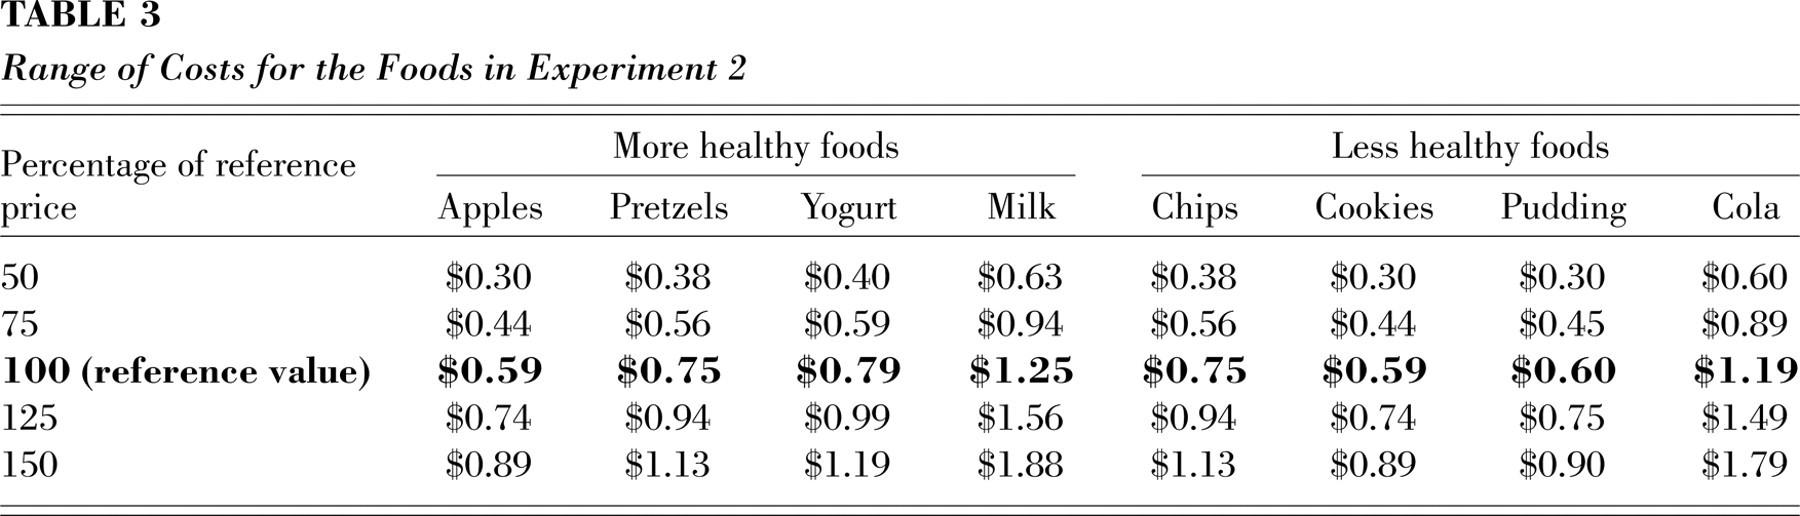
Participants used imitation U.S. coins (“Stash O' Cash,” Small World Toys®, Culver City, CA) to purchase portions of the eight snack foods. Each food was assigned a reference price (100%) based on the average cost per portion at local supermarkets and vending machines. The choice task was designed so that for five trials the prices of one set of food alternatives (four healthy snack items or four energy-dense snack items) increased from 50% below the reference values to 50% above the reference values in intervals of 25%, while the prices of the other set of alternatives were held at the reference values. In another five trials, the prices for the set of alternatives that previously changed in price were held constant at the reference values, while the prices of the other set of food alternatives randomly changed from 50% below to 50% above the reference values. Subjects completed 10 trials for each of three income levels ($1, $3, and $5), for a total of 30 trials.
In the choice task, portions of the eight experimental foods (Table 3) were lined up on the table in front of the child. The foods were 1 pint (16 oz.) of Upstate Farms® Fat Free Milk, one medium-sized apple, one 1.5-oz. bag of Lay's® Potato Chips, one 2.125-oz. bag of Rold Gold® Twist pretzels, one 1.25-oz. bag of Mini Chips Ahoy!® chocolate-chip cookies, one 4-oz. container of Wegman's® chocolate pudding, one 6-oz. container of Dannon® Lite ‘n’ Fit Vanilla Yogurt, and one 20-oz. container of Pepsi®. In front of each food was a set of flip cards, each card displaying one of the five different costs for that food. The children were told that the cost for the foods would change “just as prices often change in the supermarket.” After purchasing as much as they wanted of the various foods with a specific dollar amount, they were not allowed to save leftover money for the next purchase. To encourage the youth to purchase more than one item on each trial, we also told them that even if they were not hungry for the food at that moment, they could “save it for later.” They were provided practice to ensure that they understood the instructions.
Range of Costs for the Foods in Experiment 2
At the start of each trial, the child was given a plastic bag containing $1, $3, or $5 in imitation coins, depending on the income condition. The order of price and income manipulations was balanced across subjects. Once all 10 trials for an income level were completed, the child was given a short break, and then the same procedures were followed for the remaining two income levels. After completing all 30 trials, the child was allowed to take home his or her two favorite food items. Six of the 20 children were retested after 4 months to establish the repeatability of the findings.
Analytic Plan
The analytic plan was similar to that of Experiment 1. In the regression models, income and the interaction of income with price of healthy and unhealthy alternatives were introduced into the models to test whether income influenced same- or cross-price elasticity. To test reliability over sessions, we introduced session into the regression models for the youth who were retested.
Results
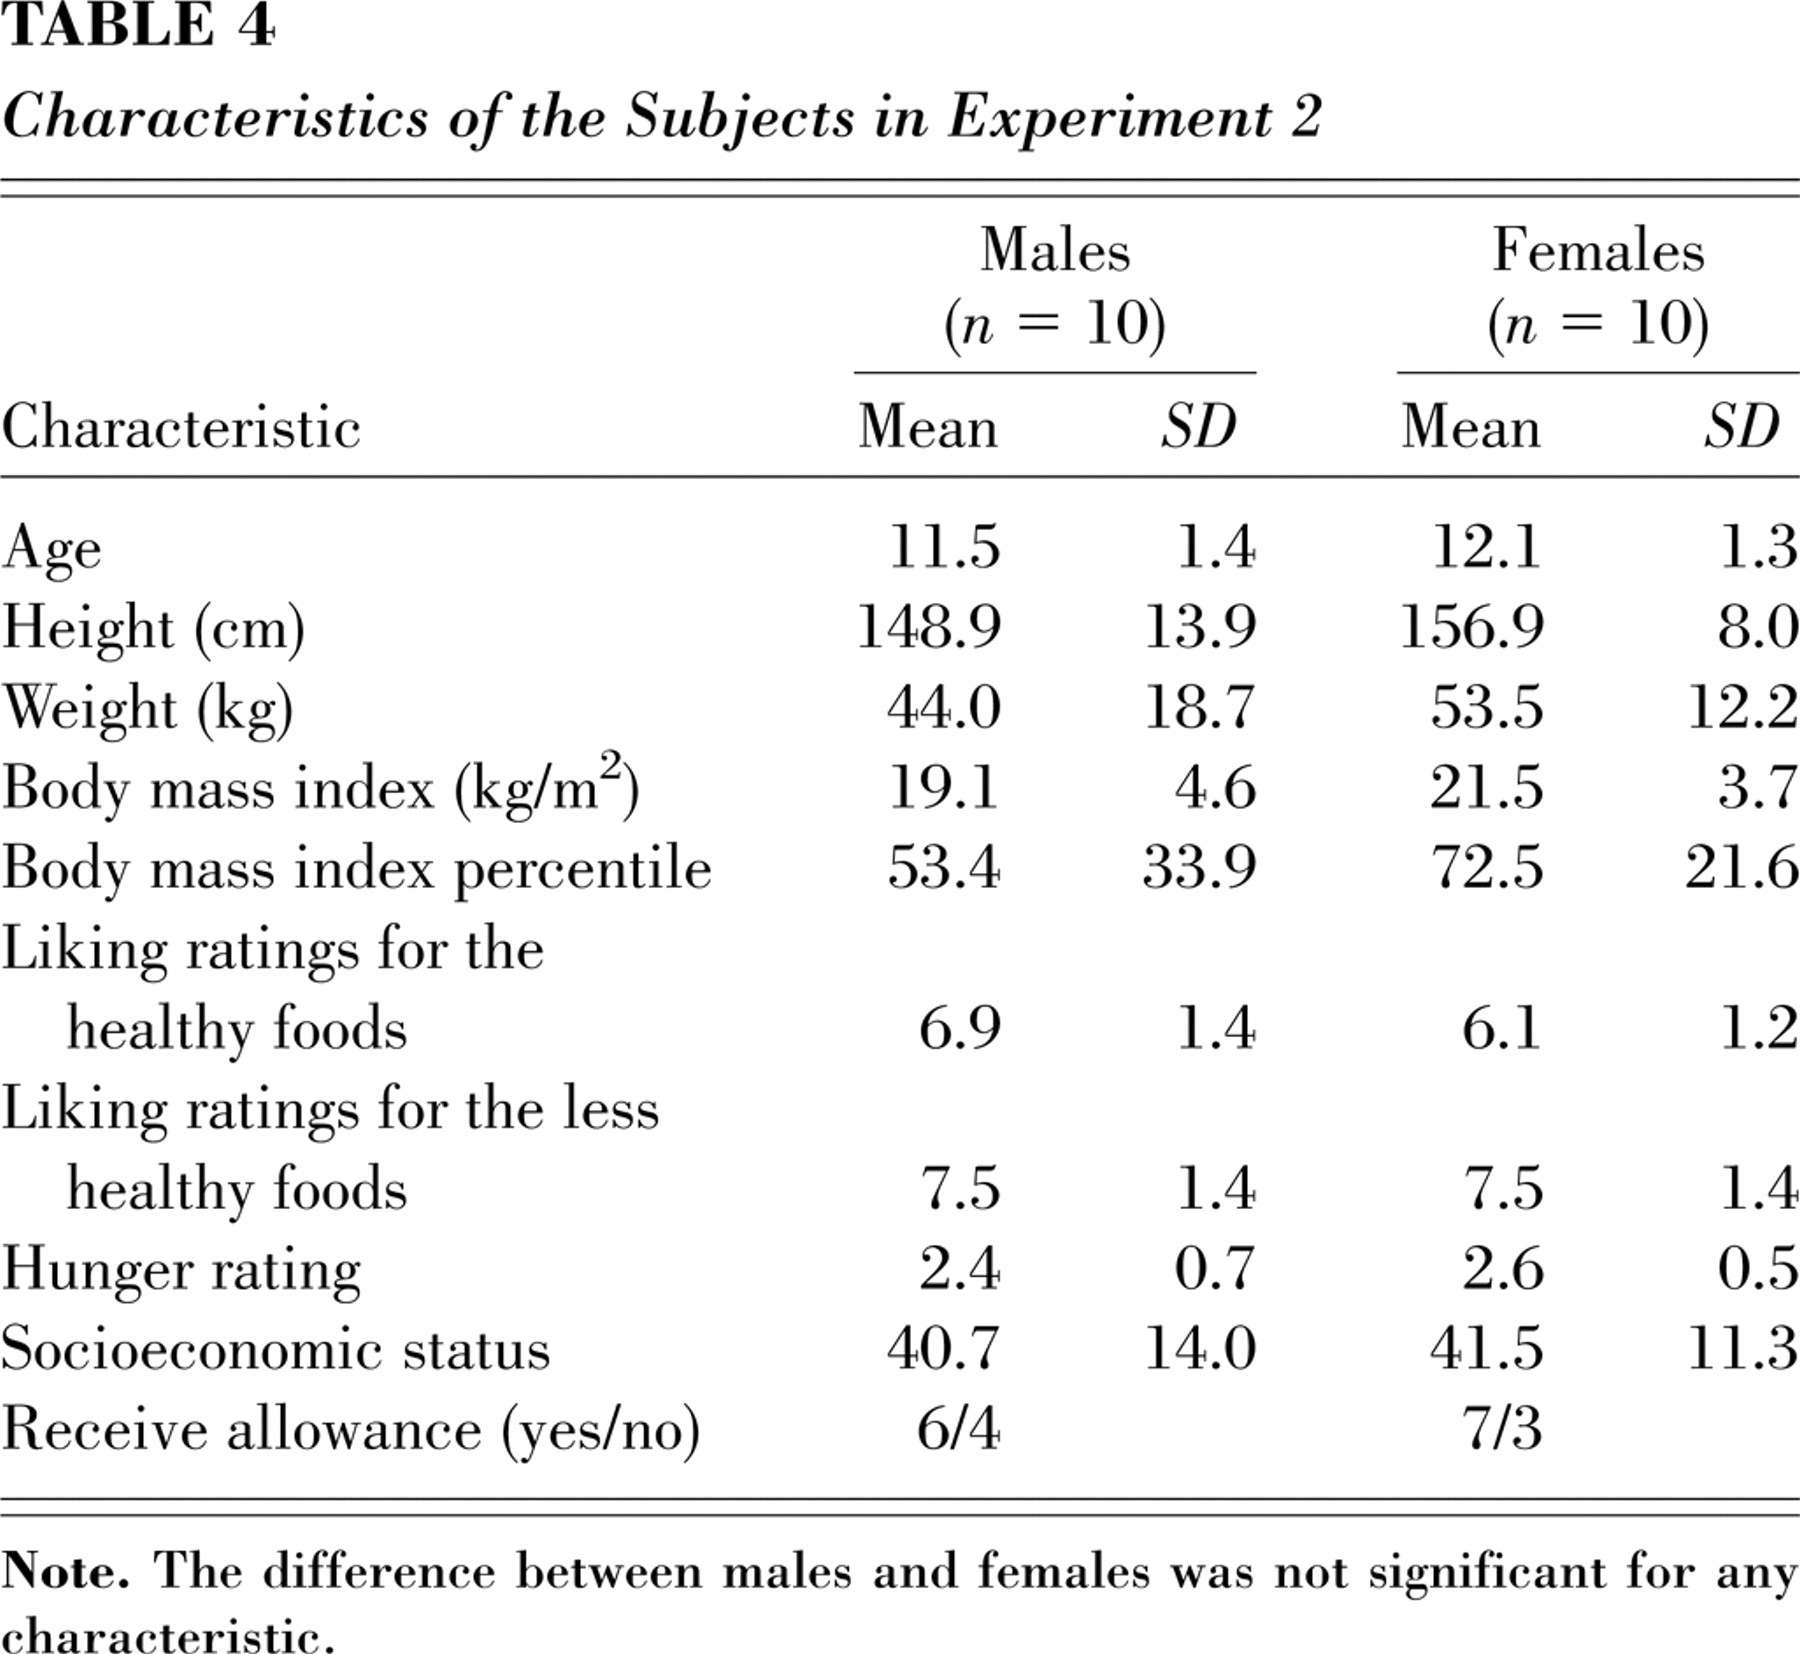
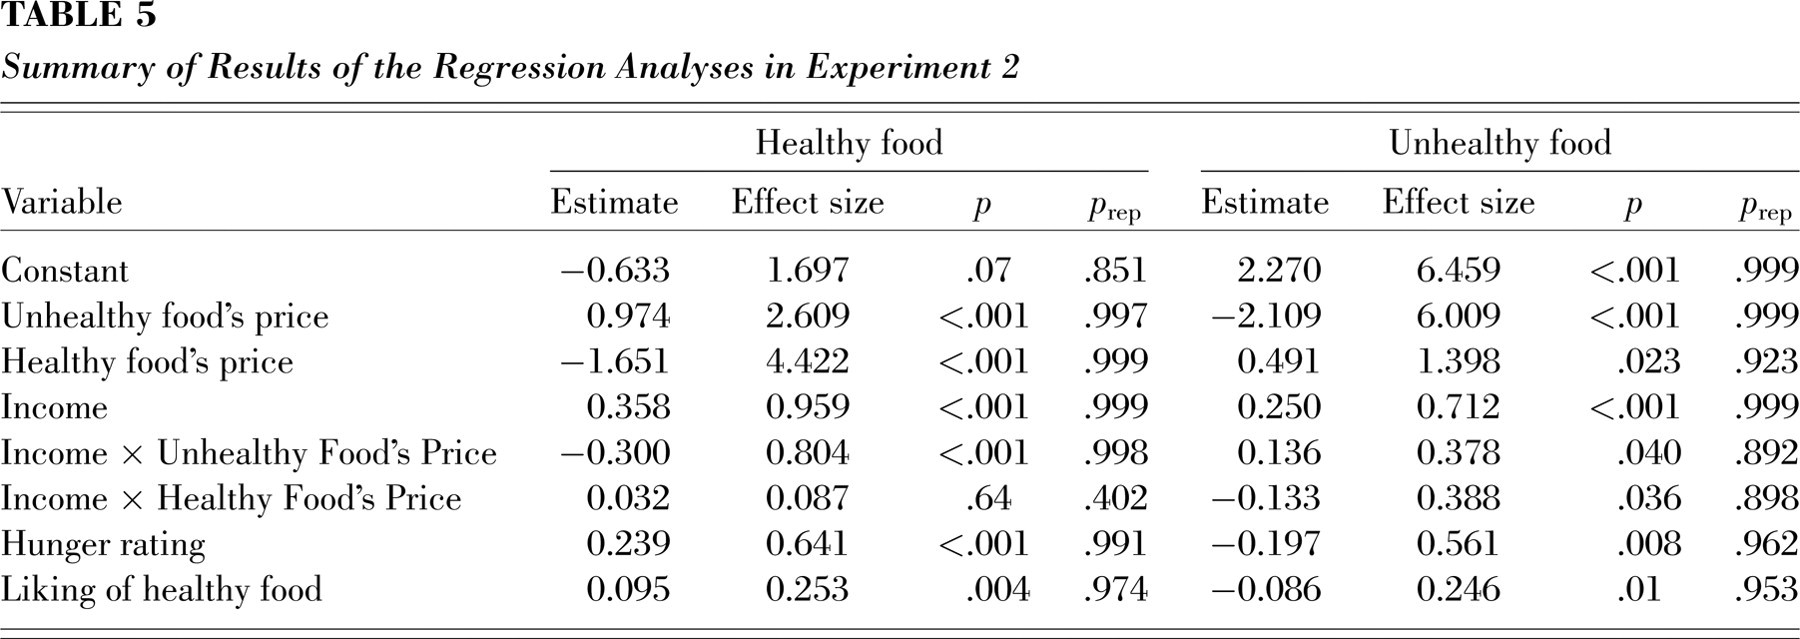
The characteristics of the subjects are summarized in Table 4. A summary of the regression analyses is presented in Table 5. Estimates for same-price elasticity (−1.651, p rep= .999, effect size = 4.42, p < .001) and cross-price elasticity (0.974, p rep= .997, effect size = 2.61, p < .001) were significant for purchases of healthy foods. Income interacted with the price of unhealthy foods to influence purchase of healthy foods (estimate =−0.300, p rep= .998, effect size = 0.80, p < .001). Similarly, same-price elasticity (estimate =−2.109, p rep= .999, effect size = 6.01, p < .001) and cross-price elasticity (estimate = 0.491, p rep= .923, effect size = 1.398, p= .023) were observed for purchases of unhealthy foods. Income interacted with the price of healthy foods (estimate =−0.133, p rep= .898, effect size = 0.39, p= .036) and the price of unhealthy foods (estimate = 0.136, p rep= .892, effect size = 0.38, p= .040) to influence purchase of unhealthy foods.
Characteristics of the Subjects in Experiment 2
Summary of Results of the Regression Analyses in Experiment 2
As shown in Figure 1, the influence of price of one type of food on purchases of the alternative type differed across the three levels of income. When the children's income was $1.00, they substituted purchases of the alternative type of food when price of the other type of food increased. When income was $3.00, there was no change in purchase of the alternative food as a function of price of the other type of food. When children's income was $5.00, as in Experiment 1, children purchased fewer of the substitute foods as the price of the other type of food went up, as they had more money to purchase the food that was increasing in price. Session did not interact with income and food prices for the children who were retested, suggesting that the results were repeatable.
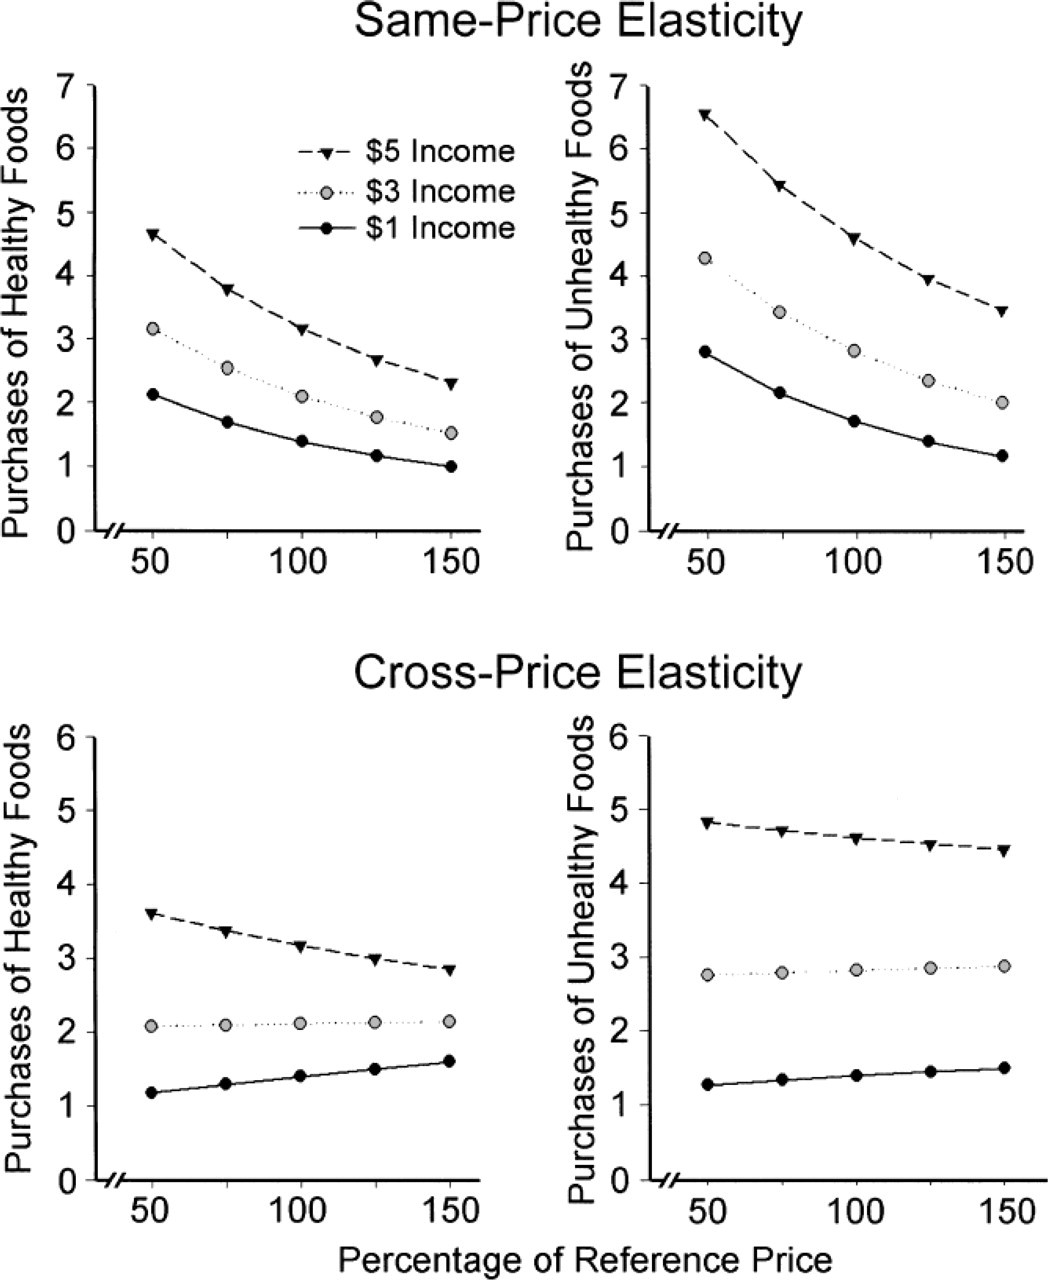
Children's purchases (number of portions per trial) of healthy (left) and unhealthy (right) foods as a function of income and prices of the two types of foods in Experiment 2. The results shown here are based on random regression models controlling for hunger and liking of healthy foods that could be purchased in the experiment. Same-price elasticity is shown in the top graphs, and cross-price elasticity is shown in the bottom graphs. The data points are derived from the random regression models. Elasticity was calculated based on the logs for average prices and log purchases, and prices and purchases were converted to nonlog values for presentation here.
GENERAL DISCUSSION
Experiments 1 and 2 show that purchases of a commodity are directly related to price of that commodity. As prices of foods increase, purchases of those foods decrease. This relationship between price and demand provides support for the idea that increasing the cost of less healthy food alternatives will reduce their purchase and consumption, just as decreasing the cost of healthier foods will increase the purchase and consumption of these foods.
Experiment 2 shows that substitution of an alternative commodity, or cross-price elasticity, depends on the amount of money available to spend. As the amount of available money decreased from $5.00 to $1.00, the degree of substitution increased. When the children had $1.00 to spend, they substituted purchases of the alternative commodity when prices of the other type of commodity increased. When the children had $3.00 to spend, they did not change purchases of the alternative when price of the other type of commodity increased, and when the children had $5.00 to spend, they decreased purchases of the alternative commodity when price of the other type of commodity increased. Children's purchasing patterns when they had $5.00 to spend were similar in the two experiments: Purchases of the alternative type of food did not increase but rather decreased when price of one type of food increased. These data suggest that the more money children have available, the less likely they are to substitute, and the more they will spend extra money on a preferred commodity that is increasing in price. These results are consistent with laboratory results showing that income needed to be reduced below baseline values before participants substituted puffs of a less-preferred cigarette for puffs of a preferred cigarette (DeGrandpre et al., 1993).
Observational research also has shown that when families are provided food stamps, and thus have an increase in funds available for food, they do not purchase healthier alternatives, but rather purchase more of the less healthy foods that they usually eat (Wilde, McNamara, & Ranney, 1999). This occurs even though low-income families report that the high price of healthier alternatives is one reason why they purchase less healthy alternatives (Drewnowski & Specter, 2004; Glanz & Yaroch, 2004), and the cost of fruits and vegetables may be perceived as a barrier to healthier eating (Cade, Upmeier, Calvert, & Greenwood, 1999; Glanz, Basil, Maibach, Goldberg, & Snyder, 1998), especially by families with a low socioeconomic status (Blisard, Stewart, & Jolliffe, 2004).
Laboratory research on behavioral economics can be used to develop methods to modify eating behaviors that lead to overweight and obesity. Children (Smith & Epstein, 1991) and adults (Goldfield & Epstein, 2002) will choose healthier food alternatives when access to higher preference, less healthy foods is reduced. Studies conducted in the field have shown that price changes influence purchases of healthier foods available in vending machines (French et al., 2001; French, Story, Fulkerson, & Gerlach, 2003), cafeterias (French et al., 1997; Jeffery et al., 1994), and restaurants (Horgen & Brownell, 2002). Government subsidies for the sale of fruits and vegetables in high school cafeterias could reduce the cost of these healthy alternatives and could encourage youth to select a more healthful diet. Research suggests that prices can be changed without affecting revenue (French et al., 2001), which is critical if businesses are to modify food prices to cause a shift in food purchases. The strong same-price elasticity relationship between purchases and prices across the full range of prices suggests that any increase in price of unhealthy foods may result in a reduction in purchases of unhealthy foods, and reductions in price of healthy foods will result in increased purchases of these healthier alternatives. Research is needed to understand the minimal price changes that can produce significant changes in purchase and consumption.
The experiments we report here focused on foods. Laboratory research has also shown that physical activity can substitute for sedentary behaviors when the behavioral cost of being sedentary increases (Epstein, Smith, Vara, & Rodefer, 1991). This result has been replicated in the field (Epstein, Roemmich, Paluch, & Raynor, 2005b). In unpublished pilot research, we have found same-price elasticity for purchases of sedentary time and for purchases of physical activities when the prices of these commodities were changed (Epstein, Handley, Dearing, Roemmich, & Spring, 2005). There is also evidence of foods and activities influencing each other. When time spent engaging in sedentary behaviors is decreased, food consumption decreases in a complementary fashion (Epstein, Roemmich, Paluch, & Raynor, 2005a). It would be interesting to study the integration of food and activity choices to more exactly define the relationships among choice of these commodities.
Behavioral economics provides an approach to understanding factors that influence choice of healthy and unhealthy foods and activities. Research has varied both the behavioral cost of commodities (i.e., how hard someone must work to gain access to them) and the price of commodities. Similar results have been shown in laboratory and controlled field studies, and these results suggest that food-price policies could be implemented to enhance health. Given that income can affect choices to substitute healthy for less healthy foods, applied studies that manipulate food prices should take consumer income into consideration. By studying food choice using a behavioral choice framework, policymakers may take advantage of the influence of price on choices. It is possible that price manipulations that favor the purchase of healthy foods could slow or stop the growth of childhood overweight and obesity.
Footnotes
Acknowledgements
This work was supported by National Institute of Child Health and Human Development Grant HD 39778 awarded to Leonard H. Epstein and National Heart, Lung and Blood Institute Grant HL075451 awarded to Bonnie Spring.