
Abstract
Serious consideration is being given to the impact of private behavior and public policies on people's subjective well-being (SWB). A new approach to measuring well-being, the day reconstruction method (DRM), weights the affective component of daily activities by their duration in order to construct temporal aggregates. However, the DRM neglects the potentially important role of thoughts. By adapting this method to include thoughts as well as feelings, we provide perhaps the most comprehensive measure of SWB to date. We show that some activities relatively low in pleasure (e.g., work and time with children) are nonetheless thought of as rewarding and therefore contribute to overall SWB. Such information may be important to policymakers wishing to promote behaviors that are conducive to a broader conception of SWB.
In general terms, there are three approaches to assessing how well people's lives are going. The first focuses on a range of objective indicators (e.g., freedoms and liberties, health and education level; Nussbaum & Sen, 1993). The second concerns the degree to which people are able to satisfy their desires, as (albeit somewhat badly) indexed by income (Griffin, 1986; Harsanyi, 1982). The third focuses on subjective well-being (SWB) and is generally defined as how people think and feel about their lives (Diener, Suh, Lucas, & Smith, 1999). There is considerable debate about how to weight these three kinds of measures, but all are important, especially for policy purposes (Diener, Lucas, Schimmack, & Helliwell, 2008; Diener & Seligman, 2004; Dolan & Kahneman, 2008; Dolan & White, 2007). Rather than address this issue here, we focus on the comprehensiveness of measures of SWB.
Much of the research on SWB that has involved large samples has investigated the thinking, or evaluative, component, focusing on judgments of overall life satisfaction (Dolan, Peasgood, & White, 2008). Research concerning the moment-to-moment feelings, or affect, associated with specific activities has largely been confined to smaller samples because of practical considerations (Hektner, Schmidt, & Csikszentmihalyi, 2007). Both approaches have tended to neglect how long people spend in activities associated with these thoughts and feelings, and this is a potentially serious omission because “time is the ultimate finite resource and the question of how well people spend it is a legitimate issue in the study of well-being” (Kahneman, Schkade, Fischler, Krueger, & Krilla, 2008, p. 11).
In response to this concern, Kahneman, Krueger, Schkade, Schwarz, and Stone (2004) developed the day reconstruction method (DRM). This approach brings together measures that examine the feelings associated with specific activities (Hektner et al., 2007) with measures of how people spend their time (e.g., Bianchi, Robinson, & Milkie, 2006; Juster & Stafford, 1985). Specifically, it asks people to recall their previous day and divide it into episodes “like a series of scenes in a film”; for each episode, they record its duration, what they were doing, who they were with, and how they were feeling (using adjectives such as “happy” and “anxious”). In this way, the DRM allows subjective assessments of feelings to be weighted by their duration to derive a “hedonic calculus” for each episode and ultimately a person's affective profile for an entire day. Because information about an entire day can be gathered at one time, responses can be obtained from reasonably large samples.
However, the DRM has one major weakness: its focus on feelings. This has produced a number of puzzling and contentious findings. For instance, the data suggest that people spend considerable amounts of time in activities that provide relatively little SWB, such as commuting and spending time with their children. Richer people spend more time commuting, and Kahneman, Krueger, Schkade, Schwarz, and Stone (2006) suggested that this fact partly explains why income has a small effect on feelings. The relatively low levels of positive feelings reported for spending time with children are claimed to be a more accurate reflection of experience than belief-based generic judgments, such as “I enjoy my kids” (Kahneman et al., 2004).
However, it is possible that driving to work or playing with one's children brings SWB benefits that are not captured by measures of feelings alone. These activities may be absorbing (Csikszentmihalyi, 1990), have purpose (Ryff, 1989; Seligman, 2002), connect one to other people (Ryan & Deci, 2001), and contribute to important personal goals (Cantor & Sanderson, 1999). In other words, commuting and spending time with one's children may be thought of as rewarding and may contribute to one's SWB every bit as much as some of the more pleasurable activities (like sex and watching TV) appear to. It may be entirely rational and reasonable for people to choose activities that generate relatively low levels of moment-to-moment affect if this outcome is compensated for by positive evaluations. The aim of the research we report here, then, was to provide a more complete account of SWB that captures feelings, thoughts, and their duration.
METHOD
Participants
Participants were recruited via a Web-based Internet panel run from a German university. Of the 1,825 people who accessed the study's site for more details, 625 (34%) provided data on at least four episodes and were included in this study. This response rate is normal for this and other panels (Göritz, 2007) and provided a highly heterogeneous sample. The participants included 379 (61%) females and 246 males (39%); ages ranged from 16 to 80 years (M = 36 years, SD = 11.5). Sixty-eight percent were married or cohabiting, 42% had children living at home, and 52% were employed (note that some participants were students or retirees).
Procedure
Participants accessed the study on-line from the link sent to them by the panel's coordinator (Anja Göritz at Friedrich-Alexander University of Erlangen-Nürnberg). The introductory page explained the nature of the study and indicated how long it would take (around 45 min, based on pilot testing). What followed was similar to the original paper version of the DRM. Participants began by completing a “diary” of their previous day, dividing it into a series of personally meaningful episodes (e.g., “met Chris for coffee”). As an aid, this page remained accessible throughout the study as a pop-up window. The third page asked participants to note the times at which they woke up and went to sleep and to indicate the number of episodes they had identified.
Each of the subsequent pages related to a single episode. For each episode, participants were asked to report start and end times, select what they were doing from a list of 24 activities (e.g., eating), indicate who they were with from a list of 12 options (e.g., boss), and report their thoughts and feelings. After these episode reports, participants completed several scales not relevant to this article. Finally, participants were thanked and paid a nominal reward of €2, following the panel's guidelines.
Thoughts and Feelings
As in the original DRM, feelings were measured by asking participants to indicate how much they felt each of the following during each episode: happy, nervous/anxious, sad/depressed, content/relaxed, frustrated, impatient for it to end. The response scale ranged from 0 (not at all) to 6 (very strongly). Six additional items were designed to assess thoughts and evaluations, to provide data on the nonhedonic components of SWB. Focused and engaged were incorporated to capture the importance of flow experiences (Csikszentmihalyi, 1990). Competent/able was included to measure personal efficacy (Ryan & Deci, 2001). Participants responded to these three items as for the feeling items. Measuring other nonhedonic aspects of SWB with simple adjectives proved problematic during pilot testing, so we developed three short statements: “I feel the activities in this episode were worthwhile and meaningful/were useful to other people/helped me achieve important goals” (Cantor & Sanderson, 1999; Ryan & Deci, 2001; Ryff, 1989; Seligman, 2002). Participants were asked to indicate how much they agreed with each of these statements using the same scale from 0 (not at all) to 6 (very strongly). To test our hypothesis that both feelings and thoughts are important for SWB, we also included a measure of overall episode satisfaction: “All things considered, how satisfied are you with this episode?” Responses to this item were on a scale from −3 (very unsatisfied) to +3 (very satisfied).
RESULTS
Preliminary Analysis
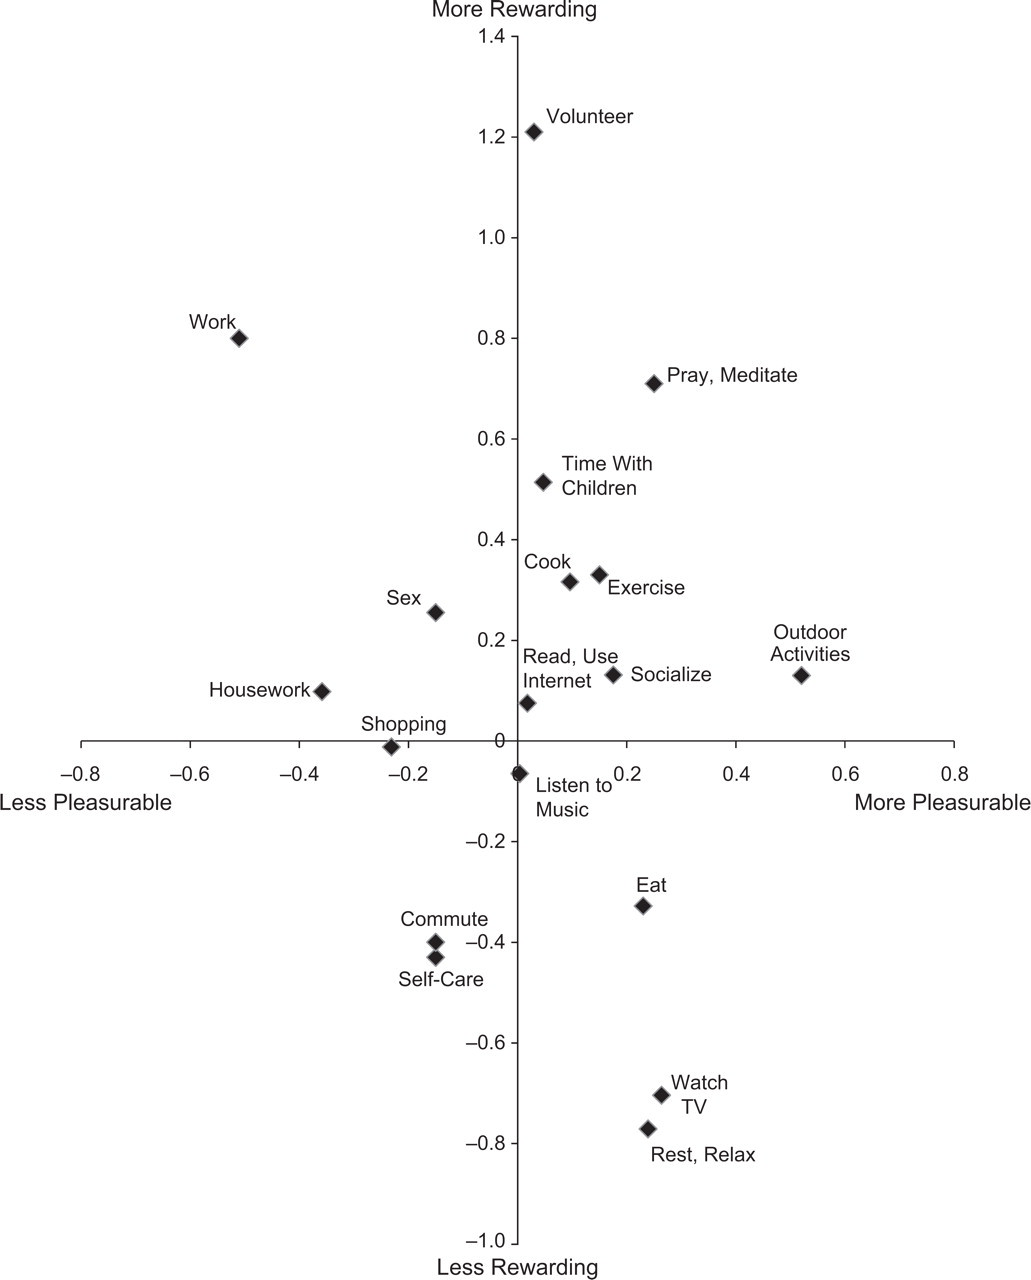
There were 6,449 episodes in total (M = 10.32 per person), but, to aid the interpretation of results, we concentrated on episodes for which only a single activity type was reported (N = 3,057). Some activities almost always co-occurred with another activity (e.g., driving and using public transport frequently co-occurred with commuting), so we did not analyze them separately. This left 18 key activities. Table 1 lists these activities and their frequencies. The most frequent single activity was eating, and the least frequent was praying or meditating.
Self-Reported Pleasure and Reward and Duration of the 18 Kinds of Activity
A principal-component exploratory factor analysis of the 12 feeling and thought items confirmed a two-factor solution. The 6 feeling items loaded onto the first factor (eigenvalue = 3.49, variance explained = 29.07%, all factor loadings > ±.68). Following the affect-balance tradition (Bradburn, 1969), we created a pleasure scale by subtracting the mean of the negative items (anxious, sad, frustrated, and impatient) from the mean of the positive ones (happy, relaxed). The 6 evaluative items loaded onto the second factor (eigenvalue = 2.87, variance explained = 25.76%, all factor loadings > .57). We created a reward scale by calculating the mean of these 6 items (α = .79). Table 1 provides the means and standard deviations for these scales for each activity type. All activities showed positive absolute levels of pleasure and reward.
The mean episode duration was 82.15 min (SD = 91.10). On average, work episodes lasted longest, and self-care activities were the shortest. Because of a large positive skew (2.47), we log-transformed duration (see Table 1) before using it to weight the pleasure and reward scores. Using raw, untransformed duration produced similar results. The final four columns in Table 1 present the means and standard deviations for the log-duration-weighted scores.
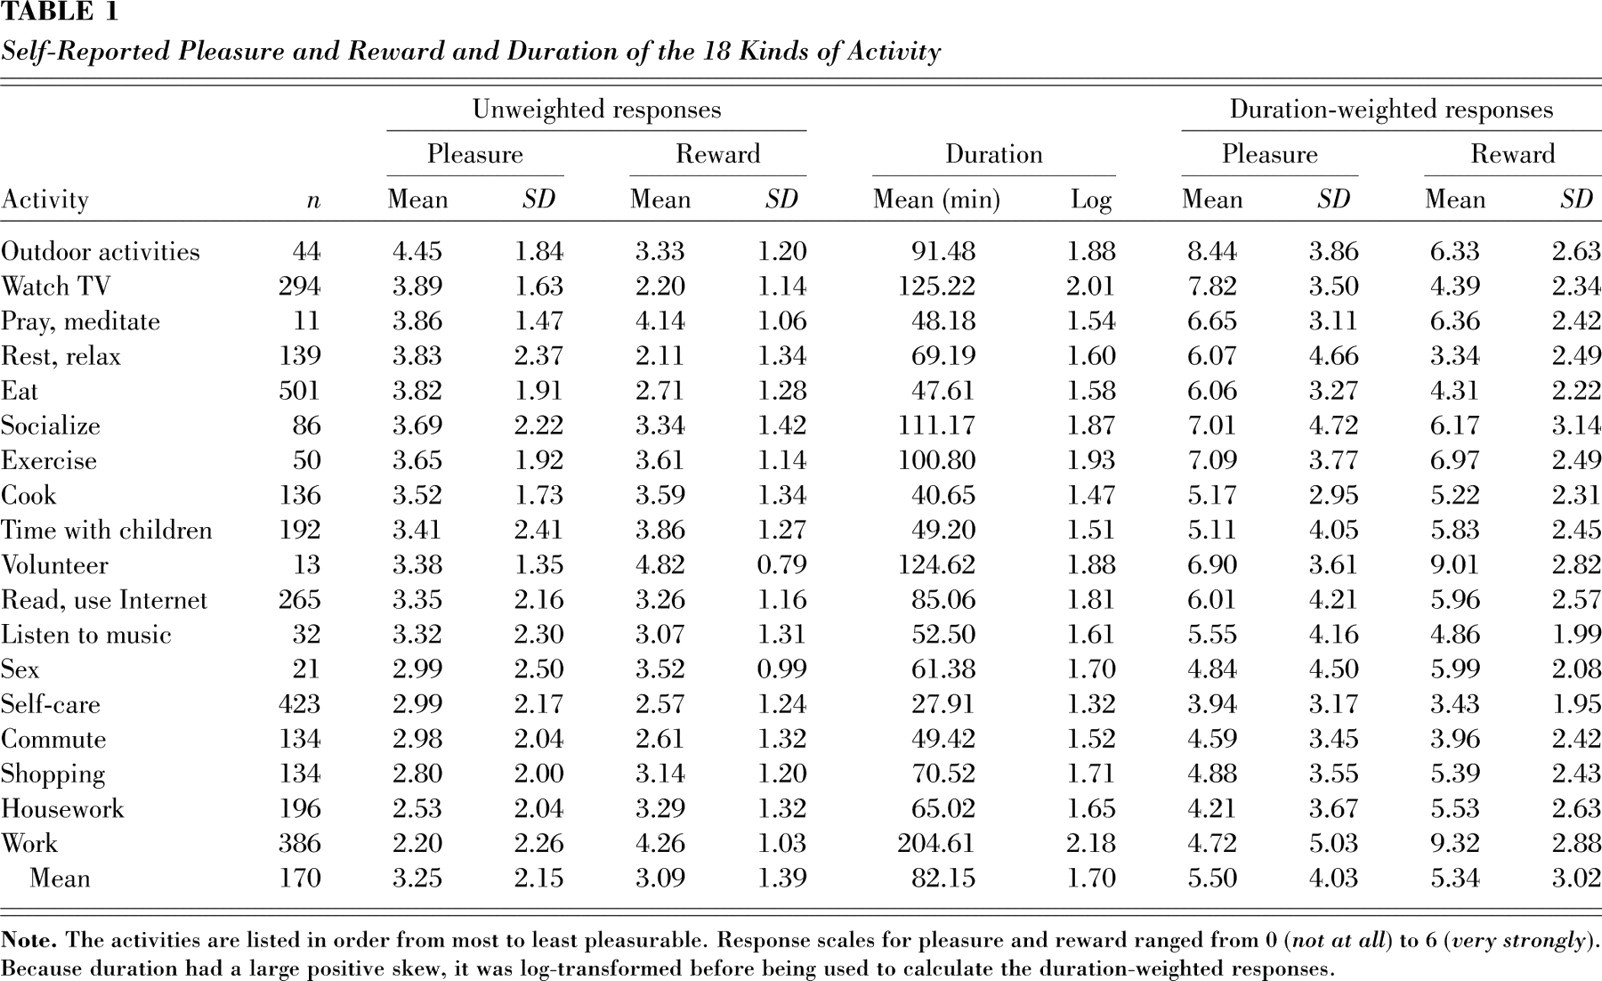
To aid comparison of the relative levels of pleasure and reward across the 18 activities, we provide z-score plots for both the unweighted (Fig. 1) and the duration-weighted (Fig. 2) data. Figure 1 shows that some activities, such as prayer, exercise, and socializing, were both viewed as more pleasurable and more rewarding than average (upper right quadrant). Other activities, such as commuting and self-care, were rated as less pleasurable and less rewarding than average (lower left quadrant). Work and housework were seen as relatively low in pleasure but relatively rewarding (upper left quadrant), whereas watching TV and eating were seen as more pleasurable but less rewarding than average (lower right quadrant). Figure 2 shows that when duration was taken into account, longer episodes, such as working or watching TV, became relatively more pleasurable and rewarding (the plotted points moved diagonally up and right). Shorter episodes, such as cooking and self-care, became less pleasurable and rewarding (the plotted points moved diagonally down and left).
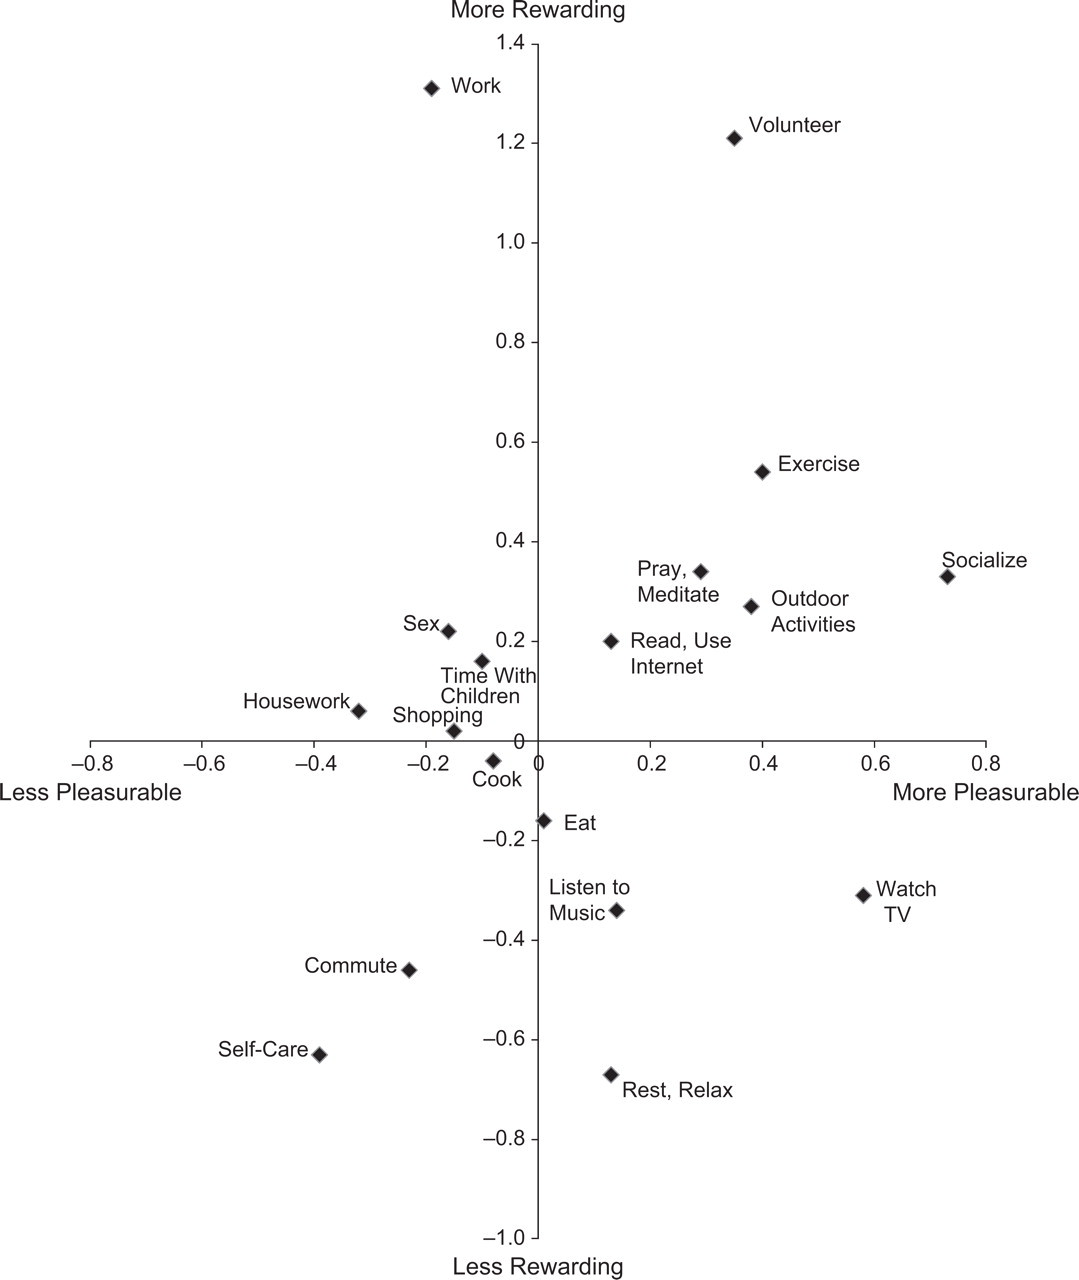
Plot of the 18 activities according to their z scores for duration-weighted pleasure and reward. Episodes that included more than one activity were excluded from this analysis.
Plot of the 18 activities according to their z scores for pleasure and reward. Episodes that included more than one activity were excluded from this analysis.
The relationships among the variables in Table 1 can be examined at the activity level (n = 18) and also at the episode level (n = 3,057). Because of the small number of activities, none of the relationships at the activity level reached statistical significance, so they are indicative only. At this level, more frequent activities, such as self-care, tended to be less pleasurable, r(18) = −.29, and less rewarding, r(18) = −.34. Longer activities, such as work, also tended to be less pleasurable, r(18) = −.14, but were more rewarding, r(18) = .35. This pattern was replicated at the episode level, with longer episodes also being seen as slightly less pleasurable, r(3018) = −.04, p < .05, but more rewarding, r(3056) = .16, p < .001. Overall, less pleasurable activities were seen as more rewarding at the activity level, r(18) = −.22, but this relationship was reversed at the episode level, where more pleasurable episodes were also seen as more rewarding, r(3018) = .16, p < .001. This contrast demonstrates a potential problem of extrapolating from one level of analysis to another and highlights the importance of using multilevel techniques for multilevel data (Snijders & Bosker, 1999).
To test whether the addition of a reward dimension improves the original DRM's account of SWB, we carried out two regression analyses with episode satisfaction as the dependent variable; in the first, the unweighted pleasure and reward scores were the predictor variables, and in the second, the duration-weighted pleasure and reward scores were the predictor variables. Unweighted pleasure alone (β = .63, p < .001) accounted for 39% of the variance in episode satisfaction, and adding unweighted reward accounted for an additional 7%, ΔR 2 = .07, p < .001 (pleasure: β = .58, p < .001; reward: β = .28, p < .001). Duration-weighted pleasure (β = .58, p < .001) accounted for 34% of the variance in episode satisfaction, and adding duration-weighted reward significantly improved the model's explanatory power, ΔR 2 = .01, p < .001 (pleasure: β = .55, p < .001; reward: β = .11, p < .001). The results were weaker for the second regression because there was a negative relationship between episode satisfaction and duration, r(3049) = −.07, p < .001 (see Discussion). These results suggest that a fuller explanation of SWB, as indexed by episode satisfaction, can be achieved by adding the reward dimension.
Statistical Comparison of Activities
To statistically compare activities in terms of their unweighted and duration-weighted pleasure and reward, we analyzed the descriptive data in Table 1 using the hierarchical linear modeling (HLM) program MLwiN (Rasbash, Steele, Browne, & Prosser, 2005). This approach is preferable to standard regression because each person reported several episodes, which resulted in two levels of error variance (person and episode), and HLM is able to separate these (Snijders & Bosker, 1999). Understanding how the total variance was partitioned across the levels provides insight into the degree to which person-level variance (associated with personality and response styles) and episode-level variance (associated with situational factors) influenced the day-to-day reports of SWB (Stone et al., 2006).
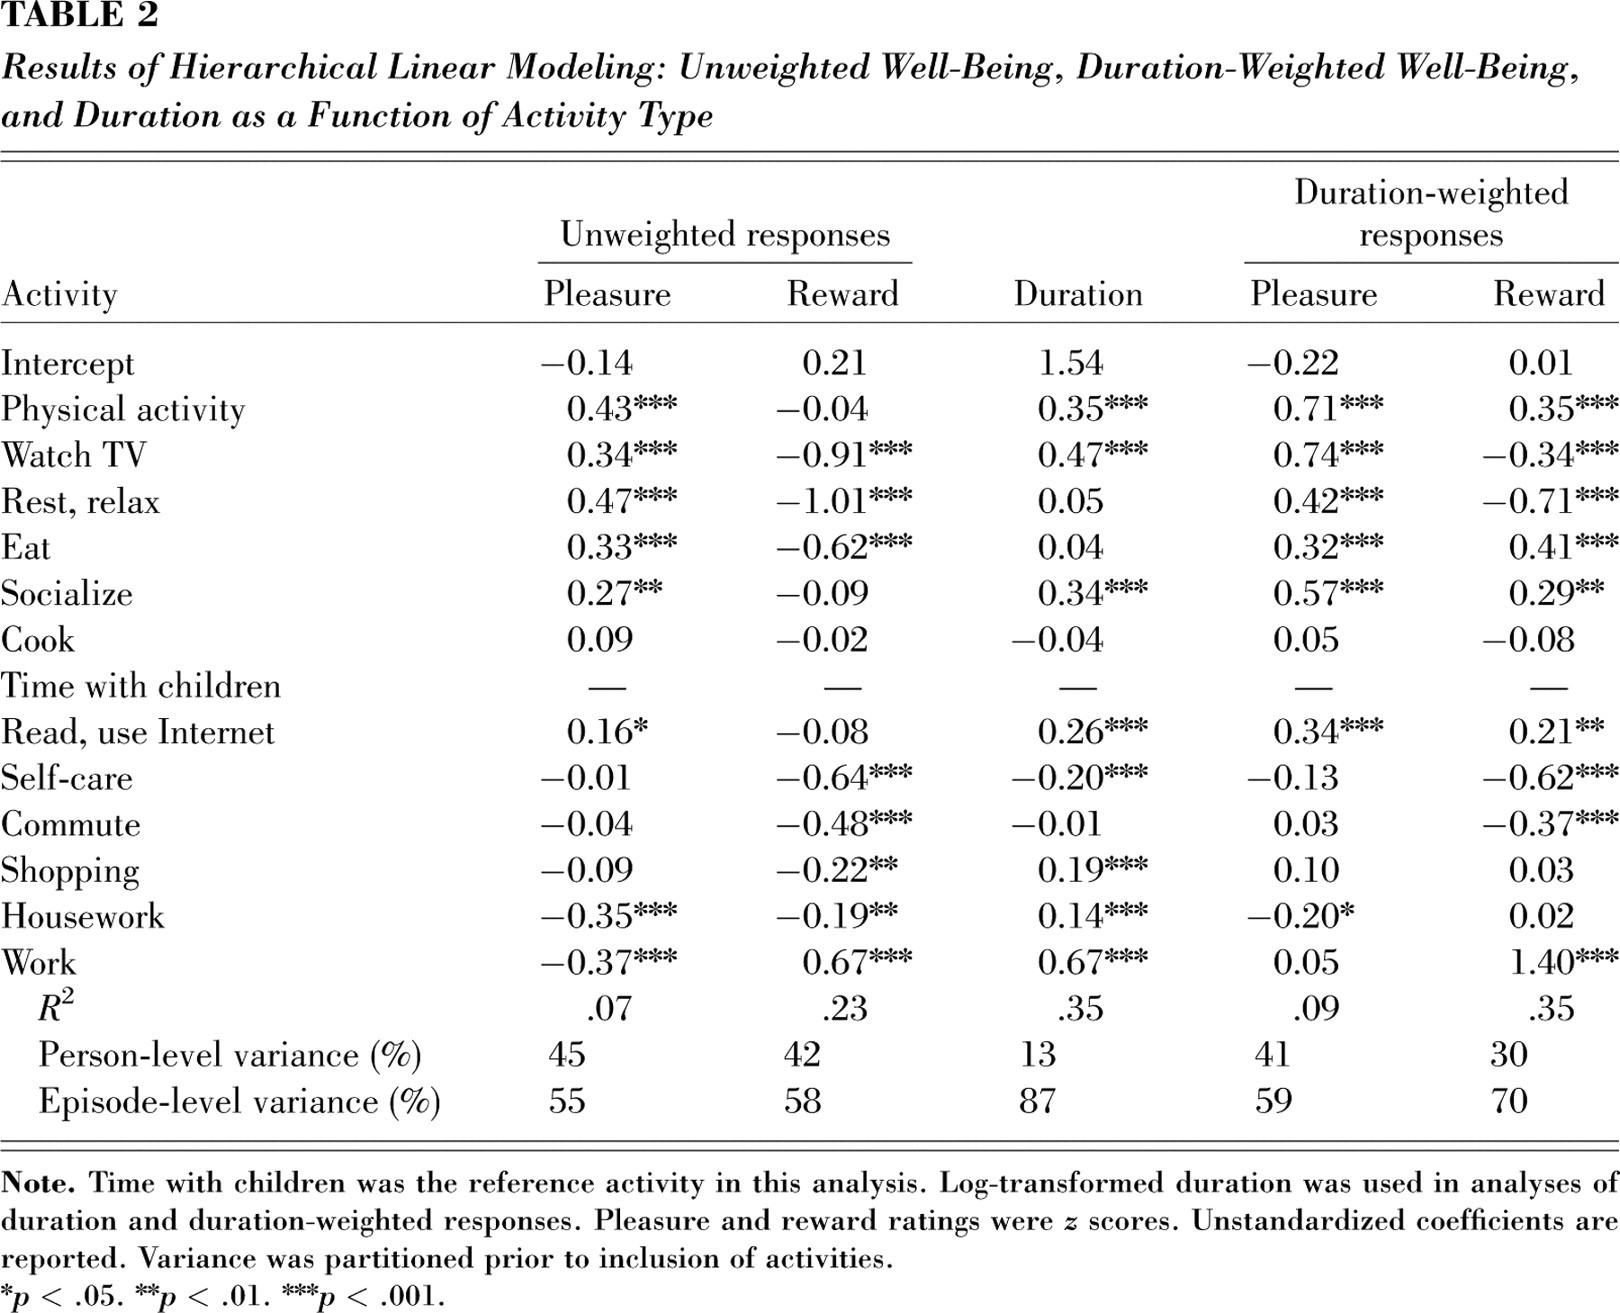
Five HLM analyses were carried out to examine unweighted pleasure, unweighted reward, duration, duration-weighted pleasure, and duration-weighted reward as a function of activity type (Table 2). Because results for low-frequency activities are unreliable in HLM analyses, prayer, sex, volunteering, and listening to music were excluded, and exercise was combined with outdoor activities to form a “physical activity” category. Activities were entered as dummy variables, with time with children chosen as the reference category because its rank for pleasure was at the middle of the distribution. These analyses used z-transformed scores to aid interpretation of the differences across activities. Before activity dummies were added, the total variance in pleasure and reward scores was partitioned across the two levels.
Results of Hierarchical Linear Modeling: Unweighted Well-Being, Duration-Weighted Well-Being, and Duration as a Function of Activity Type
p < .05.
p < .01.
p < .001.
Results for Unweighted Scores
As Table 2 shows, 45% of the variance in pleasure and 42% of the variance in reward were accounted for at the person level (i.e., variance due to within-person characteristics, such as personality or response style). The remaining variance (55% and 58%, respectively) reflected differences at the episode level (e.g., activity type, duration, time of day). The results obtained after activities were included in the model suggest that physical activity, watching TV, resting, eating, socializing, and reading were all significantly more pleasurable than time with children, whereas housework and work were significantly less pleasurable than time with children.
The results for reward, however, showed that only work was seen as significantly more rewarding than spending time with children, whereas watching TV, resting, eating, self-care, commuting, shopping, and housework were all significantly less rewarding. Only cooking was not significantly different from time with children across both measures.
The total amount of variance explained by activity was more than 3 times greater for reward (23%) than for pleasure (7%). The difference in the amount of variance explained by the two dimensions is reflected in Figure 1 by the wider distribution of points on the y-axis than on the x-axis.
Results for Duration
Before activity dummies were added, 87% of the variance in duration was at the episode level, which suggests that there was little general tendency for a given individual to report long or short episodes. Episodes of physical activity, watching TV, socializing, reading, shopping, housework, and work were all significantly longer than episodes of time with children, and only episodes of self-care were significantly shorter (see Table 2). Overall, activity type accounted for a relatively large amount of the variance in episode duration (35%).
Results for Duration-Weighted Scores
Because duration variance was largely at the episode level, the amount of variance at the episode level was higher for duration-weighted pleasure and reward than for the unweighted equivalents. When scores were weighted for duration, work was no longer less pleasurable than time with children, and shopping and housework became no less rewarding than time with children, because of the longer duration of these episodes. Moreover, socializing, physical activity, eating, and reading all became significantly more rewarding than time with children. Once responses were weighted by duration, the total amount of variance explained by activity was higher for both pleasure and reward (ΔR 2 = .02 and .12, respectively).
DISCUSSION
Measures of SWB are playing an increasingly prominent part in policy making (Donovan, Halpern, & Sargeant, 2002) and can be used alongside more established objective and economic indicators of how well life is going for people. Global assessments of life satisfaction are the most widely used measures of SWB, but the responses to such items may reflect those things that are salient at the time of the assessment or that respondents mistakenly think are real sources of their happiness (Kahneman et al., 2006; Schwarz & Strack, 1999). Global assessments also say nothing about how people use their time or how long the reported level of SWB lasts. The DRM, developed by Kahneman et al. (2004, 2006), overcomes these problems by weighting the feelings associated with activities by their duration. However, it underrecognizes an important and potentially policy-relevant element of global assessments: the more evaluative, or thoughts-based, assessment of those activities.
In this study, we have shown that these important thoughts-based components of experiences can be captured just as easily as the feelings-based ones. Our results suggest that some of the implications that may follow from the standard DRM should be treated with caution. For example, although time spent at work is not particularly pleasurable, it is relatively rewarding, and this could explain why so many people choose to work longer hours than would be expected if they were concerned only with maximizing pleasure. Our results also suggest that people may use their discretionary time (Bianchi et al., 2006) to satisfy different components of well-being in different ways; for example, they may obtain pleasure from watching TV and reward from volunteering. So, again, perhaps people are not as bad at maximizing SWB as some of the earlier DRM results might have led one to believe.
The addition of thoughts-based components of SWB makes a difference in understanding time spent with children. If one looks only at pleasure, one could come to the same conclusion as Kahneman et al. (2004) that this is relatively “bad time,” but when reward is also considered, time spent with children is relatively “good time.” Perhaps the statement that “I enjoy my kids” is not so wrong after all, if enjoyment is interpreted in a broader sense that includes reward in addition to pleasure.
Using HLM to account for both person- and episode-level variance provides further insight into the determinants of SWB. Lyubomirsky, Sheldon, and Schkade (2005), for instance, argued that because “genetics account for approximately 50% of the population variation … , and circumstances account for approximately 10% … this leaves as much as 40% of the variance for intentional activity” (p. 116). Our results suggest that episode-level characteristics over which people might have a considerable amount of control (e.g., activity type) explain 55 to 58% of the variance of the unweighted measures of pleasure and reward. This seems encouraging for researchers interested in sustainable improvements in SWB, because it suggests that activity-focused interventions may have greater leverage than previously assumed (Lyubomirsky et al., 2005). Clearly, further research is needed to explore the robustness of these findings, and much of the actual variance at each level remains to be explained.
The results from this study, like those presented by Kahneman et al. (2004, 2006), raise some general methodological questions about the DRM. For example, researchers are unable to determine the extent to which people's reports are “true” reflections of their on-line experiences, rather than post hoc reconstructions. The DRM's developers (Kahneman et al., 2004; Schwarz, Kahneman, & Xu, in press; Stone et al., 2006) have argued that patterns of response for certain feelings, such as tiredness, are more consistent with known patterns of on-line experience than with generalized beliefs, and thus that the DRM does appear to be tapping into experiences rather than inferences. However, we recognize that participants may attempt to reduce cognitive dissonance by perceiving unpleasant activities as rewarding in order to justify the time spent doing them. Future research measuring the reward value of activities using experience-sampling methods is required.
Further, it is not currently possible to say anything meaningful about the marginal effects of transferring time spent in one activity to another activity because we do not know the SWB associated with a marginal unit of time in each activity. Knowing these marginal rates may help explain the negative correlation between episode satisfaction and duration. Logically, one might expect longer pleasurable and rewarding episodes to be more satisfying than shorter ones. However, Kahneman has already demonstrated that people tend to neglect duration when making global episode evaluations, basing them instead on the peak and end experiences (see Kahneman, 2000, for a review). If the marginal rates of pleasure and reward diminish over time for a certain activity (e.g., the third hour of watching TV might well be less pleasurable than the first), the end experience will be lower for longer episodes, resulting in lower overall satisfaction ratings for those episodes. This possibility demonstrates the potential value of the DRM's duration-weighted approach: The DRM provides an estimate of the total amount of (self-reported) SWB experienced during an activity, and this estimate is less distorted by limitations of memory than an individual's own summary. Until the issue of marginal rates is resolved, therefore, we remain cautious in making inferences for policy.
Finally, a hedonist might criticize our approach by arguing that, sooner or later, activities that are more rewarding will result in higher pleasure. This view can certainly be disputed (Keyes, Shmotkin, & Ryff, 2002; Ryan & Deci, 2001; Ryff, 1989). However, even if all activities are seen purely in terms of their consumption and investment effects for pleasure, measures of current reward may provide useful proxies for expected future pleasure.
An interesting challenge for policymakers may come when pleasure and reward tell very different stories. This is perhaps one area where policymakers might consider the consequences of SWB for other concepts of well-being (e.g., the extent to which activities high in different components of SWB contribute to the objective and economic indicators that policymakers and society care about).
These issues notwithstanding, some of our results could provide additional support for policymakers seeking to provide incentives for people to spend less time in certain activities (e.g., commuting) that are seen as neither pleasurable nor rewarding. These issues will all be subject to future debate, but we hope we have provided fresh insight and evidence relevant to those debates.
Footnotes
Acknowledgements
The two authors contributed equally to this article. We thank Anja Göritz and Anthony Mee for help with programming, translation, and data collection. We also thank Daniel Kahneman, Robert Metcalfe, Talya Miron-Shatz, Sabine Pahl, Tessa Peasgood, and three anonymous reviewers for their comments on previous versions of this manuscript.