
Abstract
It is well established that animal communication signals have adapted to the evolutionary pressures of their environment. For example, the low-frequency vocalizations of the elephant are tailored to long-range communications, whereas the high-frequency trills of birds are adapted to their more localized acoustic niche. Like the voice, the human face transmits social signals about the internal emotional state of the transmitter. Here, we address two main issues: First, we characterized the spectral composition of the facial features signaling each of the six universal expressions of emotion (happiness, sadness, fear, disgust, anger, and surprise). From these analyses, we then predicted and tested the effectiveness of the transmission of emotion signals over different viewing distances. We reveal a gradient of recognition over viewing distances constraining the relative adaptive usefulness of facial expressions of emotion (distal expressions are good signals over a wide range of viewing distances; proximal expressions are suited to closer-range communication).
Since Eckman and Friesen's seminal research, we know that six universal categories of facial expression (happiness, sadness, fear, disgust, anger, and surprise) are recognized across different cultures (Ekman & Friesen, 1975; Izard, 1971, 1994). Such expressions represent a crucial means of social communication in humans because they transmit mental states. That is, our own facial expressions signal to others our likely intentions and, in turn, their facial expressions indicate their intentions toward us. It is supposed that such universal human behavior has been shaped by the processes of evolution, and so we must consider the costs and benefits of facial expression signaling in the evolutionary past (Schmidt & Cohn, 2001; see also Susskind et al., 2008).
For example, the constraint of predator avoidance might have shaped facial expressions for successful distal recognition (e.g., of a fearful expression), whereas the evolution of language and close communication might have shaped a more proximal form of signaling (e.g., sadness at the distances typical of verbal communication). So, understanding how expression recognition operates over a range of viewing distances typical of social signals transmission is a precondition to understanding the distal or proximal nature of their possible adaptive advantage.
Consider “fear,” for which there has been great interest in the neuroimaging community, in relation to its adaptive value (de Gelder, Morris, & Dolan, 2005; Morris, de Gelder, Weiskrantz, & Dolan, 2001; Vuilleumier, Armony, Driver, & Dolan, 2003; Whalen et al., 2004). It has been proposed that fearful stimuli use a fast, subcortical pathway in the brain (e.g., Vuilleumier et al., 2003; Morris et al., 2001). This pathway comprises magnocellular cells that have faster temporal resolution and are sensitive to the coarse-scale information (i.e., low spatial frequency, LSF) of the visual input (e.g., see Livingstone & Hubel, 1987). Thus, this pathway is an ideal route to process visual signals quickly at a distance. In fact, Vuilleumier et al. (2003) confirmed that the LSF of “fearful” faces (the facial information visible from far away) elicits a stronger response of the amygdala (though there is still considerable debate surrounding this subcortical route; e.g., see Johnson, 2005).
Note that we are not suggesting that signal transmission is the only factor that might have shaped the evolution of facial expressions. For example, Susskind et al. (2008) suggested specific muscle configurations could confer sensory gains to the sender (e.g., by constricting air intake in “disgust” vs. enhancing intake in “fear”). Here, however, we focus on the outstanding issue of the possible shaping of facial emotions for transmission across varying viewing distances typical of distal and proximal social interactions.
Facial expressions, like all visual signals, are analyzed in the brain by a number of spatial-frequency (SF) channels (e.g., see Sowden & Schyns, 2006). Depending on the evolutionary importance of proximal or distal recognition for a given expression, it should be represented across a corresponding range of the SF spectrum. This is necessary because changes in viewing distance modulate the SF content of the stimulus projecting on the observer's retina. As the stimulus moves further away, layers of high SFs of the stimulus are progressively peeled off, ultimately leaving on the retina the information represented in the low SFs of the stimulus (see Fig. 1). Thus, if a given expression should be recognized from a certain range of viewing distances, then the facial information critical to categorize this expression (i.e., the diagnostic features for that expression) should be represented across the corresponding range of the SF spectrum.
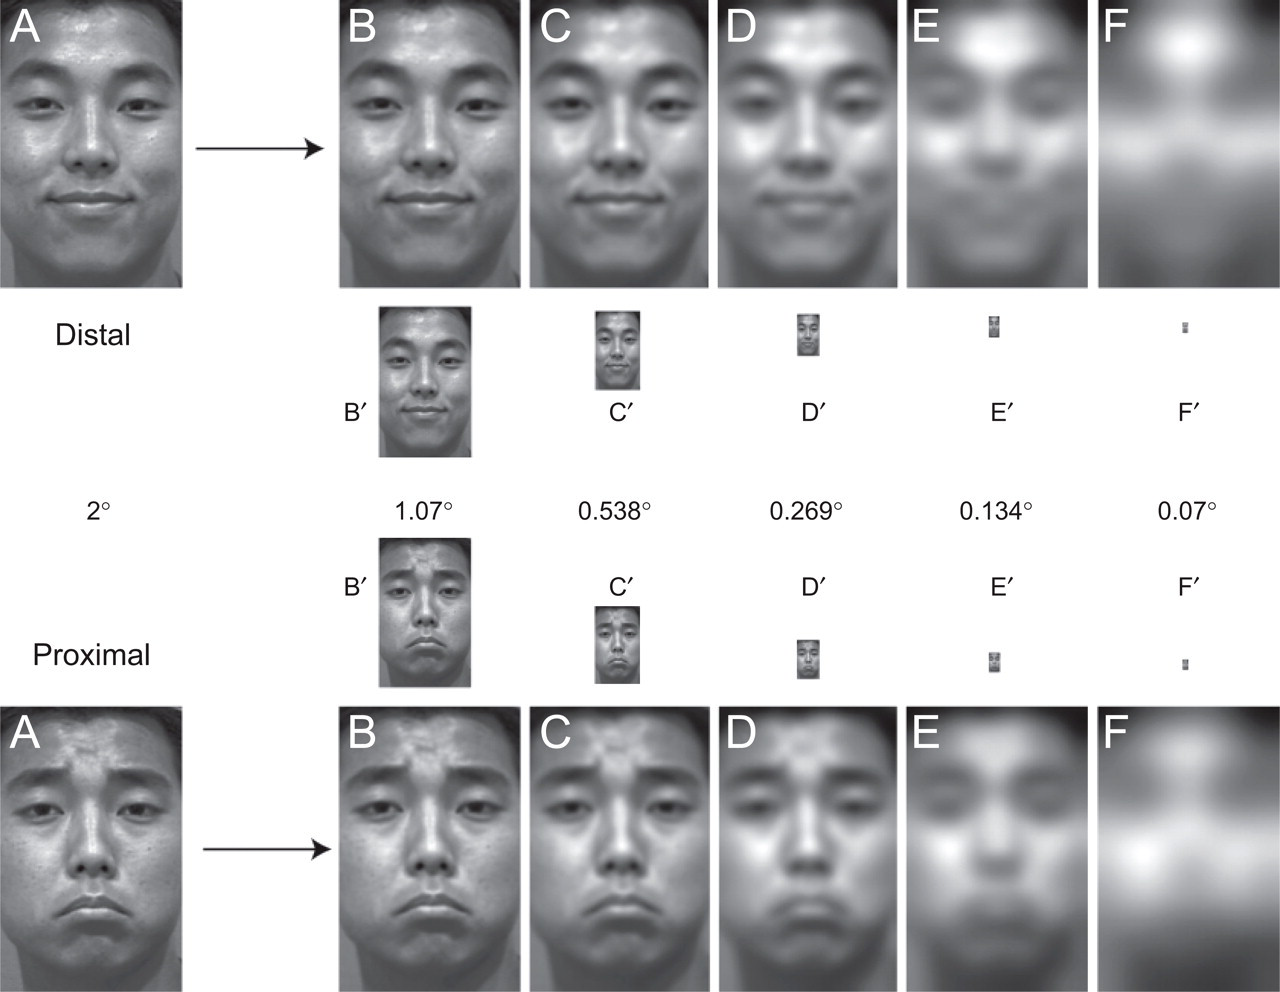
Illustration of the stimulus-generation process for the viewing-distance experiment. Examples of original images are shown on the left (labeled “A”). All filtering operations were performed using the Laplacian Pyramid (see the text). This process is illustrated here for a distal expression (i.e., an expression that is well recognized over a wide range of viewing distances; top two rows) and a proximal expression (i.e., an expression better suited to close-range communication; bottom two rows). We first removed the highest spatial frequencies (SFs) present in each image (those expressed over 2 pixels), generating the images labeled “B.” These images were then down-sampled by a factor of 2 to obtain reduced-size images (“B′”). Note that there was no loss of face SF information, despite the reduction in size. We repeated this process recursively to generate five reduced-size images (“B′”–“F′”). The reduced-size images were used in the viewing-distance experiment to simulate increasing viewing distance. The numbers represent the visual angle (height) of each stimulus in the experiment.
Therefore, our research agenda is, first, to characterize the spectral composition of the information that is diagnostic of each of the six universal expressions of emotion, plus neutral (we call this the diagnostic SF spectrum). We derived these from a new analysis of two 7-alternative forced-choice (7AFC) expression experiments, each performed using the Bubbles paradigm (Schyns, Petro, & Smith, 2007; Smith, Cottrell, Gosselin, & Schyns, 2005; see Gosselin & Schyns, 2001). Second, from the diagnostic spectra, we predicted the recognition of normal pictures of expressions over a range of viewing distances and directly tested such predictions in a new 7AFC expression experiment. We show that the diagnostic spectra for expression recognition covary with the viewing distance from which a given expression can be successfully recognized. Specifically, in contrast to predictions regarding the adaptive nature of “fear,” we show that “happiness” and “surprise” are favored for successful distal recognition. We discuss these results in the context of the pressures of communication (distal and proximal) and sensory acquisition (Susskind et al., 2008) that are proposed to subtend the evolution of facial expressions of emotions.
BUBBLES ANALYSIS
Method
Data Collection
Data were collated from two experiments stemming from our laboratory (Schyns et al., 2007; Smith et al., 2005). Both of these experiments utilized the same stimulus set (10 actors each posing the six basic facial expressions plus neutral, FACS coded; Dailey, Cottrell, & Reilly, 2001; Ekman & Friesen, 1978), the same Bubbles methodology (see Fig. 2), and the same task (7AFC expression categorization). The data of Smith et al. consisted of 14 observers performing 1,200 trials per expression, whereas the data of Schyns et al. consisted of 4 observers performing 3,000 trials per expression.
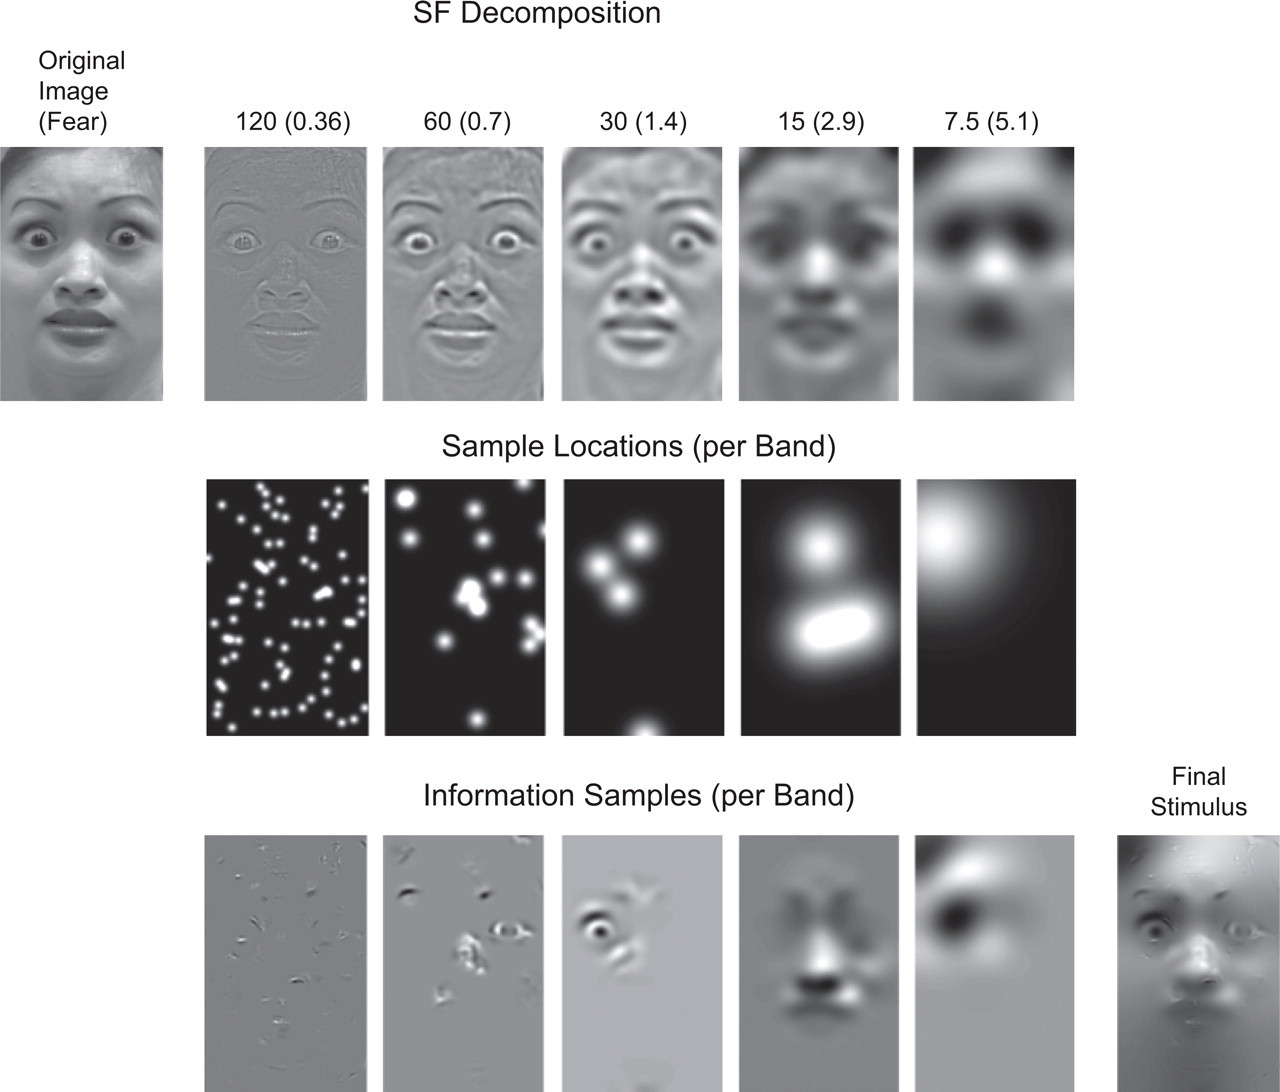
Example of stimulus generation for the Bubbles experiment. First (top row), an original face was decomposed into five nonoverlapping spatial-frequency (SF) bands of 1 octave each (starting at 120–60 cycles per face). Each band was then independently sampled with randomly positioned Gaussian apertures (with standard deviation starting at 0.36 cycles/degree of visual angle for the higher SFs), each revealing 6 cycles per face irrespective of band. The second row illustrates these randomly positioned apertures for each SF band, and the third row shows the face information samples that result from multiplying the band-specific face information (top row) with the band-specific sample locations (second row). Addition of the randomly sampled face information from each SF band produced one stimulus image (final stimulus). Further details are available in Schyns, Petro, and Smith (2007) and Smith, Cottrell, Gosselin, and Schyns (2005). The numbers at the top indicate the highest cycle represented in each band and (in parentheses) the standard deviation of the Gaussian aperture at each band.
Analysis
On each trial of both experiments, the observer was exposed to a random subset of SF information from the chosen face image (see Fig. 2). The task was to categorize the sparse stimulus in terms of expression. Thus, on each trial, the randomly located Gaussian apertures define a three-dimensional mask (two of image space, the third of SF) that reveals a sparsely sampled face. To reveal the facial information diagnostic of each expression, we simply summed together, independently for each SF band, all the samples leading to correct responses (across all observers) for a given expression and divided by the sum of all the samples shown for that expression. These probabilities were then transformed into z scores to locate statistically significant pixels (Chauvin, Worsley, Schyns, Arguin, & Gosselin, 2005). We then filtered a representative face stimulus with the diagnostic information in each SF band to produce the effective stimulus for each expression (see Fig. 3, column 1).
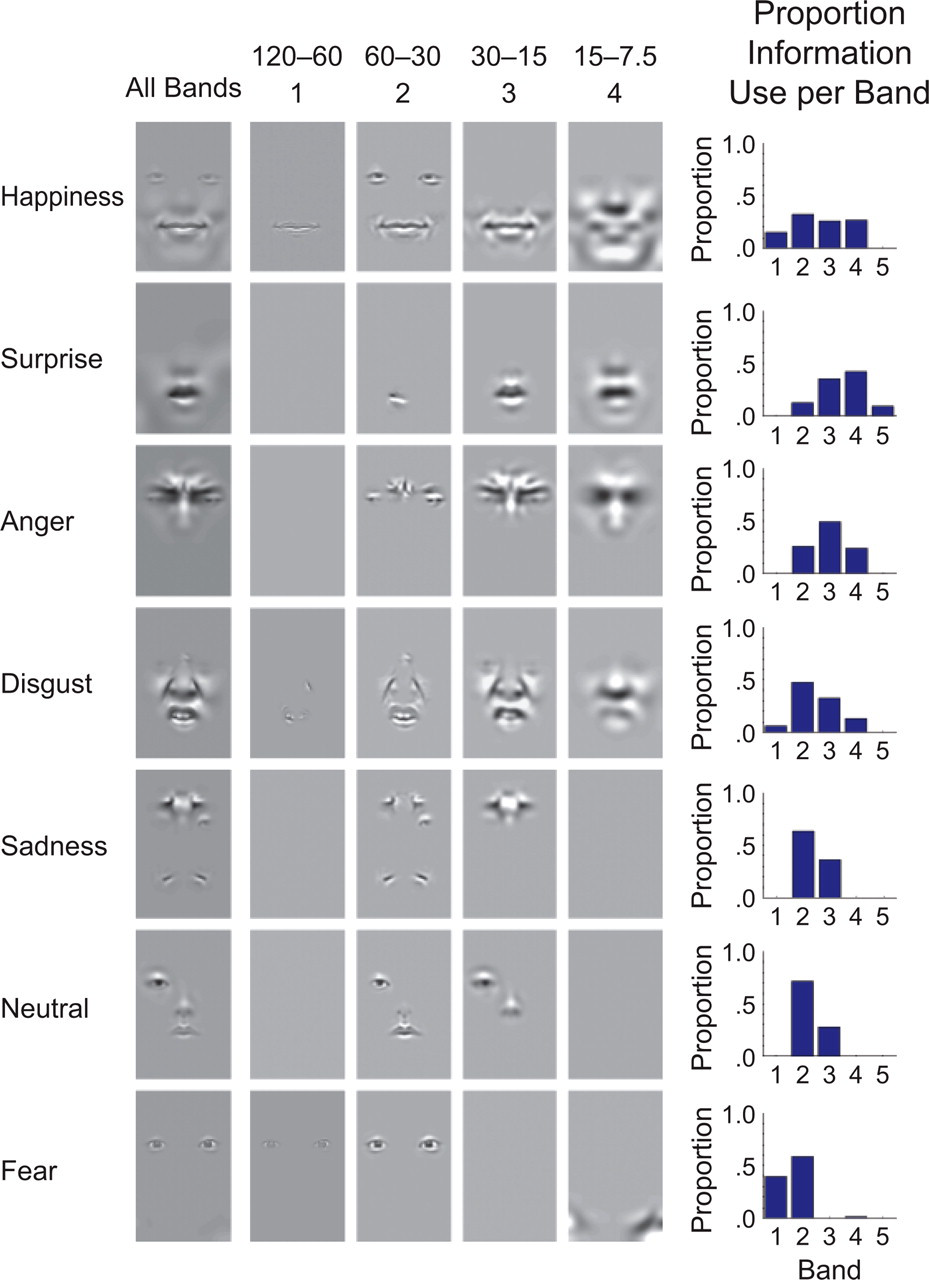
Results of the Bubbles analysis. The significant face information used to classify each expression is shown in a separate row. The first column shows the diagnostic spatial-frequency (SF) information collapsed across all the SF bands sampled during the experiment. The next four columns show the diagnostic information from each band separately (we do not show diagnostic images for the fifth SF band because only one expression had diagnostic information in this band). The bar graphs show the diagnostic SF spectrum for each expression (see the main text). The numbers at the top of the figure indicate the range of cycles per face present in each band. The numbers below these ranges indicate the (arbitrary) number of the band.
Diagnostic SF Spectrum
To measure the quantity of available information used at each SF band, for a given expression, we summed the number of significant pixels present at each SF band for that expression and divided that sum by the standard deviation of the Gaussian at the relevant band. To compare the relative use of SF band across expressions, we expressed the quantity of information in terms of a proportion of information use per SF band and plotted these as histograms representing the diagnostic SF spectrum.
Results and Discussion
Figure 3 presents the results of the Bubbles analysis: The figure shows the significant face information used for each expression (rows) and SF band (columns 2–5). The final column presents a bar graph showing the diagnostic SF spectrum for each expression. We classified expressions as distal if the SF band usage was above the midpoint of the scale (2.5) and as proximal if the average SF band usage was below the midpoint of the scale. Using these criteria, we designated happiness, surprise, disgust, and anger as distal and fear, neutral, and sadness as proximal.
What consequences does such a pattern of results have for successful recognition of given expressions at varying viewing distances? Distal expressions should be better recognized across a wider range of viewing distances than proximal expressions because, as the stimulus shrinks on the retina with greater viewing distance, the low-frequency representation of the diagnostic features (e.g., see the bottom portion of the happiness face, band 4, Fig. 3) becomes the only remaining stimulus information to resolve the task. We directly tested these predictions in a new 7AFC expression experiment. We presented whole faces of different physical sizes and asked participants to categorize the expression. In addition, we also manipulated the amount of time for which each face was presented, though we do not focus on that here.
EXPERIMENT
Method
Participants
Six Glasgow University students (2 males, 4 females) took part in the present experiment in return for a small payment. All had normal or corrected-to-normal vision.
Apparatus
The images were displayed on a ProNitron 17/550 monitor, driven by an Apple Macintosh G4, by means of the MATLAB Psychophysics Toolbox (Brainard, 1997; Pelli, 1997).
Stimuli, Design, and Procedure
This experiment utilized the same stimulus set as the Bubbles experiments (though we used the closed-mouth rather than the open-mouth version of happiness). We simulated increasing physical distance between a signaler and a receiver by shrinking image size with the Laplacian Pyramid (Burt & Adelson, 1983), a technique that recursively removes the highest SFs of an image while down-sampling the residual image by a corresponding amount (see Fig. 1). We used the Laplacian Pyramid because it removes one octave of SF between images of different sizes, which corresponds roughly to a similar decrement in spectral energy. To minimize any loss of information associated with image shrinking compared to actual changes in viewing distance, we placed the monitor at a viewing distance of 3.3 m (see Loftus & Harley, 2004), ensuring a pixel density of 200 pixels per degree of visual angle. From a fixed viewing distance of 3.3 m and initial image size of 380 × 240 pixels, the simulated viewing distances ranged from 3.3 to 105.6 m (3.3, 6.6, 13.2, 26.4, 52.8, and 105.6 m).
We also manipulated presentation time on a logarithmic scale ranging from 16 to 512 ms (16, 32, 64, 128, 256, and 512 ms). The six different viewing distances and six different presentation times were combined in a fully factorial design with a total of 2,520 trials (70 images × 6 distances × 6 presentation times). Each trial began with a fixation cross (500 ms), followed by presentation of a randomly selected image at a given viewing distance for a specified presentation time, followed by a mask (for 150 ms) consisting of phase noise with the same amplitude spectra as that of an average face. The next trial began after the participant responded. Participants were instructed to judge the expression of the face displayed to the best of their ability (training before the main experiment ensured participants could successfully classify the faces by expression).
Results and Discussion
Figure 4 presents d′ sensitivity measures of performance as a function of expression and viewing distance averaged across presentation time and participants.
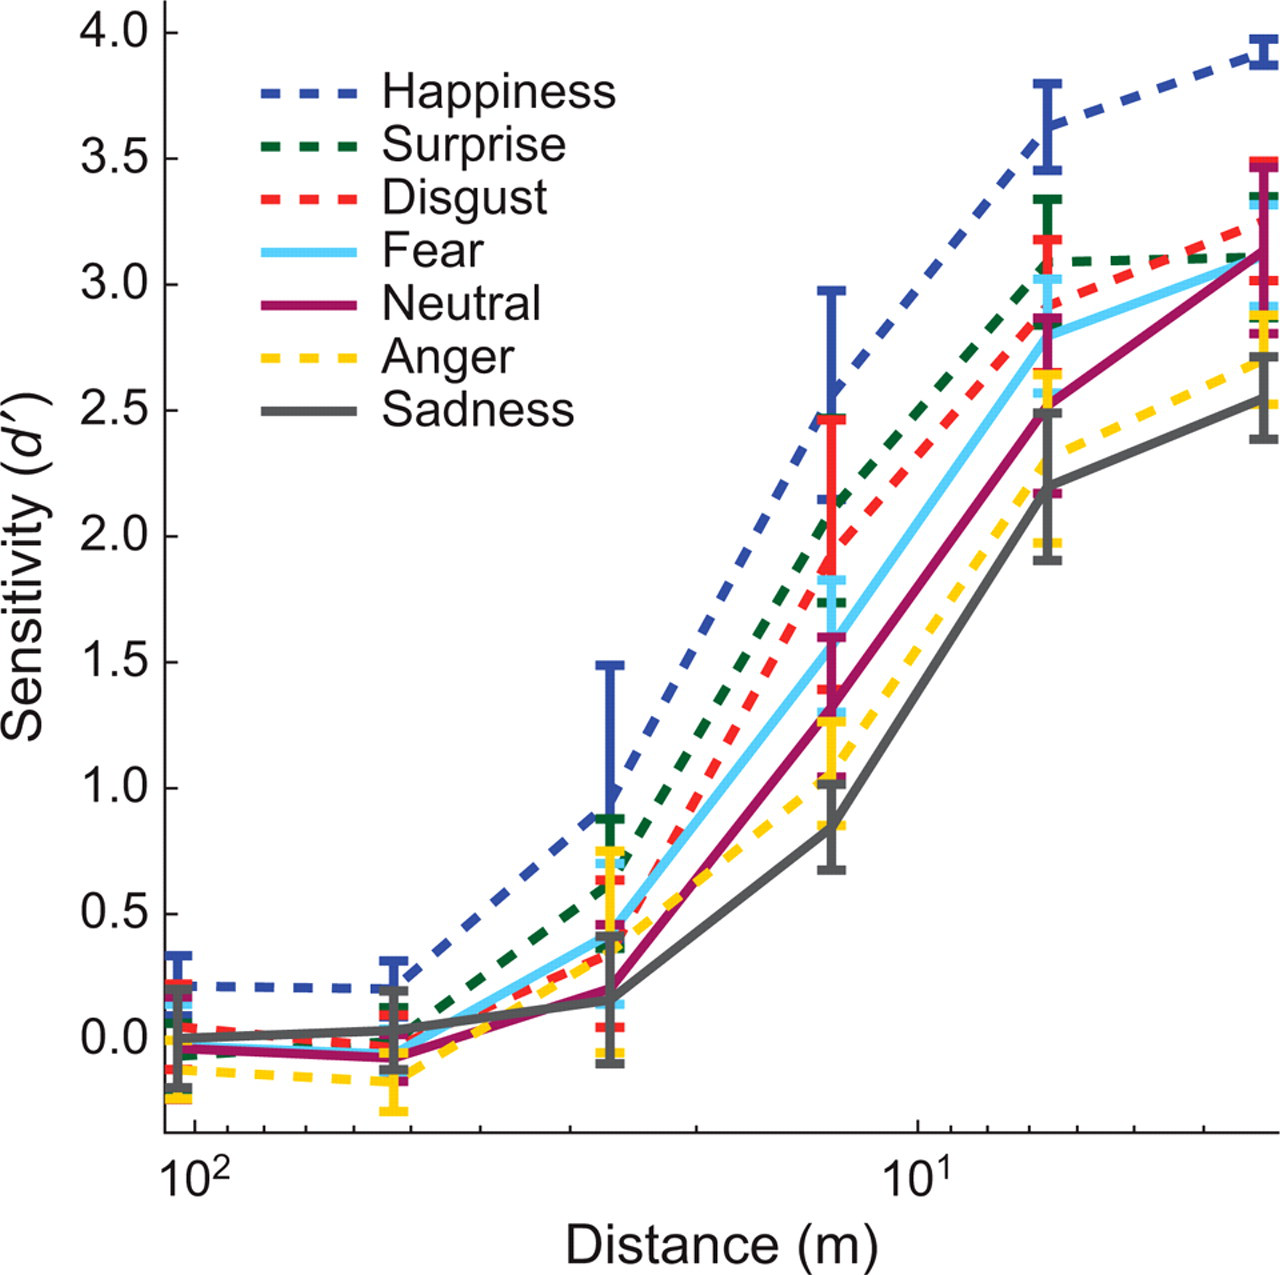
Sensitivity (d′) for each expression as a function of viewing distance. Sensitivity was averaged across observers and presentation times. It was computed independently for each expression, viewing distance, and presentation time as the observer's sensitivity (d′) in discriminating each expression from the other expressions in the tested set. Results for proximal expressions are coded with solid lines, and results for distal expressions are coded with dashed lines. Error bars show 1 standard error across participants.
Our prediction of proximal and distal expressions agrees with the data: Proximal expressions, whose average SF band usage is in the higher SFs (neutral, fear, and sadness), tend to be more impaired than distal expressions, whose average SF band usage is in the lower SFs (happiness, surprise, and disgust), across several physical distances. This pattern is highlighted by a significant interaction between expression and viewing distance, F(29.4, 147.1) = 8.30, p < .001. Importantly, fear is not well recognized across the range of viewing distances, falling in the middle of the seven expressions. We quantified the relationship between the two analyses reported by binarizing, and then correlating, our two experimental outcome variables: The first variable classifies an expression's SF usage as either distal or proximal (Experiment 1), and the second classifies each expression as either above or below mean recognition distance for a sensitivity value of 2 (half the range of the sensitivity scale, Experiment 2). The correlation is significant (ϕ = 0.75, p ≤ .05; see Howell, 2002). Expressions that are, on average, biased toward lower SF information tend to be biased toward above-mean recognition distance.
GENERAL DISCUSSION
We have shown that the diagnostic SF spectra predict the performance of observers in recognizing different facial expressions across a range of viewing distances. The psychophysical data reveal a gradient of recognition proceeding as follows: sadness, anger, fear, disgust, surprise, and happiness. That sadness is poorly recognized is not surprising, because there is no obvious survival benefit to detect it from far away. It is more surprising that anger, a signal conveying threat, and fear, a signal conveying potential danger, are both poorly recognized across a range of viewing distances. One might have expected evolutionary pressures toward distal recognition in each case.
In contrast, happiness and surprise are our most distal expressions. Both expressions are LSF rich (see Fig. 3) and involve the mouth more than any other expressions. Note that, in surprise and happiness expressions (when the teeth are shown), a “catastrophic” transformation of the face happens (the mouth opens, revealing the teeth); this transformation is, itself, represented in the LSF of the diagnostic spectra (see Fig. 3). The reasons for such catastrophic transformations are puzzling. Happy expressions have been proposed to signal a willingness to engage in reciprocal altruism (Schmidt & Cohn, 2001), but this does not seem to provide, in itself, any reason for distal recognition to be favored. Nonetheless, some authors have argued for a homology between facial expressions of happiness in humans and the silent bared-teeth display in nonhuman primates (e.g., Preuschoft, 1992; Van Hooff, 1972), even though the latter is associated with signaling fear or appeasement (Schmidt & Cohn, 2001). Perhaps this provided a pressure toward distal recognition for happy expressions.
Surprise, on the other hand, is a transient signal indicating something unexpected that rapidly changes into another emotion (Ekman & Friesen, 1975). Why should this expression be characterized by an LSF-rich signal? One answer comes from the work of Susskind et al. (2008), who investigated the sensory benefit for the sender in transmitting an emotion signal. Their work suggests that expressing surprise should result in the greatest benefit to the sender, greater even than fear, because surprise also involves opening the mouth, thereby enhancing sensory preparedness for rapid reaction. Thus, perhaps it is surprise, not fear, which needs to be recognized from far away, because it is the better signal of an unexpected event to which the receiver should also react.
Such considerations must, in any case, remain speculative until we have an analysis of both how the different facial expressions evolved their specific patterns of muscular movements and the range of naturalistic contexts in which each expression occurs (see Schmidt & Cohn, 2001; Susskind et al., 2008). Facial muscle configuration is critical because it determines the SF representation of each expression and hence the range of viewing distances from which it can be successfully recognized. The range of natural contexts within which different expressions are utilized, on the other hand, speaks directly to the evolutionary function of expression signaling. Without such analyses, we risk forgetting that the proximal or distal character of a given expression may be incidental to its evolutionary function.
We believe that there is much scope in an approach that first defines the signal and observer characteristics of important evolutionary categories and then examines how the brain has adapted to process these characteristics.
Footnotes
Acknowledgements
We thank Marie Smith. This work was supported by Economic and Social Research Council Grant RES-060-25-0010.