
Abstract
Screening for early reading problems is a critical step in early intervention and prevention of later reading difficulties. Evaluative frameworks for determining the utility of a screening process are presented in the literature but have not been applied to many screening measures currently in use in numerous schools across the nation. In this study, the accuracy of several Dynamic Indicators of Basic Early Literacy Skills (DIBELS) subtests in predicting which students were at risk for reading failure in first grade was examined in a sample of 12,055 students in Florida. Findings indicate that the DIBELS Nonsense Word Fluency, Initial Sound Fluency, and Phoneme Segmentation Fluency measures show poor diagnostic utility in predicting end of Grade 1 reading performance. DIBELS Oral Reading Fluency in fall of Grade 1 had higher classification accuracy than other DIBELS measures, but when compared to the classification accuracy obtained by assuming that no student had a disability, suggests the need to reevaluate the use of classification accuracy as a way to evaluate screening measures without discussion of base rates. Additionally, when cut scores on the screening tools were set to capture 90 percent of all students at risk for reading problems, a high number of false positives were identified. Finally, different cut scores were needed for different subgroups, such as English Language Learners. Implications for research and practice are discussed.
The context for this research is screening within a response to intervention (RTI) framework. RTI is a multitiered instructional and service delivery model designed to improve student learning by providing high–quality instruction, intervening early with students at risk for academic difficulty, allocating instructional resources according to students’ needs, and distinguishing between students whose reading difficulties stem from experiential and instructional deficits as opposed to a learning disability. Derived from the prevention sciences, RTI represents an attempt to identify and help struggling readers early before academic problems develop into intractable deficits. The starting point for RTI is the universal screening (e.g., all students are screened) for academic difficulties.
The purpose of screening in RTI is to identify students who, despite a strong general education program (Tier 1), are on a path to failure. In prevention models, screens are designed to predict a negative outcome (the criterion) months or years in advance of the outcome so that appropriate, early intervention can be provided. In this way, reading screens identify students who without intervention are destined to fail a future reading test (i.e., read at a level deemed unsatisfactory).
Some schools use norm–referenced test scores for their criterion measure, defining poor reading by a score corresponding to a specific percentile (e.g., below the 10th, 15th, 25th, or 40th percentile). Others define poor reading according to a predetermined standard (e.g., scoring below “basic”) on the state's proficiency test. The important point is that satisfactory and unsatisfactory reading outcomes are dichotomous, defined by a cut point on a reading test given later in the students’ career.
In identifying candidates for intervention services, schools typically follow one of two models (Jenkins, Hudson, & Johnson, 2007). In Direct Route Models students identified as at risk by a screening process are immediately provided Tier 2 intervention (e.g., Vellutino et al., 1996). By contrast, in Progress Monitoring, or PM Route Models, universal screening identifies potentially at–risk students whose progress is subsequently monitored for several weeks. These potentially at–risk students may enter Tier 2 intervention depending on the level of their performance and rate of growth on PM measures (Compton, Fuchs, Fuchs, & Bryant, 2006). The PM Route yields better identification accuracy than the Direct Route. For example, Compton et al. (2006) improved overall classification accuracy from 81 to 83 percent and were able to identify 90 percent of the students at risk when they added 5 weeks of word identification fluency progress monitoring to a composite screening measure. Although PM routes can improve accuracy, it adds to the logistical challenges of screening and can postpone intervention during the PM phase. By contrast, the Direct Route leads to earlier intervention, but without PM to catch screening errors more students are mistakenly identified as at risk. In a national RTI model site identification project conducted by the National Research Center on Learning Disabilities, most schools reported using a Direct Route Model (Mellard, Byrd, Johnson, Tollefson, & Boesche, 2004).
An ideal screen is practical (i.e., inexpensive, relatively brief, easily administered, scored, and interpreted) and has consequential validity—meaning that the net effect for students is positive (Messick, 1989). That is, students identified as at risk should receive timely and effective intervention, and no students or groups should be shortchanged. A screen must be relatively accurate—capable of distinguishing students who will subsequently demonstrate performance difficulties from those who will not (Glover & Albers, 2007; Jenkins, 2003). A variety of statistics are used to evaluate a screen's accuracy, most prominently sensitivity and specificity. Sensitivity focuses on a screen's accuracy in identifying individuals who fail a later criterion test (e.g., the percentage of the individuals classified as unsuccessful on the future criterion reading test who were correctly identified as at risk on the screen). Sensitivity is calculated as a ratio of the number of students correctly identified by the screen as at risk (true positives) to the total number of students who perform poorly on the outcome measure (true positives + false negatives, or students who pass the screen but fail the outcome measure). By contrast, specificity focuses on a screen's accuracy in identifying individuals who will pass the later criterion measure (e.g., the percentage of the individuals classified as successful on the future criterion reading test who were correctly identified as not at risk on the screen). Specificity is calculated as a ration of the number of students who are correctly identified as not at risk (true negatives) to the total number of students who are successful on the outcome measure (true negatives + false positives, or students who are identified as at risk by the screen but later are successful on the outcome measure).
As sensitivity levels decline, screens miss more truly at–risk students. As specificity declines, screens overidentify students as at risk who are not really at risk. Are there minimums for sensitivity and specificity? If the purpose of screening is to ensure that truly at–risk students are identified and helped, minimum sensitivity should be high, perhaps as high as 90 percent, so that few students slip through the cracks (Jenkins, 2003; Jenkins et al., 2007; Jenkins & Johnson, 2008). Specificity levels should also be relatively high because overidentifying students as at risk taxes school resources, assigning intervention services to students who do not need them.
Sensitivity and specificity levels can be difficult to interpret on their own and of limited practical utility without reporting associated cut scores. Receiver operating characteristic (ROC) curves present another useful way to interpret sensitivity and specificity levels and to determine related cut scores. ROC curves are a generalization of the set of potential combinations of sensitivity and specificity possible for predictors (Pepe, Janes, Longton, Leisenring, & Newcomb, 2004). ROC curve analyses not only provide information about cut scores, but also provide a natural common scale for comparing different predictors that are measured in different units, whereas the odds ratio in logistic regression analysis must be interpreted according to a unit increase in the value of the predictor, which can make comparison between predictors difficult (Pepe et al., 2004). An overall indication of the diagnostic accuracy of an ROC curve is the area under the curve (AUC). AUC values closer to 1 indicate the screening measure reliably distinguishes among students with satisfactory and unsatisfactory reading performance, whereas values at. 50 indicate the predictor is no better than chance (Zhou, Obuchowski, & Obushcowski, 2002).
One other common metric for reporting a screening procedure's utility is classification accuracy. Classification accuracy represents the percentage of students correctly classified as either true positives or true negatives. Classification accuracy, however, must be evaluated by considering the base rate of the population with the condition being predicted (Meehl & Rosen, 1955; Wilson & Reichmuth, 1985). If the base rate of a condition (e.g., reading disability [RD]) is relatively low, high classification accuracy could be obtained simply by declaring everyone to be not at risk (Wilson & Reichmuth, 1985). For example, if in a population of 100 students the incidence of reading disability is 10 percent, declaring all students to not have a reading disability results in 90 percent classification accuracy—the 90 students without a reading disability are correctly identified. However, we have 0 percent sensitivity and 100 percent specificity. If we decide that it is important to identify and intervene for students with RD and hence implement a screening procedure that identified as at risk 5 students who do have RD and 5 students who do not have RD, the overall classification accuracy would still be 90 percent. Sensitivity would be 50 percent (5/10) with specificity of 94 percent (85/90). As these examples show, classification accuracy and the implications of decisions made on the basis of screening results can be misleading if not considered within the context of base rates (Wilson & Reichmuth, 1985). Ideally, a screening instrument improves classification accuracy at a rate that is significantly better than that obtained by identifying no students and also leads to decisions about intervention that are educationally sound and cost effective (e.g., providing intervention early to students identified as at risk through screening is more efficient than waiting until difficulties become more pronounced and perhaps intractable). In this study, we report sensitivity, specificity, cut scores, classification accuracy, and ROC AUC as indications of the various screening measures’ utility.
By far, the most widely adopted early screening instrument for identifying at–risk readers is the Dynamic Indicators of Basic Early Literacy Skills (DIBELS; Good & Kaminski, 2002), which has been used by more than 14,000 schools (https://dibels.uoregon.edu/data/index.php) in assessing more than 1,800,000 students (Samuels, 2007). The DIBELS consist of five brief tests—Letter Name Fluency (LNF), Initial Sound Fluency (ISF), Phoneme Segmentation Fluency (PSF), Nonsense Word Fluency (NWF), and Oral Reading Fluency (ORF) administered at different points across Grades K–3. DIBELS’ widespread adoption can be attributed in part to its grounding in letter, phonological, decoding, and text reading skills that are building blocks of beginning reading competence and in part to its ease of use.
However, the DIBELS screens are only moderately accurate in predicting which students will read satisfactorily or unsatisfactorily at the end of Grade 1 (Fuchs, Fuchs, & Compton, 2004; Jenkins et al., 2007; Riedel, 2007; Schatschneider, 2006). For example, Riedel (2007) reported sensitivity and specificity levels for beginning of Grade 1 screens using LNF (68 percent and 65 percent, respectively), PSF (61 percent and 60 percent, respectively), and NWF (68 percent and 68 percent, respectively) in distinguishing between children who ended Grade 1 with poor versus good reading comprehension on a standardized test. Depending on the specific DIBELS measure, the screen missed between 32 percent and 39 percent of the truly at–risk students, and mistakenly overidentified between 32 percent and 40 percent of the children. Similarly, Schatschneider (2006) found that the DIBELS LNF screen administered at the end of kindergarten produced sensitivity and specificity levels of 52 percent and 85 percent, respectively, in distinguishing between children who ended Grade 1 with good or poor reading comprehension on a standardized test.
Good (2008) acknowledged that DIBELS screens are more accurate in classifying students who reside at the ends of the reading skill distribution than students who are in the middle and noted that the DIBELS trifold classification of relative risk—“at risk,”“some risk,” and “low risk”—takes this problem into account. In theory, intervention decisions for DIBELS “at risk” and “low risk” groups are straightforward (i.e., Tier 2 for the former, Tier 1 for the latter), but intervention decisions for students in the “some risk” group are not. Students who fall in the “some risk” category are as likely to perform satisfactorily as unsatisfactorily on outcome measures (Buck & Torgesen, 2003), making predictions based on this risk category more challenging for practitioners. In practice, even decisions in the “at risk” or “low risk” categories may have questionable accuracy so that schools employing DIBELS in a Direct Route RTI model lack adequate information to improve decision making about all three groups.
Can We Improve on DIBELS Screening Accuracy?
Researchers have reported an advantage for multiple measure screening batteries (Catts, Fey, Zhang, & Tomblin, 2001; Compton et al., 2006; Foorman, Francis, Fletcher, Schatschneider, & Mehta, 1998; Jenkins & O'Connor, 2002). That is, rather than relying on a single screening measure, classification accuracy is sometimes improved by including multiple measures in the screening battery (Davis, Lindo, & Compton, 2007; O'Connor & Jenkins, 1999). For example, in the DIBELS system, screening of beginning first graders typically focuses on NWF. Expanding the screening battery to take into account Letter Sound Fluency (LSF), PSF, and ORF or a vocabulary measure could potentially add to screening accuracy. Riedel (2007) found that vocabulary scores distinguished between first–graders whose spring DIBELS ORF scores were satisfactory but whose reading comprehension was not. Although this finding derived from concurrent end–of–year scores (i.e., the vocabulary and the criterion tests occurred together), it suggests that including vocabulary in a screening battery might add to classification accuracy when reading comprehension is the outcome of interest. In addition, information about students’ poverty status and language background (e.g., English Language Learners [ELLs]) also holds potential for improving screening accuracy (Jenkins et al., 2007). Two studies have found performance differences associated with language and poverty status on ORF and state standards reading tests (Hixson & McGlinchey, 2004; Wiley & Deno, 2005). Adjustments in screening cut scores for these groups may improve classification accuracy.
In this study, we focused on kindergarten and first–grade screens, asking whether the accuracy of DIBELS measures could be improved by combining them with other DIBELS measures, non–DIBELS measures (e.g., vocabulary), and status markers (e.g., language status). In this study, we focused on early screens because research supports that early identification and intervention is generally more successful in reducing the number of students later identified as having a reading disability (Snow, 1998). Following the procedures proposed by Jenkins et al. (2007) and Meehl and Rosen (1955) for screening research protocols, we:
Defined “at risk” in terms consistent with operational definitions (e.g., <40th percentile, <20th percentile) and examined the classification accuracy of predictors for both definitions of risk status. Decided upon a minimum sensitivity level. We set sensitivity at 90 percent so that the screen would identify nearly all of the truly at–risk readers. Worked backwards from the end–of–year criterion test to determine cut points on the screen that produced 90 percent sensitivity. We first identified the end of Grade 1 measures that were most predictive of Grade 2 and Grade 3 outcomes. We used unsatisfactory reading achievement in spring of Grade 1 as the criterion outcome, then identified screening cut points that yielded 90 percent sensitivity on screens collected at the end of kindergarten and beginning of first grade. Having set cut scores yielding 90 percent sensitivity, identified the screening measures that produced the best specificity (fewest false positives) and computed the classification accuracy. Determined if specificity and classification accuracy could be improved by combining screening measures. Cross–validated the cut points with a different sample. Evaluated different cut points for different subgroups.
This study adds to the literature on screening for early reading problems in several ways. First, it provides alternative ways to determine a screening instrument's accuracy in predicting which students require intervention in an RTI framework. Next, employing an unusually large database, the research examines the relative validity of potential end of first–grade criterion measures (i.e., DIBELS ORF and the Stanford Achievement Test [SAT]), based on their correlation with a later (end of third grade) reading test. Linking early outcomes with later reading performance helps to identify those students at risk of not meeting performance benchmarks at a point when the stakes are especially high. For example, students who fail to meet third–grade performance targets may be retained. Identifying and intervening early could help prevent retention. Third, using logistic regression and AUC statistics, the research identified the strongest predictors and combinations of predictors of Grade 1 reading failure for screens administered at two time points (end of kindergarten and beginning of Grade 1). Fourth, for each measure it identifies and cross–validates cut scores that produce 90 percent sensitivity levels along with specificity levels that are associated with this level of sensitivity. Finally, it tested the effects of varying cut scores for different subgroups (e.g., ELL students).
Method
Participants
This study was conducted using the Progressing Monitoring and Reporting Network (PMRN) at the Florida Center for Reading Research. The database used for this study included 12,055 students from 309 schools in 33 districts across Florida State public schools. Student data on a variety of reading measures were collected beginning in the kindergarten year (2003–2004 school year) and continued throughout the end of their third–grade year (2006–2007 school year). The sample contained comparable representation of females (n = 6,111) and males (n = 5,944) and included the following representation of ethnicity: Caucasian (n = 5,028, 42 percent), African American (n = 3,577, 30 percent), Hispanic (n = 2,670, 22 percent), Multiracial (n = 536, 4 percent), Asian (n = 197, <2 percent), and American Indian (n = 47; <1 percent). In the sample, 21 percent (n = 2,531) of students received special education services, and 64 percent qualified for free or reduced–cost lunch (FRL) (n = 7,736). These numbers are somewhat higher than national averages because the data come primarily from Reading First schools. The population of ELLs varied across school years, starting higher in kindergarten (n = 1,787) and decreasing each successive year due to exiting from the program once they attained a designated proficiency in English (first grade, n = 1,217; second grade, n = 1,026; third grade, n = 901).
Measures
Dibels
The DIBELS ISF, PSF, NWF, and ORF were administered at various times during the 4–year period. In the ISF subtest, students are shown four pictures on a page, and the examiner names each picture. Then the student is asked to point to the picture that begins with a specific sound. For example, if one of the pictures is of a mouse, the student is asked, “Which picture begins with /m/?” and points to the picture. The student response time is recorded intermittently (e.g., time is stopped as the administrator names the pictures and changes pages). The ISF subtest has reported predictive validity with the Woodcock Johnson Cluster score of. 37 and alternate form reliabilities ranging from. 51 to. 73 (Good & Kaminski, 2002).
In the PSF subtest, students listen to a word and then tell the examiner all the sounds in the word. For example, if the examiner says the word “mop” the student would say /m//o//p/. At the end of 1 minute, the number of sound segments produced correctly is recorded. The PSF subtest has reported predictive validity with curriculum–based measurement (CBM–R) of. 52 and concurrent validity with the Woodcock Johnson Readiness Cluster of. 54 for kindergarten and. 27 in first grade. Reported alternate form reliabilities range from. 60 to. 79 (Good & Kaminski, 2002).
In the NWF subtest, students are shown a list of 40 nonsense words on a page, and asked to read as many made–up words in 1 minute as possible (e.g., “sep,”“fut”). Scores are calculated for the correct sounds provided. The NWF subtest has reported predictive validity with CBM–R ranging from. 63 to. 85 and from. 52 to. 77 with the Woodcock Johnson Total Reading Cluster. It has alternate form reliability ranging from. 67 to. 88 (Good & Kaminski, 2002).
In the ORF subtest, students are given a passage and asked to read for 1 minute. Scores are calculated based on the number of words read correctly. In this study, ORF was administered in the beginning of first grade. The DIBELS technical reports do not provide psychometric information for ORF in first grade. Studies have examined the use of ORF at the end of first grade to predict end of Grade 2 outcomes (Schatschneider, 2006) or to determine the concurrent validity of ORF with other measures (Riedel, 2007). Concurrent validity of end of Grade 1 ORF with end of Grade 1 comprehension measures ranged from. 67 (Riedel, 2007) to. 73 (Cook, 2003).
Peabody Picture Vocabulary Test—Third Edition (PPVT)
The PPVT (Dunn & Dunn, 1997) is a measure of receptive vocabulary in which the participant is required to select one of four pictures that best depicts meaning of a word spoken by the examiner. Stimulus items are presented in ascending difficulty.
Sat—10Th Edition
The SAT is a multiple–choice test published by Pearson (Harcourt) for use at Grades K–12. In this study, the SAT Reading Comprehension subtest for Grades 1–2 was administered.
Florida Comprehensive Assessment Test—Sunshine State Standards (FCAT)
The FCAT is Florida's state achievement test and measures student achievement in reading for students in Grades 3–10. The FCAT is a standardized, criterion–referenced test that consists of both literary and informational passages and multiple–choice questions that evaluate a student's ability to comprehend passages. Scores for FCAT Reading are reported on a scale of 100–500, with a mean of 300 and standard deviation of 50 (Florida Department of Education, 2005). The reported reliabilities for the third–grade reading test is. 92 (Harcourt, 2007). Correlations of FCAT with SAT are high, ranging from. 70 to. 81 (Crist, 2001).
Procedures, Data Collection, and Analysis
The database used for this study stemmed from the PMRN, whereby data for each student were input at the school (or district) level through a computer interface. The database included assessment data for students who entered kindergarten in 2003–2004 and collected assessment data for these students from kindergarten to third grade. The schedule for the DIBELS assessment in the PMRN database was set within Florida Reading First programs. According to this schedule, DIBELS measures used in kindergarten through second grade were administered four times a year in September, December, February, and April. In third grade, ORF was given three times a year in September, January, and April. Assessments were administered by trained school– or district–based assessment teams, which included no classroom teachers. ISF was given during the first three testing sessions of kindergarten. The LNF was administered during the four testing sessions of kindergarten and the first session of first grade. PSF was given in the last two sessions of kindergarten and all sessions in first grade. NWF was administrated in the last two sessions of kindergarten and all four sessions of first and second grades. ORF was given in all four sessions of first, second, and third grades. Finally, the PPVT and SAT were administered in February of first through third grades, and the FCAT was administered in February at the end of third grade. For purposes of this study, only students in the PMRN database who had scores on all of the variables used in this study were included.
To settle on an appropriate spring of Grade 1 criterion measure that we could then use to evaluate screens administered at the end of kindergarten and beginning of Grade 1, we began by correlating spring of Grade 1 measures (ORF, SAT, PPVT) with third–grade reading outcomes (third–grade FCAT), Next, we randomly split the data file into two cohorts (Cohort 1, N = 7,072; Cohort 2, N = 5,983) and correlated end of kindergarten measures (spring ISF, PSF, NWF, and PPVT) with the first–grade criterion test, examining correlations using both scale scores and dichotomized outcomes (satisfactory/unsatisfactory performance) on the criterion test. Logistic regression using the kindergarten measures as predictors was then employed to determine the predictor with the highest classification accuracy of unsatisfactory performance for spring of first grade. This procedure was repeated, this time using the beginning Grade 1 screening measures (PSF, NWF, ORF) to predict Grade 1 spring outcomes. Then, to determine if classification accuracy could be improved with a combination of measures, we included all kindergarten measures in the logistic regression. This process was repeated for the fall Grade 1 predictors (PSF, NWF, ORF).
We next computed overall classification accuracy of the various screens. As we noted earlier, overall classification accuracy of predictors can inform research efforts, but identifying cut scores and resultant sensitivity and specificity levels is of critical importance to practitioners operating under an RTI framework. Sensitivity and specificity levels describe how well the test discriminates between students who are at risk and those not at risk. Sensitivity is calculated as the ratio of true positives (students identified as at risk who later perform unsatisfactorily on the outcome measures) to the sum of true positives and false negatives (students not identified as at risk who later perform unsatisfactorily on the outcome measures). Specificity measures a screen's accuracy in identifying as not at risk those individuals who later do not exhibit a reading problem. It is calculated as the ratio of true negatives to the sum of true negatives and false positives. There is always a trade–off between sensitivity and specificity; as one increases, the other decreases. These trade–offs can impact classification accuracy. In a prevention approach to reading difficulties, it is better to err on the side of false positives (over–identification), because the point of prevention screening is to ascertain those students who without help are on a path to failure. In this analysis, we set sensitivity levels at 90 percent and identified through ROC analyses the associated cut score and specificity levels for each of the measures. Next, using the cut score identified in the ROC analysis, we identified the numbers of students classified as true positives, false negatives, true negatives, and false positives and calculated the resultant classification accuracy as the percentage of the total sample correctly identified.
Unless a screening instrument is very accurate, setting high sensitivity levels likely results in a high number of false positives, and low specificity. Given a sensitivity level of 90 percent, we anticipated a large number of false positives, or students who are identified as at risk by the screening measure, but later are successful on the outcome measure. Because no screening process is 100 percent accurate, practitioners must decide whether to err on the side of false positives, or false negatives, students who meet the cut score on the screening measure but do not meet performance levels on the outcome. Most practitioners choose to err on the side of overidentification, but too many false positives can tax limited resources, and render some intervention efforts less effective. To determine if a combination of measures could improve the specificity of the best predictor of Grade 1 outcomes, we selected students whose score on the first predictor fell at or below the cut score identified to achieve 90 percent sensitivity. Next, we selected a second predictor based on the result of our logistic regression with combined measures. If a predictor added to the classification accuracy, we identified whether a specific cut score on that predictor improved specificity levels without sacrificing sensitivity.
Although cut scores were cross–validated across two subsamples, one danger of generalizing cut scores is that they may not hold up across different populations (Jenkins et al., 2007; Meehl & Rosen, 1955) in part because the base rates of the groups may be different. In this sample, the base rate of poor performance on FCAT for non–ELL/non–FRL students was 15.4 percent, for first–grade SAT it was 17.5 percent. For ELL students, it was 49.3 percent on FCAT and 49.3 percent on SAT 10. For FRL students, it was 36.3 percent on FCAT and 32.7 percent on SAT 10. Therefore, we hypothesized that different cut scores for different subgroups might be needed. A subsample (n = 1,217) of ELLs, a subsample of students eligible for FRL (n = 1,283), and a comparison group of non–ELLs/non–FRL students (n = 1,382) were created and the analyses to identify best predictors and cut scores resulting in 90 percent sensitivity were repeated.
Results
Which First–Grade Measure Best Predicts Third–Grade Reading Performance?
Our overall goal was to evaluate screens that identify students with unsatisfactory reading achievement in spring of Grade 1, but our first task was to select a Grade 1 spring measure to serve as the criterion outcome. Rather than arbitrarily choosing a criterion measure, we examined the relative validity of three Grade 1 (spring) criterion measures (ORF, SAT, PPVT) by correlating them with an even later reading outcome, Grade 3 FCAT, using Pearson and point–biserial correlations, respectively, for (1) FCAT standard scores and (2) FCAT scores dichotomized into satisfactory/unsatisfactory reading levels, based on the Florida Department of Education's (2005) classification of unsatisfactory reading (FCAT levels 1–2) and satisfactory reading (FCAT levels 3–4). Of the three spring Grade 1 measures (ORF, SAT, PPVT), SAT had the highest correlation with Grade 3 FCAT (R =. 608) and with FCAT dichotomized scores (R =. 483). Correlations of ORF with FCAT standard scores and FCAT dichotomized scores were R =. 546 and R =. 401. PPVT correlated with FCAT standard scores R =. 533 and with FCAT dichotomized scores R =. 409.
What End–of–Kindergarten Measure Best Predicts First–Grade Spring Performance on the SAT?
Table 1 shows that of the correlations between kindergarten spring screens (ISF, PSF, NWF, and PPVT) and Grade 1 spring SAT standard scores, NWF registered the strongest relationship (r =. 498). Next, we dichotomized SAT percentile scores into satisfactory/unsatisfactory performance, where unsatisfactory performance was defined as below the 40th percentile. The 40th percentile cut score is also used in Florida schools to determine who is at risk for unsatisfactory performance on the FCAT. In this data set, 28.6 percent or 3,445 students’ performance fell in this category. A logistic regression that used end–of–kindergarten measures as predictors and end of Grade 1 SAT unsatisfactory performance as the outcome found that NWF resulted in the highest classification accuracy (75.4 percent). We must note that the 75.4 percent accuracy rate was only a 4 percent improvement over a no screening option. That is, classifying no students as at risk produced 71.4 percent classification accuracy.
Correlation Matrix for K–Spring and Grade 1–Fall Predictors and Grade 1 Outcome (SAT)
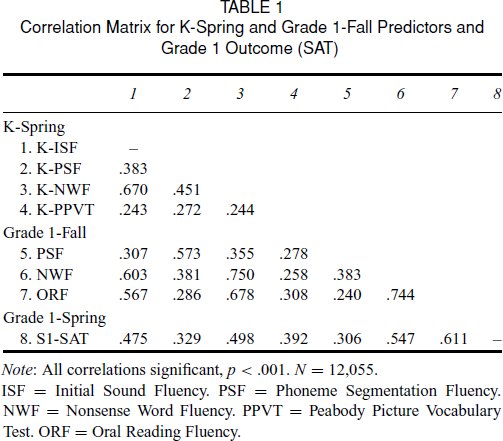
Note: All correlations significant, p <. 001. N = 12,055.
ISF = Initial Sound Fluency. PSF = Phoneme Segmentation Fluency. NWF = Nonsense Word Fluency. PPVT = Peabody Picture Vocabulary Test. ORF = Oral Reading Fluency.
We next sought to improve classification by combining kindergarten NWF with other potential screens. Adding PSF to NWF did not change classification accuracy; adding ISF to NWF increased accuracy from 75.4 percent to 75.8 percent; adding PPVT to NWF increased accuracy from 75.4 percent to 76.1 percent. Because of the very large sample size, these increases were statistically significant, but of questionable practical value. Even combining all predictors (NWF, PSF, ISF, and PPVT) resulted in only a 1.1 percent improvement over NWF by itself.
What Beginning of Grade 1 Measures Best Predicts Grade 1 Performance on the SAT?
Table 1 shows that of the correlations between Grade 1 screens (ISF, PSF, NWF, and PPVT) and Grade 1 spring SAT standard scores, ORF was most strongly related to the SAT criterion measure (r =. 611). A logistic regression using beginning of Grade 1 screens to predict end of Grade 1 classification accuracy confirmed that ORF was the strongest predictor (76.9 percent classification accuracy).
We attempted to improve classification by adding other DIBELS screens to ORF. Adding PSF to ORF increased accuracy from 76.9 percent to 78 percent; adding NWF to ORF increased accuracy from 76.9 percent to 78.3 percent. Because of the large sample size, these rather small increases were statistically significant. Combining all three DIBELS screens (PSF, NWF, and ORF) did not improve classification in a practically significant way (78.7 percent). We also examined whether vocabulary could improve the classification accuracy as suggested by Riedel (2007). Adding PPVT to ORF increased the accuracy of ORF to 78 percent.
Screening Accuracy in Identifying Unsuccessful Readers (SAT <40th Percentile)
Having defined unsatisfactory performance as a SAT score below the 40th percentile, we identified cut scores yielding 90 percent sensitivity for each screening measure. In cross–validating the results across the two subsamples, we observed no differences in the cut scores. Table 2 shows results for the entire sample (N = 12,055) including cut scores yielding 90 percent sensitivity for each screening measure, their associated specificity levels, ROC AUC, and classification accuracy for all kindergarten and Grade 1 screening measures. Additionally, Table 2 reports the classification accuracy and associated sensitivity, specificity, hit rate, and cut score based on accuracy levels resulting from the logistic regression analysis as a way to compare how changes in sensitivity and specificity result in different hit and error rates. For comparison, the bottom row of Table 2 reports the classification accuracy and associated sensitivity, specificity, hit rate, and cut score based on a hypothetical measure that identified no student as at risk for poor reading outcomes.
Classification Indices for the K–Spring and Grade 1–Fall Predictors Set for 90 percent Sensitivity (SAT <40th percentile)
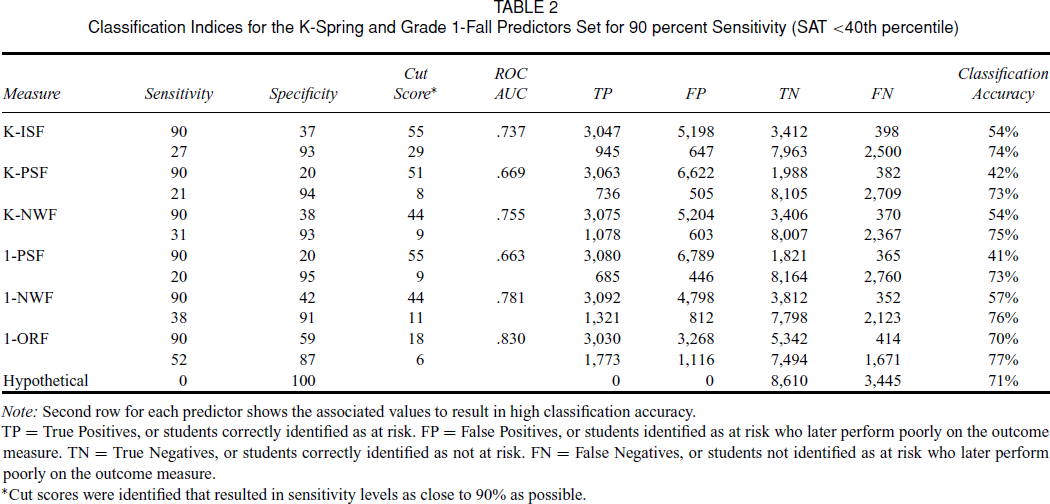
Note: Second row for each predictor shows the associated values to result in high classification accuracy.
TP = True Positives, or students correctly identified as at risk. FP = False Positives, or students identified as at risk who later perform poorly on the outcome measure. TN = True Negatives, or students correctly identified as not at risk. FN = False Negatives, or students not identified as at risk who later perform poorly on the outcome measure.
*Cut scores were identified that resulted in sensitivity levels as close to 90% as possible.
When sensitivity was set at 90 percent, specificity levels were low across the various predictors, ranging from 20 percent (K and Grade 1 PSF) to 59 percent (Grade 1 ORF). In other words, 90 percent sensitivity produced high rates of false positives. An alternate approach optimizes classification accuracy by allowing the logistic regression to set the optimal cut score. As shown in Table 2, this approach resulted in a large number of false negatives, thereby failing to identify a high percentage of students who were unsuccessful on the outcome measure. Again classification accuracies (from 73 percent to 77 percent) for the screening measures did not differ substantially from the accuracy level obtained by assuming no student is at risk in this sample (71 percent).
Combining Screens to Reduce Overidentification
To determine if screening specificity could be improved while maintaining 90 percent sensitivity, we selected the Grade 1 screen (ORF) with the highest associated specificity (59 percent) and the Grade 1 screen (NWF) with the next best specificity (42 percent). See Table 2. For the 3,444 students (true positives + false negatives) who fell at or below the ORF cut score of 18, we identified the highest NWF score (60) that distinguished students performing at a satisfactory level on the criterion test. In this way, we used a combination of ORF and NWF scores (i.e., ORF ≤18 AND NWF ≥60) to reduce the number of false positives generated by ORF alone. Unfortunately, combining ORF and NWF screens reduced the original 3,268 false positives by only 57 students, less than a 1 percent improvement in specificity.
We repeated our attempt to improve specificity by combining screening measures, this time using ORF and PPVT scores. Recall that the PPVT was administered in February of kindergarten. Of the 3,444 students who fell at or below the ORF cut score, the 56 students who registered PPVT scores >124 also registered satisfactory scores on the Grade 1 SAT, a negligible improvement in specificity.
Screening Accuracy in Identifying More Impaired Readers (Scoring <20th Percentile)
The criterion for unsatisfactory reading can be defined in many ways (e.g., scores below the 40th percentile, scores below the 20th percentile). To broaden our research analysis, we examined unsatisfactory reading using a lower criterion (i.e., SAT scores ≤20th percentile). This definition of unsatisfactory performance was selected for two reasons. First, in Florida, students who perform at this level are considered to be at high risk for reading outcomes and can therefore be eligible to receive more intensive instructional support. Therefore, identifying students who are at the highest risk for poor reading outcomes is important. Second, the manipulation of cut scores and the resultant analyses illustrates important points about how the base rate can affect the classification accuracy of a screening measure (Meehl & Rosen, 1955). ROC analyses were repeated using the same predictors as in our previous analysis. In the current sample, 1,188 students or 9.9 percent of the sample fell in this category. Given this low base rate, 90 percent classification accuracy can be achieved simply by assuming that no students are at risk for performance on the SAT. Table 3 shows results for the sample including cut scores yielding 90 percent sensitivity for each screening measure, their associated specificity levels, ROC AUC, and classification accuracy for all kindergarten and Grade 1 screening measure, where very unsatisfactory performance was defined as scoring below the 20th percentile. Cut scores were cross–validated across the two subsamples and were found to be consistent for all subtests, so the table reflects results of the entire sample (N = 12,055). Additionally, Table 3 reports the classification accuracy and associated sensitivity, specificity, hit rate, and cut score when accuracy levels are optimized using logistic regression. For comparison, the bottom row of Table 3 reports the classification accuracy and associated sensitivity, specificity, hit rate, and cut score when no students are identified as having poor reading outcomes.
Classification Indices for the K–Spring and Grade 1–Fall Predictors Set for 90% Sensitivity (SAT <20th percentile)
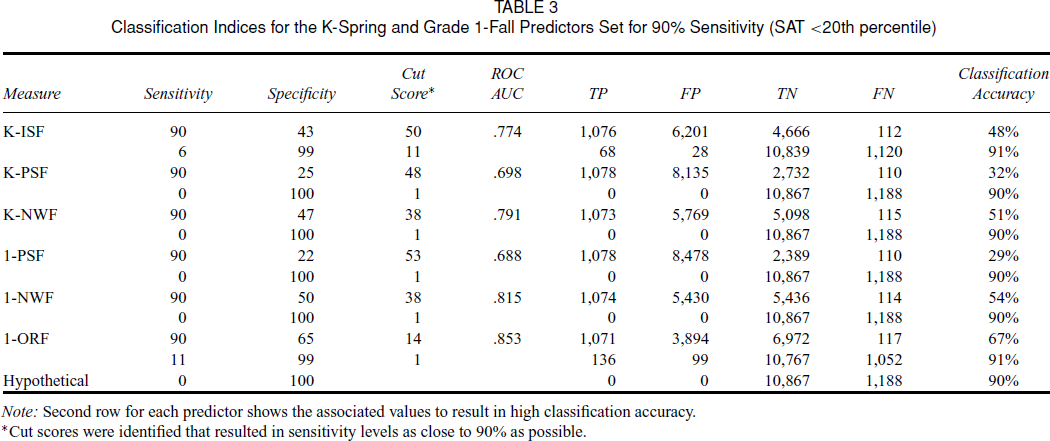
Note: Second row for each predictor shows the associated values to result in high classification accuracy.
*Cut scores were identified that resulted in sensitivity levels as close to 90% as possible.
As with our previous analysis, setting cut scores on the various screening measures in order to identify the majority of students at high risk for reading problems resulted in a high number of false positives, ranging from 3,894 to 8,478. However, although the classification accuracy levels resulting from the logistic regressions are high (between 90 percent and 91 percent across measures), a closer look at the sensitivity levels, cut scores, and hit rates shows that the screens are essentially no better than assuming that no students are at risk.
Combining Screens to Reduce Overidentification
Using SAT <20th percentile to define unsatisfactory reading, we repeated the analysis reported above (when SAT <40th percentile defined unsatisfactory reading). We again attempted to maintain 90 percent sensitivity, but improve specificity by combining either NWF or PPVT with ORF. All students whose ORF score was ≤14 with NWF scores ≥51 scored above the 20th percentile on the SAT. Combining these NWF and ORF scores eliminated 104 false positives, an increase in specificity of less than 1 percent. Turning to PPVT, we found that all students whose ORF score was ≤14 with PPVT scores ≥109 performed above the 20th percentile on the SAT. Combining these NWF and ORF scores eliminated 340 false positives, resulting in an increase in specificity from 65 percent to 67 percent.
Examining Screening Cut Scores for Different Subgroups
In this analysis, we were primarily interested in determining whether the cut scores that produced 90 percent sensitivity differed for ELL and FRL subgroups relative to a non–ELL, non–FRL sample. The screens (K–NWF, 1–ORF) that were the strongest predictors for the full sample were also the best predictors for the EL and FRL subgroups. ROC analyses were conducted to determine cut scores required to achieve 90 percent sensitivity levels. Cut scores and specificity rates for these subgroups differed, as shown in Table 4. The largest difference was observed between the ELL and comparison groups’ ORF cut scores. Whereas an ORF cut score of 21 results in 62 percent specificity for the comparison group (i.e., fewer false positives), an ORF score of 16 for the ELL group was needed to identify 90 percent of students who had unsatisfactory SAT performance, but resulted in only 45 percent specificity (i.e., more false positives).
Classification Indices for the K–Spring and Grade 1–Fall Measures with SAT <40th percentile for ELL, FRL, and Comparison Subgroups
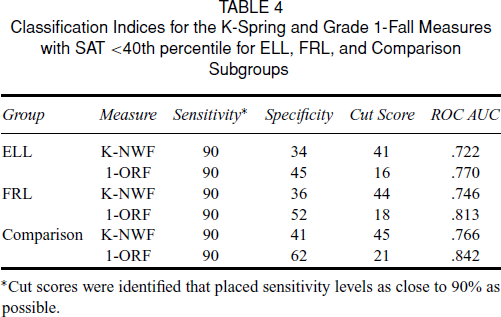
*Cut scores were identified that placed sensitivity levels as close to 90% as possible.
Discussion
This research sought to: (1) identify a Grade 1 reading outcome measure that best predicted end of Grade 3 reading performance on a state assessment; (2) test the utility of DIBELS screening measures in predicting this Grade 1 outcome; (3) determine whether combining screening measures reduced false negatives, thereby improving the screen's specificity; and (4) determine whether subgroups (ELL, FRL, non–ELL, and non–FRL students) require different screening cut scores to assure that at–risk students are identified with 90 percent sensitivity.
Choosing a First–Grade Criterion Test
Screening measures are evaluated according to their predictive validity on a criterion test. How should the criterion test be chosen? There is obvious merit in following an empirical process in choosing a criterion test, taking into account the test's relationship to reading outcomes measured even further in the future (e.g., Grade 3). Of the three potential criterion tests included in this database, the SAT was the strongest predictor of future reading (Grade 3 FCAT). This result can be explained by the similarity of the SAT and FCAT in assessing a broader range of reading skills relative to those measured by ORF Reading Aloud. Based on this result, we recommend that, where possible, schools select a first–grade criterion measure through an empirical process (i.e., selecting as the first–grade criterion test one that best predicts performance on a reading test administered in later grades).
Schools that use the DIBELS system have a convenient end–of–year criterion test—spring ORF. However, before making ORF the default criterion test for first–grade reading outcomes, several considerations are relevant. First, Deno developed CBM Reading Aloud to provide teachers with a brief procedure they could use to repeatedly monitor students’ progress. Reading Aloud was intended as a proxy for a more comprehensive reading assessment, not as a criterion test of reading ability (Deno, 1985; Fuchs, Fuchs, Hosp, & Jenkins, 2001). Second, Reschly, Busch, Deno, and Long's (2008) meta–analysis of Reading Aloud found that words read correctly correlates. 70 with concurrently administered reading tests, meaning that ORF accounts for approximately half of the variance in skills measured by broader reading tests. Finally, reading researchers outside of special education strongly caution against what they regard as an overreliance on ORF. They believe ORF inadequately represents broader reading ability (as evidenced by its. 70 correlation with broader tests) and that teachers may narrow instruction inappropriately if they adopt ORF as their benchmark (Paris, 2005; Pearson, 2006; Samuels, 2007).
Dibels’ Classification Accuracy
In evaluating screens, the base rate of the predicted condition (e.g., poor reading outcomes) is an important consideration in judging a screen's overall classification accuracy (Wilson & Reichmuth, 1985). Specifically, focusing on a screen's overall classification accuracy can be misleading when the base rate of the predicted condition occurs in a relatively small percentage of the overall population. In such situations, a relatively high overall accuracy can be obtained by skipping screening altogether and assuming that no individuals will experience the predicted condition. To be efficient, a screening measure must result in a higher number of correct classification decisions than could be obtained in terms of base rate alone (Meehl & Rosen, 1955). Our results bring this point home in a strong way. In Florida, the overall classification accuracy that would have been obtained by skipping screening altogether was 71.4 percent. Using the best kindergarten screen (NWF) improved classification accuracy by only 4 percent (to 75.4 percent) over no screening; and using the best first–grade screen (ORF) improved classification accuracy to only 76.9 percent. Moreover, these rather modest classification accuracies were obtained by using statistically optimal cut points, which resulted in identifying only 38 percent and 52 percent of the truly at–risk students in kindergarten and first grade, respectively. When we lowered the criterion defining successful reading outcomes (≥20th percentile on the SAT), none of the DIBELS screens yielded better classification accuracy (i.e., the screens produced 0 percent sensitivity) than would have been achieved by skipping screening altogether and assuming that no students were at risk.
Thus, rather than focusing on overall classification accuracy, we instead concentrated on sensitivity and specificity, statistics that are unaffected by base rates. In an RTI model, screening is a purposeful activity—its first job is to identify all or nearly all students at risk for poor future outcomes. This led us to select cut points that resulted in 90 percent sensitivity, as opposed to adopting a statistical optimizing procedure (e.g., logistic regression) that produces unacceptable levels of sensitivity. Holding sensitivity constant at 90 percent allowed us to compare the relative accuracy of screening measures according to their level of overprediction or specificity. We found poor specificity for all screens; 38 percent was the highest specificity for a kindergarten screen (NWF) and 59 percent was the highest for a Grade 1 screen (ORF). Specificity was somewhat better when unsatisfactory reading was defined as a SAT score below the 20th percentile (47 percent and 65 percent for kindergarten NWF and first–grade ORF, respectively).
We found that NWF was the most accurate kindergarten screen and ORF was the most accurate first–grade screen when compared to the other DIBELS subtests. The latter is somewhat surprising because DIBELS generally recommends using NWF instead of ORF in fall of first grade. Our finding of better accuracy for ORF than NWF is consistent with Riedel (2007).
Perhaps the most remarkable finding of this research is the large percentage of students that the screens would have to identify as at risk (69 percent for spring K–NWF and 52 percent for Grade 1 ORF) in order to identify most (90 percent) of the students who are truly at risk (SAT <40th percentile). When we compared these results to those obtained by using published DIBELS cut scores associated with the three levels of risk categories (at risk, some risk, low risk), the results were 254 false negatives, 611 false positives, and 5,219 students in the “some risk” category, students for whom ORF provides little utility in making decisions about whether to provide intervention. A dichotomous classification scheme appears to have greater predictive utility, although, regardless of approaches to classification, substantial numbers of students in this database remain inaccurately classified.
Combining Screens to Reduce False Positives
Endeavoring to use a single screen to measure all or even most of the important individual differences that contribute to reading acquisition is probably futile. Some researchers have advocated screening batteries that combine two or more screens. For example, Compton et al. (2006), Davis et al. (2007), Jenkins et al. (2007), and Riedel (2007) recommend including a vocabulary or comprehension measure in the screening battery. We reasoned that PPVT tapped a construct different from other DIBELS measures, so it could potentially add to the accuracy of ORF. However, our attempt to reduce false positive rates by combining screens did not appreciably improve specificity. The largest improvement (a 2 percent increase in specificity) was achieved by combining kindergarten PPVT and first–grade ORF as screens. In practical terms, an increase in specificity of this size means that a school enrolling 60 first–graders would identify one fewer false positive by adding a PPVT screen to ORF—too small an improvement to justify the added cost of PPVT screening. Although we were unsuccessful in improving accuracy by using multiple screens, other potential screening tools warrant consideration. For example, measures of expressive and receptive vocabulary, sentence imitation, story recall, working memory, and attention may have predictive value in forecasting reading problems (Catts, Fey, Zhang, & Tomblin, 2001; MaCardle, Scarborough, & Catts, 2001; Scarborough, 1998), especially in a multiple–gating framework like those used to identify students at risk for maladaptive behavior. With multiple gates, more time–consuming assessments are reserved for students that have been identified as potentially at risk by a general screen (e.g., ORF).
Alternatively, the use of Direct Route models for screening may not be adequate for achieving the desired outcome of identifying nearly all (90 percent) of students in need of intervention, especially when screening measures consist of very brief (<3 minutes) assessments that were never intended for use as diagnostic assessments. To date, a PM route to screening appears to hold the most promise for delivering high classification accuracy. For example, Compton et al. (2006) have demonstrated that the use of computer–aided decision rule generation employing progress monitoring with other screening measures results in classification accuracy in the range advocated by Jenkins et al. (2007). In addition, the use of PM outperformed the simple addition of another measure to a screening battery and resulted in significantly better fitting prediction models (Compton et al., 2006).
Different Cut Scores May be Needed for Different Groups
Lower cut scores were required on K–NWF and Grade 1 ORF to achieve 90 percent sensitivity for ELL and FRL subgroups. The ELL group required the lowest cut scores (four points lower than the kindergarten comparison group and five points lower than the first–grade comparison group). We take this to mean that schools should disaggregate screening results, especially for ELL students, if they are to have equal access to Tier 2 interventions. Tier 2 interventions have been shown to benefit ELL students (Gerber & Durgungoglu, 2004). Of course, adopting different cut scores for different subgroups may increase false positive rates for some groups.
In summary, this study followed a specific protocol to determine sensitivity and specificity levels, beginning with a 90 percent sensitivity level (Jenkins et al., 2007). Grade 1–Fall ORF is a fair predictor of Grade 1 Spring SAT performance, with 90 percent sensitivity and 59 percent specificity when reading failure was defined as below the 40th percentile on SAT, and 90 percent sensitivity and 65 percent specificity when defined as below the 20th percentile. An important finding is that ORF, although the most accurate screen of those examined, is at best a moderate predictor of end of Grade 1 reading achievement. When ORF cut scores are set to ensure that most truly at–risk students are identified by the screen, very high rates of overprediction result. This may be due to the floor effect of ORF in beginning Grade 1 (Catts, Petscher, Schatschneider, Sittner Bridges, & Mendoza, under review).
Four study features add to the generalizability of our results. First, the sample was extraordinarily large, numbering over 12,000 students, and represented a diverse student group drawn from over 300 schools and 30 districts. Second, measurements were collected at three time points (spring of kindergarten, and fall and spring of Grade 1) for all students, thus findings were not confounded by age group. Third, the SAT that served as the Grade 1 criterion test in this study is employed broadly across the United States. Fourth, results are relevant to current practice because the DIBELS screens and measurement schedule have been employed extensively in Reading First.
We also note methodological features that limit generalization. First, our decision to use the FCAT as the criterion for validating the SAT as the first–grade outcome reduces generalizations to Florida, and perhaps to states that use a similar standards–based criterion test. Second, we employed an extant database, meaning that the choice of screens, outcome measures, and the assessment schedule were predetermined by policy. Research that tests a broader array of screening instruments and assessment schedules is needed. Third, although our sample was large, some characteristics of the sample may limit generalizability to other samples. The percentage of students receiving special education services was high (21 percent), well above the average rate of 10–12 percent. Additionally, performance on the SAT for this sample of students may be higher on average than the national sample as evidenced by the lower percentage (29 percent) of students performing below the 40th percentile on the SAT. Finally, it is important to emphasize that our results are relevant to screening, not to progress measurement. The DIBELS’ focus on phonemic, word reading, and reading aloud skills that mark reading acquisition makes them useful for teachers seeking to measure children's weekly and monthly progress.
Conclusion
This research highlights the need to improve current approaches to determining who is at risk for reading failure. Frameworks to evaluate and monitor screening procedures can provide the necessary feedback to improve and adjust screening procedures (Glover & Albers, 2007; Jenkins, 2003). Because screening in an RTI framework leads to important consequences for students, screening procedures must be accurate in the classification of students as at risk or not at risk for reading difficulties, especially for schools employing a Direct Route approach to screening and intervention. The most significant limitation with the screening tools examined in this study is their lack of precision, the kind of precision needed to identify most of the truly at–risk students without also overidentifying very large numbers of students who are truly not at risk.