
Abstract
This longitudinal study investigated the academic and cognitive characteristics of persistent mathematics difficulty (MD–p) from first to fourth grade. Ninety–nine children were retrospectively categorized into one of three groups: MD–p, transient mathematics difficulty (MD–t), or typically developing. MD–p was defined as persistently low mathematics achievement (≤25th percentile) in at least 2 years from first to fourth grade. The results indicated that the MD–p group was more likely than other groups to have deficits in calculation, practical problem solving, number facts, and reading. In terms of cognitive characteristics, MD–p was specifically characterized by deficits in math concepts and phonological decoding, though there was some evidence for the involvement of working memory, processing speed, and numerical reasoning.
In this study, we focus on the academic and cognitive characteristics of children with mathematics difficulty (MD), particularly those with persistent MD (MD–p). This issue is a priority shared by researchers and practitioners alike. MD can have serious consequences on job performance, employability, and daily living; many aspects of daily life and work are based on mathematics skills, including budgeting, planning and following schedules, routine tasks on the computer, banking, and problem solving (e.g., determining medication dosage). Yet, almost 60 percent of North American adults have mathematics skills below levels considered necessary for coping with the demands of everyday life and work in an advanced society (Statistics Canada and Organization for Economic Cooperation and Development (OECD), 2005). In turn, adults with the poorest mathematics skills are more likely to be unemployed, obtain social assistance payments, and have health problems (Statistics Canada and OECD, 2005). Although the effects of MD are most prominent in adult life, MD typically begins in elementary school; the estimated prevalence of MD in school–age children is between 4 percent and 15 percent (Fuchs et al., 2005; Mazzocco & Myers, 2003).
However, the research base remains underequipped to inform efforts targeted toward students with MD. Though research addressing critical issues has begun to accumulate—such as how best to measure and define MD (e.g., Geary, Hoard, Byrd–Craven, Nugent, & Numtee, 2007; Mazzocco & Myers, 2003; Murphy, Mazzocco, Hanich, & Early, 2007), whether there are core deficits involved in MD (e.g., Fuchs et al., 2005, 2006; Swanson & Beebe–Frankenberger, 2004), and whether the mathematics skills in children with MD can be remediated (e.g., Fuchs et al., 2005; Fuchs et al., 2008; Powell et al., 2009)—many questions remain unanswered, including the characteristics of MD, which has implications for early identification and intervention.
One of the more important developments has occurred in the area of MD identification, where emerging evidence supports the need to define MD with persistently low mathematics achievement because approximately one–third of individuals who meet low achievement criteria for MD at any one time do not maintain low achievement over time (Mazzocco & Myers, 2003; Silver, Pennett, Black, Fair, & Balise, 1999). Unfortunately, most of the research base on MD has been informed by studies that have not distinguished between MD–p and transient MD (MD–t)—where MD occurs in only 1 year—and this limits the conclusions and clinical recommendations that can be made regarding MD. The purpose of this study was to examine the academic and cognitive characteristics of MD–p from first through fourth grade in order to determine how MD–p differs from MD–t and from typical developers. Such an analysis is necessary for reliable MD identification, especially given that practitioners may not have longitudinal data available to discern between MD–p and MD–t.
Before reviewing the cognitive and academic characteristics of MD, it is important to briefly address our use of the term MD so that this study can be placed appropriately. Mathematics disability, mathematics difficulty, nonverbal learning disability, and arithmetic disability are among the terms used to describe disorders of mathematics. Despite differences in terminology, it is clear that researchers are targeting students struggling with mathematics. However, researchers differ in the cut score used to identify struggling learners and in how to interpret cut scores. Regarding cut score selection, the field lacks consensus on the specific cut score used to demarcate struggling from typical learners. For example, Powell et al. (2009) use the 25th percentile, Fuchs, et al. (2008) use one standard deviation below the mean (∼15th percentile), and Jordan, Hanich, and Kaplan (2003) use the 35th percentile. Regarding cut–score interpretation, some researchers have attempted to distinguish between mathematics difficulty and disability on the basis of strict or lenient cut scores. That is, Chong and Siegel (2008), Geary, Hoard, Nugent, and Byrd–Craven (2008), and Murphy et al. (2007) used the 10th percentile to demarcate disability and between the 11th and 25th percentile to indicate difficulty; Geary et al. (2007) used the 15th percentile as the strict criterion and scores between the 16th and 25th percentile as the lenient criterion.
What has been absent from the literature regarding the selection and interpretation of cut scores is an explicit discussion that determining a cut score on a continuous distribution is necessarily arbitrary. That is, creating discrete categories based on a continuous distribution requires clinical judgment and will result in imperfect classifications, especially for cases that fall around the cut score. It is also important to consider that in practice it is very difficult to determine whether learning problems reflect difficulties or disabilities, especially on the sole basis of cut scores. Thus, it is common in the broader learning disabilities field to refer to struggling learners as a group that includes both those with learning disabilities and learning difficulties with the understanding that the current state of knowledge is not sophisticated enough to distinguish between the two on the basis of cut scores alone. As the purpose of this study was to investigate the cognitive and academic characteristics of MD as opposed to distinguishing between difficulty and disability, we purposely used the term mathematics difficulty and elected to use the 25th percentile as our cut score, which is consistent with current conceptualizations of learning disabilities, based on over three decades of research (Fuchs et al., 2005; Fuchs, Fuchs, & Prentice, 2004; Lyon et al., 2001).
Cognitive Characteristics of MD
Several cognitive systems have been implicated in MD, including working memory, short–term memory, visual–spatial abilities, processing speed, mathematics background knowledge, and phonological processing. Although few studies have distinguished MD–p from MD–t, some preliminary findings suggest that MD–t groups may be more similar to typical developers than to children with MD–p (e.g., Geary, 1990; Geary, Brown, & Samaranayake, 1991; Mazzocco & Myers, 2003). Yet, more research is necessary to clarify the nature of both MD–p and MD–t.
Working Memory
Working memory has been identified as an important component of an early MD screening battery (Gersten, Jordan, & Flojo, 2005), and there is considerable evidence that MD is associated with reduced working memory performance, particularly the central executive component of the working memory system (e.g., Bull, Espy, & Wiebe, 2008; Geary, Hamson, & Hoard, 2000; Geary et al., 2007; Passolunghi & Siegel, 2001, 2004; Siegel & Ryan, 1989; Swanson & Beebe–Frankenberger, 2004). However, findings are not consistent. For example, although Fuchs et al. (2005) found that working memory was important for mathematics achievement in first grade, Fuchs et al. (2006) demonstrated that working memory was not a significant path to mathematics performance at third grade, suggesting that working memory may lose its influence over time. There is emerging evidence that, from kindergarten through third grade, children with MD–p are characterized by working memory deficits (Geary et al., 1991, 2000, 2007; Murphy et al., 2007). More longitudinal studies are needed to determine how working memory is involved in MD–p, particularly beyond the early grades.
Short–Term Memory
Research on short–term memory processes and MD is less clear. Some work supports a short–term memory deficit in children with MD (e.g., Swanson & Beebe–Frankenberger, 2004), other research suggests that children with MD may have short–term memory deficits specifically for numerical information (Passolunghi & Siegel, 2001), and still other studies have not found differences on short–term memory between children with MD and typical developers (e.g., Bull & Johnston, 1997; Landerl, Bevan, & Butterworth, 2004). The few studies that have specifically examined short–term memory in MD–p groups have found that short–term memory deficits characterize MD–p in first and second grade (Geary et al., 1991, 2000, 2007). As with working memory, additional longitudinal research is needed to examine whether short–term memory processes contribute to MD–p beyond these early years.
Visual–Spatial Abilities
Visual–spatial abilities refer to the cognitive ability to perceive, analyze, and think with visual–spatial information. The evidence for the role of visual–spatial processes in MD is mixed. Some early research suggested that children with MD who had intact reading abilities showed visual–spatial deficits (e.g., Rourke, 1993; Rourke & Conway, 1997) whereas other studies showed that visual–spatial deficits characterized MD with or without reading deficits (e.g., Shafrir & Siegel, 1994; Share, Moffitt, & Silva, 1988). Still other research has found limited evidence of visual–spatial deficits in MD (e.g., Jordan, Levine, & Huttenlocher, 1995). With respect to MD–p specifically, Geary et al. (2000) found that children with MD–p and typical developers did not differ on measures of visual–spatial skills at second grade. In contrast, Murphy et al. (2007) found that visual–spatial deficits characterized MD–p from kindergarten to third grade. More longitudinal research is needed to clarify how visual–spatial processes are involved in MD–p, particularly beyond third grade.
Processing Speed
Processing speed refers to the cognitive ability to process relatively simple information quickly and with ease. In his synthesis of the literature, Geary (1993) suggested that processing speed may represent a unique source of difficulty for children with MD because these children tend to perform mathematics problems more slowly than typically developing children. Children with MD have been found to perform more slowly than typical developers on measures of processing speed (Bull & Johnston, 1997; Swanson & Beebe–Frankenberger, 2004). With respect to MD–p specifically, Geary et al. (2007) found that the MD–p group performed more slowly than typical developers on measures of rapid naming in first but not second grade. Similarly, Murphy et al. (2007) found that the MD–p group performed more slowly than typical developers on rapid naming tasks in kindergarten and first grade, but not second or third grade. These findings suggest that processing speed may have a developmentally limited influence on MD. More longitudinal research is needed to determine how processing speed is involved in MD–p.
Mathematics Background Knowledge
Mathematics background knowledge represents the breadth and depth of general mathematics knowledge, including skills such as counting (e.g., oral counting, counting objects, counting knowledge), number identification, quantity discrimination (which of two numbers is larger), and quantitative vocabulary (e.g., largest, smallest, first, last). Just as general background knowledge is important for reading, so too is mathematics background knowledge important for mathematics achievement (e.g., Gersten et al., 2005; Ginsburg, 1997). In general, children with MD tend to be characterized by deficits in mathematics background knowledge (Geary et al., 2000; Hanich, Jordan, Kaplan, & Dick, 2001; Jordan & Hanich, 2000). Specific to MD–p, Murphy et al. (2007) found that first– and second–graders with MD–p performed at a lower level than typical developers on measures of counting knowledge. Given that mathematics background knowledge has particular utility for early identification, more research is needed, particularly longitudinal research, to determine how mathematics background knowledge is involved in MD–p over time.
Phonological Processing
Phonological processing refers to one's understanding of the sound structure of the language. Many children who have MD also have reading difficulties (e.g., Badian, 1983; Siegel & Ryan, 1989). Thus, it has been suggested that phonological processes, which are strongly related to reading development, may also be involved in MD (Geary, 1993). Few studies have examined the relationship between phonological processing deficits and MD generally or MD–p specifically. Murphy et al. (2007) found that on word attack, a measure of nonword reading that taps phonological decoding, the MD–p group performed at a lower level than typical developers from kindergarten to third grade. These findings are consistent with Hecht, Torgesen, Wagner, and Rashotte (2001), who found that phonological processes were related to growth in calculation skills from second to fifth grade, and Fuchs et al. (2005) who found that phonological processing was a unique predictor of arithmetic fluency in first grade. By contrast, Fuchs et al. (2006) did not find a relationship between phonological processes and calculation skills at third grade. Thus, more longitudinal studies are needed to examine how phonological processes are involved in MD–p over time.
Academic Characteristics of MD
In gaining a comprehensive understanding of MD–p, it is important to consider academic characteristics. As with the research on cognitive processes and MD, although previous research has examined the mathematics skills of students with MD, most studies have not distinguished MD–p from MD–t. There is much evidence that individuals with MD struggle with calculation skills (e.g., Geary et al., 2000; Hanich et al., 2001; Jordan & Hanich, 2000; Jordan, Hanich, & Kaplan, 2003; Jordan, Kaplan, & Hanich, 2002), mathematics problem solving (e.g., Fuchs & Fuchs, 2002; Fuchs et al., 2004; Hanich et al., 2001; Jordan et al., 2002, 2003; Jordan & Hanich, 2000), and number facts (Chong & Siegel, 2008; Geary, 1993; Jordan, 1995). However, it is not clear specifically how MD–p differs from typical developers or MD–t over time across these skills.
Furthermore, studies have not yet specifically focused on the reading profiles of MD–p despite research indicating that reading problems often co–occur with MD (e.g., Fuchs et al., 2004; Jordan et al., 2002). For example, Badian (1983) found that 43 percent of children with MD also had low reading skills and that 56 percent of students with reading disability (RD) had poor mathematics achievement. Thus, investigating the reading profiles of MD–p groups is warranted.
Rationale for this Study
The purpose of this longitudinal study was to understand the unique characteristics of MD–p from first through fourth grade. Previous research has not typically considered persistence of MD designation over time; the longitudinal design of our study allowed us to use persistently low mathematics achievement in defining MD. We used the Arithmetic subtest of the Wide Range Achievement Test–3rd edition (WRAT–3; Wilkinson, 1993) as our measure of mathematics achievement. This test assesses formal calculation skills as well as informal mathematics ability in the early school years; this is consistent with recent research suggesting that assessment of informal and formal mathematics ability in the early school years results in a more reliable MD classification than relying solely on formal mathematics abilities (Fuchs et al., 2005; Mazzocco & Myers, 2003). Thus, the longitudinal design of this study allowed us to retrospectively identify MD–p (when children demonstrated low performance on the WRAT–3 in 2 or more years from first through fourth grade), MD–t (when children demonstrated low achievement on the WRAT–3 in only 1 year), and typical developers (when children did not demonstrate low achievement on the WRAT–3 in any year). A particular strength of this study is that we included a comprehensive battery of academic and cognitive tasks and had a relatively large sample size for a 4–year longitudinal study. In this way we were able to conduct a comprehensive analysis of the academic and cognitive characteristics of MD–p. This study was guided by two research questions: (1) What academic skills characterize MD–p from first through fourth grade? (2) What cognitive processes distinguish MD–p from MD–t and typical developers?
Method
Participants
This 4–year longitudinal study occurred within a family of five elementary schools in a diverse district in a port city on the west coast of Canada; the schools were located primarily in working–class neighborhoods characterized by high concentrations of rental housing and high mobility rates (43–67 percent mobility rate). In the year the study began, consent forms were distributed to all eligible first–grade children attending these schools; to be eligible for participation children had to be English language proficient (determined by schools) and could not have severe cognitive deficits. In total, 164 (∼95 percent) consent forms were returned. Of these children, only 85 remained in the study for all 4 years; this attrition rate was not surprising given that this study was conducted over 4 years in transient neighborhoods in a port city.
Given the purpose of the study, it was important to include as many cases as possible per grade; though 85 children remained in the study for all 4 years, 99 remained in the study for 3 of 4 years, and 124 were available in two grades. Thus, in this study, we selected the 99 children (53 girls and 46 boys) who participated at least 3 of 4 years from first to fourth grade. The children were 64.9 percent majority culture, 16.5 percent First Nations (Canadian indigenous people), 9.3 percent Middle Eastern, 5.2 percent Asian, and 4.1 percent other. In first grade the children (n = 99) were in 14 classrooms; in second grade the children (n = 85) were in 13 classrooms; in third grade the children (n = 99) were in 10 classrooms; and in fourth grade the children (n = 99) were in 11 classrooms. The mathematics instruction in the district is fairly uniform across classrooms and based on the provincial curriculum. Information is not available on performance in math class, retention rates, or presence of high incidence disabilities. There were no differences on grade 1 measures between the longitudinal sample and the children lost due to attrition. In addition, there were no gender or group background differences on the measures used in the study. Given the lack of such differences, these variables were not considered further.
Classification Scheme
Children were classified into one of three groups: MD–p, MD–t, or typically developing. Consistent with current conceptualizations of learning disabilities (e.g., Fuchs et al., 2004, 2005; Lyon et al., 2001), MD was defined as performance below the 25th percentile on the arithmetic subtest of WRAT–3 (Wilkinson, 1993). MD–p was assigned when children met the criterion for MD in at least 2 years from first through fourth grade. Typically developing was defined as performance at or above the 40th percentile in all years from first through fourth grade. MD–t was assigned to all other children, that is, either when children met the criterion for MD in only 1 year from first through fourth grade or if performance fell in the borderline range. Based on this classification scheme, 46 children (46.5 percent) were categorized as typically developing, 26 as MD–p (26.3 percent), and 27 as MD–t (27.3 percent). It is worth noting that, of the 27 children in the MD–t group, 25 demonstrated MD in 1 year and 2 children did not meet criteria for MD in any year, though these two children did not perform above the 33rd percentile in any year, thus confirming that the MD–t group did indeed represent a group of children with borderline mathematics skills.
Materials
Mathematics Achievement
Overall mathematics achievement was assessed with the WRAT–3 Arithmetic subtest: Blue form (Wilkinson, 1993), which assesses children's informal and formal mathematics skills. Informal skills include counting objects, indicating which of two numbers is larger in magnitude, and providing oral responses to verbally presented arithmetic questions. Formal skills include written calculation problems of increasing difficulty. The WRAT–3 was used because the WRAT–4 was not available at the onset of the study. The WRAT–3 was administered in all grades. Reliability is. 80–.86 for the ages of the children in the study.
Calculation Skills
Calculation skills were assessed with the Calculation test of the Woodcock Johnson–III Tests of Achievement (WJ–III): Research Edition (Woodcock, McGrew, & Mather, 1999). With this task, children complete a series of written calculation problems of increasing difficulty (e.g., 1 + 2 =__). Questions are presented either in horizontal or vertical format and are not read to the children. This test was group administered in all grades. It is worth noting that group administration breaks standardization procedures, which may mean that scores are not an accurate reflection of participants’ capabilities; however, consistent with standards for assessment, we followed standardized administration otherwise and only elected to use group administration when it did not change the construct under investigation (see American Educational Research Association, American Psychological Association, & National Council on Measures in Education, 1999 for discussion of this standard). Reliability is. 80–.96 for the ages of the children in the study.
Practical Problem Solving
Practical mathematical problem solving was assessed with the Applied Problems test of the WJ–III: Research Edition (Woodcock et al., 1999) in which children solve practical problems in mathematics by deciding on the appropriate mathematical operation to use (e.g., Maggie had $6. She bought a kite for $3.35 and a pencil for $1.05. How much money did she have left?). Experimenters read the questions aloud while the children follow along on the page. Children completed this test in all grades. Reliability is. 88–.93 for the ages of the children in the study.
Number Facts
Mastery of number facts was assessed through the Math Fluency test of the WJ–III: Form B (Woodcock, McGrew, & Mather, 2001), which requires completion of simple single–digit addition, subtraction, and multiplication facts within 3 minutes. Children are instructed to complete the questions they know automatically and to skip questions that they do not know. This test was group administered in grades 2 through 4; the same caveat as discussed with Calculation applies. Reliability is. 66–.81.
Word Reading
Reading ability was measured using the Letter–Word Identification (LWID) test of the WJ–III: Research Edition (Woodcock et al., 1999), which requires children to identify and pronounce isolated letters (e.g., g, r) and words of increasing difficulty (e.g., cat, palm). This task was administered in all grades. Reliability is. 94–.98 for the ages of the children in the study.
Reading Comprehension
The Reading Comprehension test of the Stanford Diagnostic Reading Test (SDRT; Karlsen & Gardner, 1994) was used to assess reading comprehension. With this task children read short passages in a booklet and answer multiple–choice questions about the passage. This task was administered in grades 2 through 4. Reliability is. 91–.93.
Spelling
Spelling ability was assessed with the WRAT–3 Spelling subtest: Blue form (Wilkinson, 1993). With this task children write letters and words from dictation. This task was administered in all grades. Reliability is. 83–.89 for the ages of the children in the study.
Cognitive Processes
Working Memory
Working memory was assessed through a standard cognitive psychology task, the counting span task (Case, Kurland, & Goldberg, 1982; Siegel & Ryan, 1989), which is based on the working memory task created by Daneman and Carpenter (1980). A hallmark of working memory tasks is that they require the simultaneous processing and storage of information. The counting span task involves counting the yellow dots from a field of blue and yellow dots arranged in an irregular pattern on an index card. The child counts aloud the yellow dots on each card in a trial (processing demand) and recalls the numbers counted at the end of the trial (storage demand). There are three trials at each span length (i.e., span length of 2, 3, 4, and 5). The number of yellow dots on each card varies from one to nine. The task is discontinued when the child misses all of the trials in a set. This test was administered in all grades. Reliability for the working memory numbers test was. 71–.74.
Short–Term Memory
Short–term memory was assessed with the Forward Digit Span portion of the Digit Span test (Wechsler Intelligence Scale for Children–Third Edition [WISC–3]; Wechsler, 1991). With this task children listen to a series of digits then repeat the numbers in the same order. Children receive two trials at each span length. Forward Digit Span was administered in all grades. Reliability is. 79–.84 for the ages of the children in the study.
Visual–Spatial Abilities
Visual–spatial abilities were assessed with the Block Rotation test of the WJ–III: Diagnostic Supplement (Woodcock et al., 2001). In this task children select two of five items that represent a stimulus object that has been rotated in a three–dimensional space. This test was administered in all grades. Reliability is reported in the range of. 77–.84 for the ages of the children in the study.
Processing Speed
Processing speed was assessed with a rapid number naming task (Denckla & Rudel, 1974) in which children identify individual numbers (1–9) presented in random order on a 5 × 5 array. The primary measure of interest is the time taken in seconds to name all the numbers on the page. The rapid naming task was administered in all grades. It is worth noting that rapid naming tasks as a measure of processing speed is consistent with the Cattell–Horn–Carroll theory of cognitive abilities, one of the most comprehensive and empirically supported frameworks available for understanding the structure of human cognitive abilities (Mather & Woodcock, 2001; McGrew, Flanagan, Keith, & Vanderwood, 1997).
Mathematics Background Knowledge
Mathematics background knowledge was assessed with the Quantitative Concepts subtest of the WJ–III: Form A (Woodcock et al., 2001). There are two components to this task: concepts and number series. In concepts, students count, identify numbers and concepts such as “first” and “last”, and identify mathematics terms and formulas (e.g., children are asked what an addition symbol means). In number series students determine the next number in a series (e.g., 6, 7, 8, __). Number series can be considered an indicator of numerical reasoning (Taub, Floyd, Keith, & McGrew, 2008). Children completed concepts and number series in all grades. Reliability is. 86–.92 for the ages of the children in the study.
Phonological Abilities
Phonological abilities were assessed with the Word Attack test of the WJ–III: Form B (Woodcock et al., 2001). This test of phonological decoding requires children to pronounce pseudowords that conform to English spelling rules (e.g., flib, bungic). This test was administered in all grades. Reliability is. 89–.94.
Procedure
Annual assessments of the children occurred in the winter. Children were individually assessed for all tasks except for calculation, math fluency, reading comprehension, and spelling, which were group administered in the children's classrooms. Testing time was approximately 30 minutes per child for individually administered tasks and occurred in one session; testing time was approximately 60 minutes for the group assessment and occurred in two sessions in first and second grades and in one session in third and fourth grades. Research assistants conducted the assessments in the schools. Research assistants completed an intensive 4–hour training workshop on standardized administration, which included demonstrating 100 percent accuracy during mock administrations. In addition, a school psychology doctoral student was present during data collection so that questions and coaching occurred where necessary throughout data collection.
Results
Our results are organized according to our two research questions. The first question examined which academic skills characterized the groups; to answer this question we conducted a series of one–way analyses of variance (ANOVAs) and chi–square analyses. In the second research question we used discriminant function analyses to determine the cognitive processes that differentiated the groups. It is important to note that we used these techniques as opposed to growth curves or repeated measures because we were interested in identifying distinguishing characteristics at each grade, as opposed to understanding change and growth over time.
What Academic Skills Characterize MD–p from First through Fourth Grade?
Anovas
We conducted a series of ANOVAs to compare MD–p to MD–t and typical developers. The Bonferroni correction factor was applied, resulting in a corrected alpha of p =. 01 in first grade and p =. 008 in second through fourth grade. Eta squared (η2) was used as a measure of effect size. Significant group differences were followed up with Scheffé post hoc tests. Table 1 displays the mean scores and the results of the post hoc analyses.
Means, Standard Deviations, and Post Hoc Analyses across Academic Measures
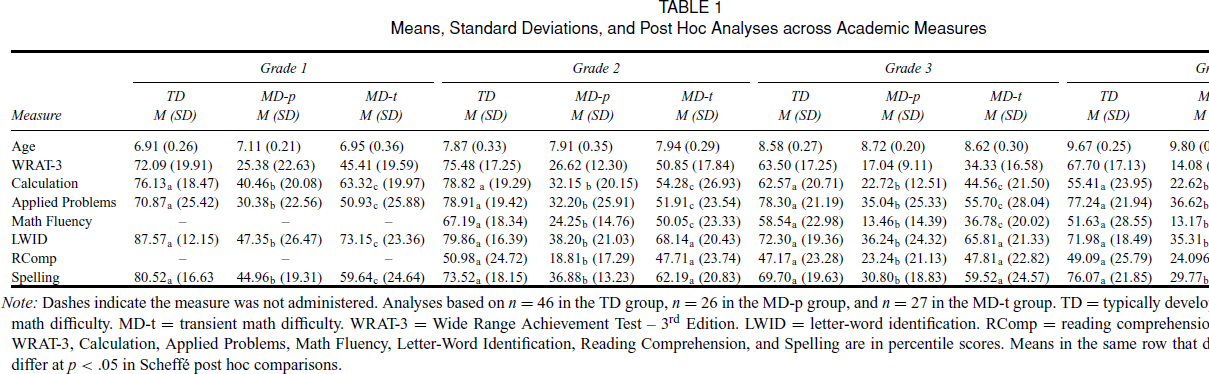
Note: Dashes indicate the measure was not administered. Analyses based on n = 46 in the TD group, n = 26 in the MD–p group, and n = 27 in the MD–t group. TD = typically developing. MD–p = persistent math difficulty. MD–t = transient math difficulty. WRAT–3 = Wide Range Achievement Test – 3rd Edition. LWID = letter–word identification. RComp = reading comprehension. Results presented for WRAT–3, Calculation, Applied Problems, Math Fluency, Letter–Word Identification, Reading Comprehension, and Spelling are in percentile scores. Means in the same row that does not share subscripts differ at p <. 05 in Scheffé post hoc comparisons.
In first grade, significant group differences emerged on calculation, F(2, 94) = 28.38, p <. 001, η2=. 38, and applied problems, F(2, 96) = 22.52, p <. 001, η2=. 32. The groups also differed significantly on word reading, F(2, 96) = 33.63, p <. 001, η2=. 41, and spelling, F(2, 92) = 28.07, p <. 001, η2=. 61.
In second grade, the groups differed significantly on calculation, F(2, 68) = 25.39, p <. 001, η2=. 43; applied problems, F(2, 83) = 32.53, p <. 001, η2=. 44; and number facts, F(2, 76) = 29.64, p <. 001, η2=. 44. On reading skills, the groups differed significantly on word reading, F(2, 83) = 34.53, p <. 001, η2=. 45; spelling, F(2, 76) = 23.87, p <. 001, η2=. 63; and reading comprehension, F(2, 76) = 11.61, p <. 001, η2=. 31.
In third grade, significant group differences were found on calculation, F(2, 95) = 35.25, p <. 001, η2=. 43; applied problems, F(2, 95) = 26.60, p <. 001, η2=. 36; and number facts, F(2, 95) = 40.75, p <. 001, η2=. 46. On measures of reading, the groups differed significantly on word reading, F(2, 95) = 11.72, p <. 001, η2=. 34; spelling, F(2, 95) = 28.31, p <. 001, η2=. 60; and reading comprehension, F(2, 95) = 10.63, p <. 001, η2=. 22.
In fourth grade, significant group differences emerged on calculation, F(2, 96) = 20.35, p <. 001, η2=. 30; applied problems, F(2, 96) = 25.44, p <. 001, η2=. 35; and number facts, F(2, 96) = 22.47, p <. 001, η2=. 32. On reading skills, the groups differed significantly on word reading, F(2, 96) = 23.37, p <. 001, η2=. 33; spelling, F(2, 96) = 37.13, p <. 001, η2=. 77; and reading comprehension, F(2, 96) = 8.14, p =. 001, η2=. 17.
Chi–Square Analyses
Despite the significant group differences on measures of mathematics and reading achievement in each grade, the MD–p group did not necessarily perform in the below–average range across these measures, especially in first and second grade. To more systematically examine whether academic deficits characterized the MD–p group more frequently than the other groups, chi–square analyses were conducted. Children's performance was dummy coded into deficit (i.e., below the 25th percentile) or no–deficit (i.e., above the 26th percentile) on: calculation, applied problems, math fluency, LWID, spelling, and reading comprehension. It is worth noting that, although researchers typically select the 40th percentile to designate average performance, an assumption for conducting chi–square analyses is that all observations are included in the analyses. Excluding observations between the 25th and 40th percentile would not only have invalidated the test but also would have resulted in a greater likelihood of finding statistically significant results. Thus, the 26th percentile was selected as the cut point for no–deficit so that all observations were accounted for and the results were not artificially inflated.
The results are presented in Table 2. The chi–square analyses were significant for all mathematics achievement measures: first grade calculation, χ2(2, n = 97) = 10.39, p =. 006; second grade calculation, χ2(2, n = 71) = 19.23, p <. 001; third grade calculation, χ2(2, n = 98) = 21.48, p <. 001; fourth grade calculation, χ2(2, n = 99) = 16.69, p <. 001; first grade applied problems, χ2(2, n = 99) = 16.09, p <. 001; second grade applied problems, χ2(2, n = 86) = 26.84, p <. 001; third grade applied problems, χ2(2, n = 98) = 15.13, p <. 001; fourth grade applied problems, χ2(2, n = 99) = 6.05, p <. 05; second grade math fluency, χ2(2, n = 79) = 24.55, p <. 001; third grade math fluency, χ2(2, n = 98) = 54.23, p <. 001; and fourth grade math fluency, χ2(2, n = 99) = 24.70, p <. 001.
Chi–Square and Odds Ratios of Likelihood of Academic Deficits in MD–p
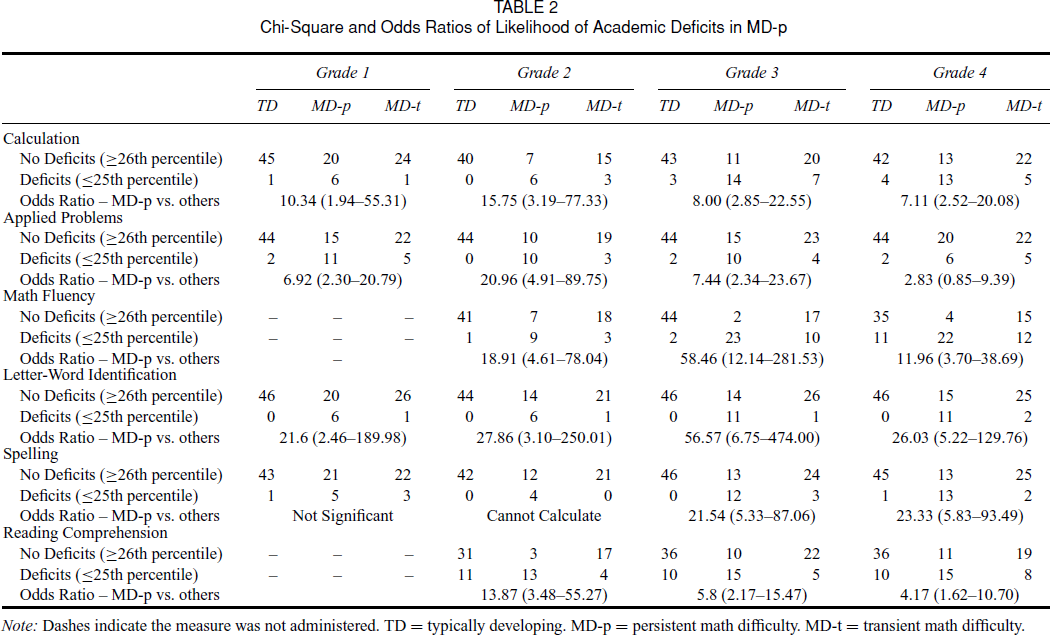
Note: Dashes indicate the measure was not administered. TD = typically developing. MD–p = persistent math difficulty. MD–t = transient math difficulty.
The chi–square analyses were also significant for all measures of reading achievement except for first grade spelling, χ2(2, n = 95) = 5.73, p = ns. First grade LWID, χ2(2, n = 99) = 14.10, p =. 001; second grade LWID, χ2(2, n = 86) = 17.06, p <. 001; third grade LWID, χ2(2, n = 98) = 31.71, p <. 001; fourth grade LWID, χ2(2, n = 99) = 27.13, p <. 001; second grade spelling, χ2(2, n = 79) = 16.59, p <. 001; third grade spelling, χ2(2, n = 98) = 29.29, p <. 001; fourth grade spelling, χ2(2, n = 99) = 30.14, p <. 001; second grade reading comprehension, χ2(2, n = 79) = 18.71, p <. 001; third grade reading comprehension, χ2(2, n = 98) = 13.73, p =. 001; and fourth grade reading comprehension, χ2(2, n = 99) = 9.89, p =. 007.
Table 2 also displays the odds ratios. As shown in Table 2, the MD–p group was 7.11 to 15.75 times more likely than other groups to have calculation deficits, 2.83 to 20.96 times more likely to have deficits in practical problem solving, and 11.96 to 58.46 times more likely to have deficits in knowledge of number facts. In reading skills, children with MD–p were 21.60 to 26.03 times more likely to have word reading deficits, 21.54 to 23.33 times more likely to have spelling deficits, and 4.17 to 13.87 times more likely to have reading comprehension deficits.
What First Grade Cognitive Processes Discriminate MD–p from MD–t and Typical Developers?
We performed discriminant function analyses to investigate whether performance on the cognitive processing variables in each grade predicted group membership. Table 3 presents the loading matrix of correlations between predictors and discriminant functions in each grade; loadings less than. 33 were not interpreted (Tabachnick & Fidell, 2001).
Discriminant Functions of Cognitive Processing Variables
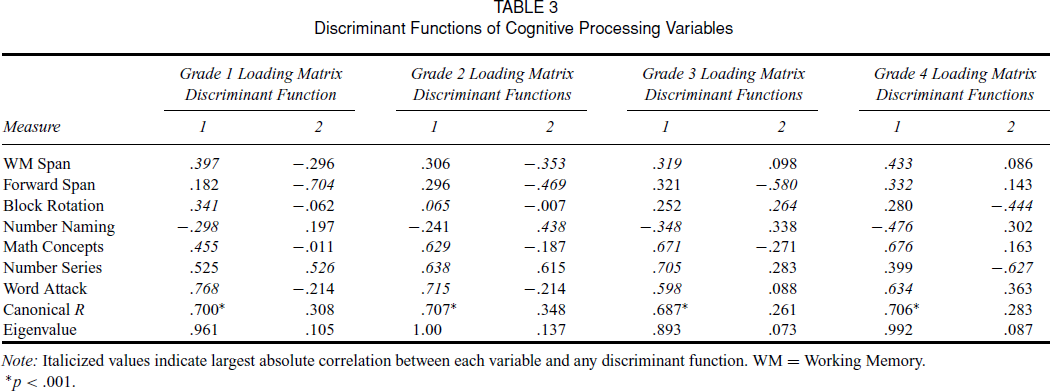
Note: Italicized values indicate largest absolute correlation between each variable and any discriminant function. WM = Working Memory.
*p <. 001.
First Grade
Two discriminant functions were calculated, χ2(14, n = 99) = 71.92, p <. 001. The second function was not significant after removal of the first function, χ2(6, n = 99) = 9.29, p = ns, meaning that only the first function showed significant association between groups and predictors. The first function accounted for 90.1 percent of the between–group variability and maximally separated MD–p from MD–t and typical developers. As shown in Table 3, the predictors that specifically separated MD–p from the other groups were word attack, math concepts, working memory, and block rotation. The MD–p group performed at a lower level on word attack (mean = 60.23, SD = 19.27) than the MD–t group (mean = 81.41, SD = 17.79) and typical developers (mean = 89.13, SD = 11.33), and knew fewer math concepts (m = 12.38, SD = 2.08) than the MD–t group (mean = 13.63, SD = 2.32) and typical developers (mean = 14.57, SD = 1.83). The MD–p group also had a smaller working memory span (mean = 2.15, SD = 0.77) than the MD–t group (mean = 2.78, SD = 0.80) and typical developers (mean = 2.95, SD = 0.88), as well as lower visual–spatial ability (mean = 46.77, SD = 33.13) than the MD–t group (mean = 56.19, SD = 29.77) and typical developers (mean = 65.74, SD = 28.20).
In terms of classification, 66 (66.7 percent) of the cases were correctly classified, compared to 35.60 (36 percent) that would be correctly classified by chance alone. The typically developing group (80.4 percent correct classifications) and the MD–p group (73.1 percent correct classifications) were more likely to be correctly classified than the MD–t group (37 percent correctly classified). Misclassifications of typical and MD–p tended to fall into the MD–t group (15.2 percent and 23.1 percent incorrect classifications, respectively), whereas MD–t classification errors tended to fall into the typically developing group (48.1 percent incorrect classifications).
Second Grade
Two discriminant functions were calculated, χ2(14, n = 86) = 65.75, p <. 001, but only the first function significantly separated the MD–p from the other groups [second function χ2(6, n = 86) = 10.30, p = ns]. The first function accounted for 87.9 percent of the between–group variability. The predictors that maximally separated MD–p from the other groups were word attack, number series, and math concepts. The MD–p group performed at a lower level on word attack (mean = 46.70, SD = 20.02) than the MD–t group (mean = 73.50, SD = 18.55) and the typical group (mean = 79.48, SD = 13.91), knew fewer math concepts (mean = 14.10, SD = 1.62) than the MD–t group (mean = 16.14, SD = 1.52) and the typical group (mean = 16.70, SD = 1.79), and performed at a lower level on number series (mean = 8.90, SD = 1.33) than the MD–t group (mean = 9.86, SD = 2.15) and the typical group (mean = 11.64, SD = 1.70).
In terms of classification, 65 (75.6 percent) of the cases were correctly classified, compared to 32.82 (38 percent) that would be correctly classified by chance alone. Students were more likely to be correctly classified in the typically developing (90.9 percent correct classifications) and the MD–p groups (80.0 percent correct classifications) than in the MD–t group (40.9 percent correctly classified). Errors in classifying typical developers (9.1 percent incorrect classification) fell into the MD–p group, whereas errors in both MD–p and MD–t classifications tended to fall into the typical group (15.0 percent and 45.5 percent incorrect classifications, respectively).
Third Grade
Two discriminant functions were calculated, χ2(14, n = 98) = 65.20, p <.001; the second function was not significant after removal of the first function, χ2(6, n = 98) = 6.47, p = ns. The first function accounted for 92.5 percent of the between group variability. As shown in Table 3, the predictors that maximally distinguished MD–p from the other groups were number series, math concepts, word attack, and number naming. The MD–p group performed at a lower level on both number series and word attack (mean = 9.48, SD = 1.85; mean = 45.64, SD = 19.86, respectively) than the MD–t group (mean = 11.22, SD = 1.53; mean = 66.19, SD = 18.13, respectively) and the typical group (mean = 12.17, SD = 1.62; mean = 73.61, SD = 17.35, respectively). The MD–p group also knew fewer math concepts (mean = 15.00, SD = 1.98) than the MD–t group (mean = 17.30, SD = 1.64) and the typical group (mean = 17.67, SD = 1.74); and performed more slowly on rapid number naming (mean = 13.36, SD = 3.74) than the MD–t group (mean = 11.19, SD = 2.53) and the typically developing group (mean = 11.22, SD = 2.32).
In terms of classification, 67 (68.4 percent) of the cases were correctly classified, compared to 35.40 (36 percent) that would be correctly classified by chance alone. Students were more likely to be correctly classified in the typically developing (87.0 percent correct classifications) and the MD–p groups (72.0 percent correct classifications) than the MD–t group (33.3 percent correctly classified). Errors in classifying typically developers (8.7 percent incorrect classification) tended to fall into the MD–t group; errors in classifying both MD–p and MD–t tended to fall into the typical group (20.0 percent and 48.1 percent incorrect classifications, respectively).
Fourth Grade
Two discriminant functions were calculated, χ2(14, n = 99) = 71.87, p <. 001 but only the first function was significant [second function χ2(6, n = 99) = 7.77, p = ns], accounting for 91.9 percent of the between–group variability. The predictors that maximally separated MD–p from MD–t and typical developers were math concepts, word attack, number naming, working memory, and short–term memory. The MD–p group knew fewer math concepts (mean = 17.19, SD = 2.87) than the MD–t group (mean = 19.67, SD = 1.07) and the typical group (mean = 20.02, SD = 1.29), performed at a lower level on word attack (mean = 42.77, SD = 17.44) than the MD–t group (mean = 66.15, SD = 15.58) and the typical group (mean = 67.35, SD = 15.58), and performed more slowly on rapid number naming (mean = 12.46, SD = 2.57) than the MD–t group (mean = 10.89, SD = 2.65) and the typical group (mean = 9.98, SD = 1.44). The MD–p group also had smaller working memory spans (mean = 2.94, SD = 0.77) than the MD–t group (mean = 3.67, SD = 0.93) and the typical group (mean = 3.78, SD = 0.81), and smaller short–term memory spans (mean = 4.54, SD = 0.95) than the MD–t group (mean = 5.24, SD = 0.94) and the typically developing group (mean = 5.29, SD = 1.04).
In terms of classification, 67 (67.7 percent) of the cases were correctly classified, compared to 35.60 (36 percent) that would be correctly classified by chance alone. Students were more likely to be correctly classified in the typical group (82.6 percent correct classifications) and the MD–p group (76.9 percent correct classifications) than the MD–t group (33.3 percent correctly classified). Errors in classifying typical developers (10.9 percent incorrect classification) tended to fall into the MD–t group, whereas errors in MD–p and MD–t classifications tended to fall into the typically developing group (15.4 percent and 59.3 percent incorrect classifications, respectively).
Discussion
Although persistently low mathematics achievement has been identified as a necessary feature in MD identification (Mazzocco & Myers, 2003), the research base on MD has been informed primarily by studies that have not included persistent mathematics deficits when defining MD. This study extended previous research by providing such an analysis. In general, our findings indicated that from first through fourth grade, children with MD–p were more likely to experience deficits on measures of mathematics and reading achievement, that there may be a group of children with late emerging MD, and that MD–p was specifically characterized by deficits in math concepts and phonological decoding.
Academic Characteristics of MD–p
Across measures of mathematics achievement, the MD–p group demonstrated the lowest performance, with the most striking differences found on mastery of number facts. This is consistent with previous literature indicating that deficient number fact knowledge is a defining feature of MD (e.g., Chong & Siegel, 2008; Geary, 1993; Jordan, 1995). Though it was not surprising that the MD–p group was the lowest–performing group across mathematics tasks, it was surprising that performance was not always in the below average range. Specifically, in first and second grade, the MD–p group did not exhibit below–average performance on either calculation or practical problem solving; calculation deficits did not characterize MD–p until third and fourth grade and practical problem solving remained low–average from first through fourth grade.
Although chi–square analyses indicated that the MD–p group was more likely than other groups to have children with MD in first and second grade, the group was not characterized by MD in these grades. This indicates that the MD–p group included children with discernable deficits in first and second grade and children whose deficits did not become apparent until third or fourth grade. There may be two reasons why deficits did not characterize the MD–p group until third grade. On the one hand, it is possible that the measures used in this study were insufficiently sensitive to detect MD in first and second graders with MD–p. That is, what appeared as average skills may in fact reflect measurement error.
On the other hand, that MD in the MD–p group were not readily discernable until about third grade raises questions for future research about the notion of late–emerging MD. In the reading literature, recent attention has been paid to the differences between early and later–emerging RD (Compton, Fuchs, Fuchs, Elleman, & Gilbert, 2008; Leach, Scarborough, & Rescorla, 2003; Lipka, Lesaux, & Siegel, 2006). Future research is necessary to examine the developmental course of MD–p and whether there is a need to consider later–emerging MD–p separate from early emerging MD–p. In addition, research should examine whether later–emerging MD–p can be identified before deficits emerge, how these children respond to intervention, and whether early targeted instruction can prevent the occurrence of later–emerging MD.
MD–p also tended to be characterized by depressed but not necessarily deficient reading skills, although if RD were present, they were more likely to occur in the MD–p group. It is important here to briefly note previous research that has examined subtypes of MD, specifically comorbid MD and RD (MD/RD) and MD without RD (MD only). In general, the subtype research is mixed. Some studies support the need to consider subtypes (e.g., Badian, 1999; Passolunghi & Siegel, 2001; Powell et al., 2009; Siegel & Ryan, 1989). Other studies find the primary difference between MD/RD and MD only to be one of severity, where both groups perform lower than typical developers, but MD/RD groups have more pervasive academic deficits (e.g., Fuchs & Fuchs, 2002; Hanich et al., 2001; Jordan & Hanich, 2000; Jordan et al., 2003), but do not differ in their responsiveness to intervention (Fuchs et al., 2008).
Although this study was not designed to investigate MD subtypes, our findings are consistent with previous studies in that reading problems are associated with MD but that a group of children manifest MD without RD. To our knowledge, no research has previously examined MD subtypes using persistently low achievement to define MD. Given the mixed findings in the field, this is an important area to pursue in future research. More specifically, it is particularly relevant to determine whether a subtype paradigm is necessary in MD research, and whether important differences exist between MD/RD and MD–only groups.
In sum, these findings suggest that, in first and second grade classrooms, children with MD–p may achieve minimal learning goals. However, the low calculation and number–fact skills exhibited by the MD–p group in third and fourth grade, coupled with shaky practical problem–solving skills across time, indicate that these children lack a solid mathematical foundation, despite low–average to average performance in the early years. Thus, practitioners should be attentive in the early elementary grades to those children who demonstrate minimal mathematical proficiency because it may be an indication of MD–p as opposed to a developmental lag. A telltale indicator of MD–p is an underdeveloped store of basic number facts, and these deficits emerge as early as second grade.
Cognitive Characteristics of MD–p
Our analyses of the relationship between cognitive processing variables and group membership revealed two important findings. First, the only cognitive processing variables that uniquely characterized MD–p were math concepts and phonological decoding, indicating that, from first through fourth grade, children with MD–p know fewer math concepts than other children and perform at a lower level on phonological decoding. Second, the classification results indicated that the MD–t group was consistently misclassified as typically developing, this finding supports the inclusion of MD–t groups as typical developers as a methodological feature in studies on MD.
It was interesting that math concepts but not number series uniquely characterized MD–p. Math concepts assesses concepts that are typically learned—either formally or informally—such as shapes, counting, number identification, and quantitative vocabulary; this type of knowledge is referred to as crystallized knowledge, defined as the breadth and depth of general knowledge and reasoning with previously learned information (McGrew et al., 1997). By contrast, number series—a measure of numerical reasoning—assesses number pattern recognition, which is typically not a learned skill; this type of knowledge is known as fluid reasoning, defined as the ability to reason and problem solve using new information and/or procedures (McGrew et al., 1997).
That performance on math concepts specifically distinguished the MD–p group from the other groups suggests that the deficits in MD–p reflect an underdeveloped fund of mathematical knowledge and/or lack of exposure to mathematical concepts as opposed to deficient numerical reasoning abilities. This is encouraging because it indicates that children with MD–p are deficient on skills that can be more easily taught than numerical reasoning. However, our findings suggest that exposure to formal mathematics instruction did not eliminate these children's deficiencies in math concepts. Future research is needed to determine whether remediating such deficits would have an impact on mathematics achievement. In terms of early identification, our findings indicate that an underdeveloped store of mathematical knowledge is a particular defining feature of MD–p and thus is an important skill area to assess in an early screening battery.
With respect to word attack, our results suggest that phonological decoding plays an important role in MD–p. However, our results do not indicate that MD–p is characterized by deficient phonological skills, only that these skills are less well developed in MD–p than in peer groups. Murphy et al. (2007) also found that, from kindergarten to third grade, children with MD–p performed in the low–average to average range on word attack. Taken together, these findings suggest that children with MD–p may have lower phonological skills than other children, though they are not necessarily deficient in these skills. However, in both our study and that of Murphy et al., phonological processes were assessed with a measure of phonological decoding rather than a direct measure of phonological processing, which may have masked any existing phonological deficits. That phonological decoding was associated with MD–p is also interesting in light of the relationship between phonological decoding and reading and the MD/RD subtype research mentioned previously. Specifically, Geary (1993) hypothesized that the mathematics deficits in MD/RD reflect an underlying phonological processing deficit, whereas phonological processing deficits would not be expected to characterize MD only. Though the results of this study suggest that phonological decoding may play an important role in determining MD–p regardless of reading ability, future research should explore the role of phonological processing in explaining MD subtypes.
In this study working memory distinguished MD–p only in first and fourth grade. However, it is worth noting that third–grade working memory approached importance as a variable that separated MD–p from the other groups. Our findings are somewhat inconsistent with recent research that indicates that working memory deficits characterize MD–p from kindergarten through third grade (Geary et al., 2007; Murphy et al., 2007) in that in our study working memory deficits did not characterize the MD–p group in each grade. Our working memory measure tapped only numerical working memory, whereas other studies used measures that cut across numerical, verbal, and spatial working memory (e.g., Geary et al., 2007; Murphy et al., 2007), which may explain the discrepancy in findings. More studies are needed to examine how measures that tap different domains of working memory are involved in MD–p. In any case, the overall pattern of our results suggests that working memory is an important construct to consider, especially as a component of an early screening battery.
Processing speed—as measured by a rapid naming task—distinguished MD–p from MD–t and typical developers in third and fourth grade. These findings contradict recent findings that rapid naming deficits characterize MD–p in the early but not later school years (Geary et al., 2007; Murphy et al., 2007). Processing speed is thought to interfere with the ability to store and retrieve numerical information from long–term memory, likely through a connection with working memory. That processing speed was involved in discriminating MD–p from other groups in third and fourth grade is related to the finding that the MD–p group was characterized by severe deficits in number–fact knowledge in third and fourth grade. Other researchers have found that processing speed is related to number–fact knowledge (e.g., Bull & Johnston, 1997; Fuchs et al., 2006). Our findings indicate that processing speed plays an important role in MD–p, particularly in later grades as the mathematics deficits in this group become more severe. Future research should examine if measures of processing speed other than rapid naming tasks discriminate MD–p from other groups.
In this study, neither short–term memory nor visual–spatial ability reliably differentiated MD–p from MD–t or typical developers, suggesting that these cognitive processes are not defining features of MD–p. Geary et al. (1991, 2000, 2007) found that short–term memory deficits characterized MD–p in first and second grade; in this study, short–term memory contributed to MD classification only in fourth grade and even then did not demonstrate a particularly strong relationship in the discriminant function. However, although not significant, short–term memory tended to load highly on the second discriminant function. Thus, it is possible that short–term memory processes play a secondary role in MD–p. More research is needed. With respect to visual–spatial abilities, our findings are consistent with those of Geary et al. (2000), who did not find visual–spatial skills to characterize MD–p in second grade, but contradict those of Murphy et al. (2007), who found that visual–spatial deficits characterized MD–p from kindergarten to third grade. Our results indicate that visual–spatial ability does not contribute to the classification of MD–p, although it is possible that visual–spatial deficits may become salient when considering MD subtypes (Geary, 1993). More research is necessary.
Instructional Implications
It is interesting to consider the finding in this study that, for all groups, performance tended to be stronger on practical problem solving than on calculation and number facts. This suggests that children, including children with MD–p, have stronger mathematical knowledge than is suggested by basic mathematics skills. This contrasts reading development whereby basic skills (e.g., word recognition, word reading fluency) tend to be better developed than applied skills (e.g., reading comprehension). In reading it is unusual to find children with word reading difficulties who have average reading comprehension abilities. In other words, in reading, weaknesses in basic skills limit children's ability to gain meaning from text.
By contrast, this study suggests that basic mathematics skills do not necessarily constrain children's mathematical abilities; in fact, this study indicates that children's practical problem–solving skills remain fairly stable from first through fourth grade and appear to develop independently from basic skills. That children were better able to complete mathematics tasks in context than in isolation reveals important insights into children's mathematical thinking. Specifically, this finding suggests that children have mathematical understandings of the world that may or may not map onto formal mathematics. Such results suggest fundamental differences between mathematics and reading development and underscore the importance for educators to teach mathematics in a way that capitalizes on children's mathematical thinking. There is growing recognition that traditional mathematics instruction that emphasizes skill and fact learning at the expense of developing children's conceptual understanding does not lead to mathematically literate citizens (e.g., National Council of Teachers of Mathematics, 2000; Nunes, Schliemann, & Carraher, 1993; Simon, 2006).
This study supports the idea that children have a better–developed understanding of mathematics than is represented by their performance on basic tasks. For all children, but especially children with MD–p, that basic skills were not commensurate with practical problem solving represents a significant concern because it suggests that formal mathematics instruction is not enhancing children's mathematics skills. This is not to say, however, that mathematics instruction should focus on developing children's conceptual understanding at the expense of developing basic skills. In fact, basic skills have been shown to be foundational for more complex mathematics skills, such as solving word problems (e.g., Fuchs et al., 2006). More studies are needed to examine why basic skills prove challenging for all children, but especially children with MD–p. In addition, more research is needed to determine the most appropriate instructional context to support the development of basic skills commensurate with children's practical problem–solving abilities.
Limitations and Future Research
It is important to note that the present findings may be a function of how MD was defined. We defined MD according to performance on the Arithmetic subtest of the WRAT–3 (Wilkinson, 1993) given recent research suggesting that assessment of informal and formal mathematics ability results in a more reliable MD classification than relying solely on formal mathematics abilities (Fuchs et al., 2005; Mazzocco & Myers, 2003). In addition, we used a cut score at the 25th percentile and did not differentiate between strict and lenient cut scores (Chong & Siegel, 2008; Geary et al., 2007; Murphy et al., 2007), which may have resulted in the high variability of student scores relative to mean scores and obscured potentially important findings. Mazzocco and Myers (2003) found that those children with low achievement on one measure of mathematics did not necessarily perform in the below–average range on other measures that emphasized different aspects of mathematics achievement. However, that in our study MD–p was characterized by number–fact deficits suggests that our classification scheme did indeed capture the group of interest.
The issue of how to define MD is not a trivial one. Given the consistent finding in the literature that deficits in number facts are a defining feature of MD, one possibility is for researchers to define MD on the basis of number–fact knowledge. The difficulty, of course, is in reliably measuring number–fact knowledge before second or third grade. Studies are needed to examine the development of number–fact knowledge, including the precursors and the predictors. Fuchs et al. (2005, 2006) found that different domains of mathematics achievement were related to different cognitive predictors. Thus, it is also possible that deficits in number facts, calculation, or problem solving represent discrete types of MD. An alternative consideration concerns using measures of formal mathematics at all in the identification of MD. The study of MD has been informed primarily by perspectives from special education, cognitive psychology, and developmental psychology; the perspectives from mathematics education in particular are missing from discussions surrounding MD. This represents a significant gap in the literature especially considering the important perspective mathematics educators have in defining what it means to be mathematically literate. Although MD tends to be defined primarily according to formal mathematics skills, especially calculation skills, it is the perspective of mathematics educators that such skills do not provide a good proxy for mathematical ability. More collaborations across disciplines are needed, particularly with respect to understanding the deficits of children with MD.
Finally, though this study provided a comprehensive examination of the academic and cognitive characteristics of MD–p, other researchers have noted that comprehensive models of academic achievement need to consider economic, social, motivational, and instructional factors (Francis et al., 2005). That such data were not collected is a limitation of this study. More studies are needed to determine how cognitive factors interact with instructional factors, especially in the middle and secondary grades.
Acknowledgments
This research was supported in part by grants from the Natural Sciences and Engineering Research Council of Canada and from the Social Sciences and Humanities Research Council of Canada. This report is based on a dissertation by Rose K. Vukovic in partial fulfillment of the requirements for a doctoral degree in the Department of Educational and Counseling Psychology and Special Education at the University of British Columbia. We thank Cathy Molinski, Heather Calder, Shannon Sharp, and the principals, teachers, and students for their support and participation in this study. We also thank Richard Woodcock, Kevin McGrew, and Laurie Ford, for the generous use of the Woodcock–Johnson tests. Thank you to Helen Bent, Jessica Krajicek, Sabrena Jaswal, Elenita Tseng, Maggie Vukovic, and Laura Zajac, for assistance with data collection and entry. Special thanks to Lynn Fuchs for comments and suggestions on earlier versions of this manuscript.