
Abstract
The purpose of this study was to examine how different scoring procedures affect interpretation of maze curriculum–based measurements. Fall and spring data were collected from 199 students receiving supplemental reading instruction. Maze probes were scored first by counting all correct maze choices, followed by four scoring variations designed to reduce the effect of random guessing. Pearson's r correlation coefficients were calculated among scoring procedures and between maze scores and a standardized measure of reading. In addition, t tests were conducted to compare fall to spring growth for each scoring procedure. Results indicated that scores derived from the different procedures are highly correlated, demonstrate criterion–related validity, and show fall–to–spring growth. Educators working with struggling readers may use any of the five scoring procedures to obtain technically sound scores.
Deno (1985) proposed curriculum–based measurement (CBM) as a practical, instructionally relevant progress monitoring procedure for special education. CBM is practical because it is inexpensive, takes a short time to administer, is sensitive to growth over relatively brief durations, and produces results that are easily understood and communicated, especially when displayed in a graph format (Deno, 1985). In addition to being an indicator of the overall reading proficiency of students, CBM is sensitive to effects of small adjustments made in instructional programming so teachers can use the results to inform instruction (Deno, Mirkin, & Chiang, 1982). Frequent administration of CBM provides slope data that are unavailable through conventional achievement tests (Deno, 1985). Within special education, CBM is an efficient measure for monitoring student progress toward goals on their Individual Education Plans and for communicating progress to parents (Hosp & Hosp, 2003).
Since its initial inception in special education, the use of CBM has expanded to school– and district–level use. When CBM is administered to an entire school population, normative standards for both level and slope can be developed and used for decision making such as early identification of and intervention for at–risk students (Fuchs, 2003). Further, district–level as well as individual–level analyses of CBM data allow prediction of performance on high–stakes assessments required by the No Child Left Behind Act (2002; Silberglitt, Burns, Madyun, & Lail, 2006; Yeo, 2009), which can help school educators set individual–, grade–, building– and district–level goals. Problem–solving teams can use CBM data to identify academic problems of at–risk students, make decisions about selecting and implementing interventions, monitor students’ responsiveness to those interventions, and make ensuing decisions (Marston, Muyskens, Lau, & Canter, 2003). Finally, the Individuals with Disabilities Education Improvement Act (2004) allows local education agencies to use Response–to–Intervention (RTI) models to make special education eligibility decisions; progress monitoring data, such as that obtained using CBM, are central to this approach (Gersten & Dimino, 2006).
Cbm: Read Aloud versus Maze
To date, the most commonly used CBM tool is the read–aloud measure, in which students read aloud for 1 min and the number of words read correctly is recorded. However, several practical disadvantages limit teachers’ use of read–aloud measures. One disadvantage is that read–aloud measures need to be individually administered, which can be time consuming when they are used for screening or individual progress monitoring (Fuchs & Fuchs, 1992; Wayman, Wallace, Wiley, Ticha, & Espin, 2007). A second disadvantage is that, despite research indicating strong correlations between read–aloud measures and measures of reading comprehension (Wayman et al., 2007), classroom teachers are not convinced that read–aloud measures are valid for monitoring comprehension skills (Fuchs & Fuchs, 1992; Wayman et al., 2007). A third practical disadvantage is that the reliability and criterion–related validity of read–aloud measures appear to decline for older students (Jenkins & Jewell, 1993; Silberglitt et al., 2006; Wayman et al., 2007).
Fuchs and Fuchs (1992) proposed CBM maze as a viable alternative for screening and progress monitoring. During a maze task, a student independently reads a passage from which every seventh word has been deleted and replaced with three word choices. The score is the number of correct word choices the student selects in 1–3 min. Maze is an attractive alternative because it can be group administered, is adaptable to computer administration, and has more face validity for many teachers because the student must have some level of reading comprehension to make correct maze selections. Researchers have provided evidence that maze yields reliable and valid scores that are sensitive to growth and differentiates poor readers from typical readers at both classroom and district levels (Brown–Chidsey, Davis, & Maya, 2003; Deno et al., 2002).
Technical features of maze scores, such as sensitivity to growth and standard errors of estimate, have been demonstrated to be similar to technical features of read–aloud scores (Fuchs & Fuchs, 1992). Repeated administration of maze measures has yielded alternate–form reliability coefficients in the. 80s, provided reliable estimates of student growth, and revealed group growth and individual differences (Shin, Deno, & Espin, 2000). When compared to various achievement tests and read–aloud measures, the maze measure has consistently yielded valid scores (Deno et al., 2002; Fuchs & Fuchs, 1992; Jenkins & Jewell, 1993; Wayman et al., 2007).
Recently, researchers have found that the predictive validity of scores from maze measures is not significantly different from that of read–aloud measures when correlated with state accountability tests (Shin et al., 2000; Silberglitt et al., 2006; Wiley & Deno, 2005; Yeo, 2009). Jenkins and Jewell (1993) suggest maze scores appear to be more stable across grades 2 through 6, while read–aloud scores show decreasing validity after grade 4. Similarly, Silberglitt et al. (2006) found the magnitude of the relationship between read–aloud scores and scores from state accountability tests decreased from a strong relationship in grade 3 to a moderate relationship in grade 8. The maze scores maintained a moderate relationship across grades 7 and 8. The results of two recent studies (Espin, Wallace, Lembke, Campbell, & Long, in press; Ticha, Espin, & Wayman, 2009) provide evidence that, although both read–aloud and maze measures have good reliability and validity for measuring the reading performance of eighth–grade students, only the maze measure evidenced interpretable growth rates across time. The growth patterns procured from maze measures were comparable to growth patterns procured from the Woodcock–Johnson III Tests of Achievement (2001) for both high– and low–performing eighth–grade students (Ticha et al., 2009). The accumulated findings support Wayman et al.'s (2007) recommendation for increased attention to maze as an alternate CBM reading measure.
Variability in CBM Maze Procedures
Across studies of maze, there has been considerable variability in the construction of maze passages, the content and readability of passages, duration of the testing sessions, and scoring procedures. Below, we highlight common sources of this variability.
Maze Construction
Fuchs and Fuchs (1992) detailed a standardized method for constructing maze measures from a reading curriculum. After selecting a passage, the first sentence is left intact. Counting from the first word of the second sentence, every seventh word is deleted and replaced with a three–word choice made from the correct replacement and two distracters. During administration, the students read the passage silently and circle a selection from each three–word choice.
Researchers have detailed two sets of characteristics for distracters. Fuchs and Fuchs (1992) recommend using words that are one letter shorter or longer than the correct word choice. Additionally, distracters should not make contextual sense, rhyme or be close in sound or letter configuration to the correct word choice, be a nonsense word, require the student to read more than 1.5 lines ahead in the passage to eliminate, or be so high in vocabulary that the distracter could be mistaken for a nonsense word by the student. Shinn and Shinn (2002) recommend using one near and one far distracter. The near distracter is from the same parts–of–speech category (e.g., noun, verb, adjective) but does not make sense in the current context. The far distracter is a word selected randomly from the story that is not from the same part of speech as the correct word choice and does not make contextual sense.
In response to a concern that the reading process may be interrupted by the deletion of every seventh word, Deno et al. (2002) administered an alternate form that placed the three–word choice at the end of each sentence. No significant differences were found, which suggests the placement of the three–word choice does not influence performance.
Maze Passages
CBM maze passages are a form of general outcome measures (GOM) because they use standard testing procedures to repeatedly assess progress toward long–term goals (Hosp & Hosp, 2003). In alignment with the core CBM concept, some researchers and school districts create multiple maze probes using passages within a reading curriculum (Deno, 1985). However, the content of passages created from local curricula will differ from school to school and will likely vary in difficulty level due to a lack of stringent readability control, which adds variability that reduces the efficacy of the measure (Fuchs & Deno, 1994).
Other researchers and school districts use reading–level–controlled GOM passages created for public and private use (Deno et al., 2002). These passages are leveled by grade, are of similar difficulty within grade, and reflect a general curriculum (Shinn & Shinn, 2002). Because the passages are developed to be used across curricula rather than with a specific curriculum, their use may reduce the chances of a practice effect (Hosp & Hosp, 2003).
Brown–Chidsey, Johnson, and Fernstrom (2005) conducted a small, exploratory study to determine if literature–based passages or reading–level–controlled passages better differentiated scores and reading skill growth. Results showed that, although the controlled passages yielded statistically significantly higher scores across fall, winter, and spring screenings (Cohen's d effect sizes (ES) = 1.05,. 62 and. 89, respectively), the two types of passages were highly correlated at all screenings (rs =. 80,. 70, and. 92, respectively). The consistently high correlation coefficients suggest that maze passages from different sources measure students’ reading across time in similar ways. However, the authors caution that crossing between passage types could result in inaccurate and confusing data.
Maze Duration
Administrative differences are found in the length of individual testing sessions. Time limits vary from 1 min (Deno et al., 2002; Wiley & Deno, 2005) to 10 min (Brown–Chidsey et al., 2003). Time durations include 2 min (Brown–Chidsey et al., 2003), 2.5 min (Fuchs & Fuchs, 2002; Hosp & Hosp, 2003), and 3 min (Shin et al., 2000; Silberglitt et al., 2006). Currently there is not agreement on a time limit that provides the best balance between efficiency and effectiveness.
Maze Scoring Procedures
Finally, researchers have used a variety of different procedures to score maze measures. Most researchers who have analyzed maze data simply counted the correct word selections and used the resulting score as the dependent measure (e.g., Fuchs & Fuchs, 2002; Silberglitt et al., 2006; Wiley & Deno, 2005). Other researchers have generated procedures that control for the effects of random guessing, speculating that this may improve the measure's capacity to predict which students need further monitoring (Deno et al., 2002). For example, Brown–Chidsey et al. (2003) controlled for effects of random guessing by applying a method recommended by Deno et al. (2002), adjusting the correct word selection raw score by subtracting one–half the number of errors the student made. A more conservative approach involves subtracting total errors from total correct word selections. A third adjustment procedure is to stop correcting after three adjacent errors and count only the correct word selections that precede the cutoff mark (Deno et al., 2002; Jenkins & Jewell, 1993). A more stringent format of this procedure that allows only two consecutive errors was examined by Deno et al. (2002). Based on data collected from students in second through sixth grades, the correlations of maze scores with standardized reading test scores was the same (r =. 69) for both three–in–a–row and two–in–a–row scoring rules. For second–graders, results suggest the two–in–a–row scoring rule decreases the chances of false negatives when determining the at–risk group (bottom 20 percent) to be monitored (Deno et al., 2002). However, for older students, both the two–in–a–row and the three–in–a–row rules may identify false positives and create extra within–student variance if the cutoff rule means ignoring many would–be–correct word selections.
Purpose
The purpose of the present study was to examine the difference in procedures used to score maze measures administered to poor readers. Specifically, data were analyzed to determine the criterion–related validity of the procedures with respect to a standardized reading measure and the extent to which each procedure shows student growth from fall to spring. Data for this study were collected from students at risk for or identified as having disabilities in reading. We focused on this population because students who struggle with reading are frequently monitored with CBM to determine if instructional programming is effective. In addition, their reading performance often varies from day to day and this variance may be enhanced by stringent scoring methods.
To examine how different scoring procedures affect interpretation of maze data from students at risk in reading, we addressed the following questions: (1) Do different scoring methods affect the criterion–related validity of the maze measure when compared to standardized reading scores and to CBM read–aloud measures? (2) Do different scoring methods affect the extent to which the CBM maze procedure shows student growth from fall to spring under typical instructional conditions?
Method
Setting and Participants
Data for the present study were collected as part of a larger study that examined the influence of two CBM reading measures and error analysis on instructional decision making and student achievement. The larger study occurred in one large urban district and one rural cooperative in a midwestern state. The urban district had a total of 35,757 students from all grades. Of these, 39.7 percent were African American, 29.6 percent White American, 17.2 percent Hispanic American, 8.9 percent Asian American, and 4.6 percent Native American; 23.2 percent spoke English as a second language. Free and reduced lunch percentages were 72 percent for K–8 schools and 60 percent for K–6. Half the population were male (51 percent) and 15.9 percent received special education services. Participants from the rural cooperative were from schools in eight different towns. Those schools had a combined student population of 12,166; 93 percent were White American, 3.3 percent Hispanic American, 2 percent African American, and 1.4 percent Asian American. Twenty–four percent of the total population received free or reduced lunches, 12.6 percent received special education, 8.3 percent received Title 1 services, and 1.5 percent spoke English as a second language. Approximately half (51.8 percent) of the student population were males.
Initially, participants in the larger study totaled 219 students (99 from the urban district and 120 from the rural district). Attrition of 20 students (9 percent) occurred during the study; thus, the results in this study were determined from data collected from the remaining 199 students (87 in the urban district and 112 in the rural district). Results from t tests did not demonstrate significant differences between the pretest maze means of the 219 students and the final 199 students for any of the five scoring procedures; results ranged from t(416) =. 037, p =. 971, to t(416) =. 135, p =. 893. Thus, attrition did not appear to affect the overall reading level of the sample. Demographic information for our sample is provided in Table 1.
Demographic Information about Participants
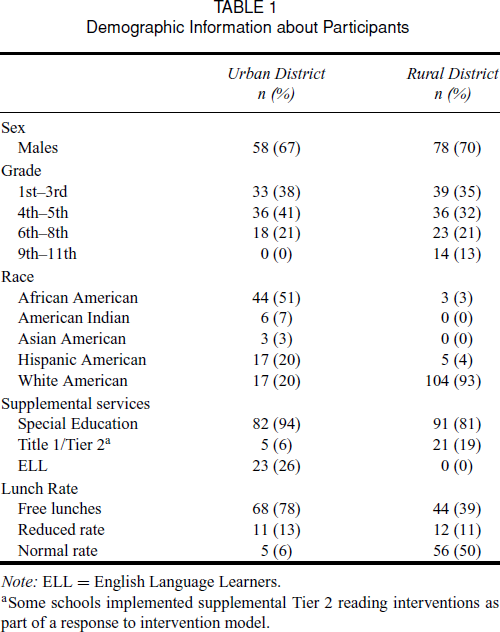
Note: ELL = English Language Learners.
Some schools implemented supplemental Tier 2 reading interventions as part of a response to intervention model.
Independent Variable
Passage Selection
The independent variables in this study were five different procedures for scoring CBM maze measures. Two common (i.e., identical passages administered to all participants) CBM maze probes were selected from the second–grade level of Project PROACT MAZE Reading Passages (Vanderbilt University). Five passages were selected that were not culturally dependent (e.g., based on a holiday, tradition, or folktale), were not too familiar (e.g., based on a fairy tale), and were longer than 350 words.
Scoring Procedures
All probes were scored using five different methods (one that involved simply counting all correct maze choices and four that were meant to reduce the effect of random guessing):
Correct maze choices (CMC): The scorer counted all the correct maze choices (e.g., Fuchs & Fuchs, 2002; Silberglitt et al., 2006; Wiley & Deno, 2005). Correct minus incorrect maze choices (CMC–IMC): After counting both CMC and incorrect maze choices (IMC), IMC were subtracted from CMC. CMC minus ½IMC: The scorer counted both CMC and IMC but subtracted only half the IMC score from the CMC score (Brown–Chidsey et al., 2003). Two–error rule: The scorer stopped scoring after two consecutive errors were made and only counted CMC and IMC that preceded the first of the two consecutive errors (Deno et al., 2002). Three–error rule: This procedure is identical to the two–error rule, except the scorer stopped scoring after three consecutive errors (Jenkins & Jewell, 1993; Deno et al., 2002).
Dependent Variables
Standardized Reading Measures
The Letter–Word Identification and Reading Comprehension subtests of the Kaufman Test of Educational Achievement–Second Edition (KTEA–II; Kaufman & Kaufman, 2004) were administered as posttests. Letter–Word Identification requires students to read lists of isolated letters and words. The first items of the Reading Comprehension subtest require students to look at pictures and find matching words. In the next group of items, students read a command and perform the requested action. Most of the subtest's items require students to read a passage and its attendant questions, the majority of which are open ended and require brief (single word or phrase) oral answers. The published split–half reliability coefficient of the KTEA–II is. 97 for Letter–Word Identification and. 93 for Reading Comprehension. The two subtests have a published correlation of. 68 and correlations to other standardized reading assessments range from. 76 to. 85 (Kaufman & Kaufman, 2004).
Cbm Read–Aloud
Two common read–aloud probes at the second–grade reading level were administered as pre– and posttests. The read–aloud probes were selected from Peabody CBM Reading Passages & Word Counts (Vanderbilt University) following the same selection procedure as for the common maze passages (see earlier). Based on the sample in this study, alternate–form reliability of the read–aloud passages was. 94. When compared to the KTEA–II, the criterion–related validity of the read–aloud measure was. 84 (Letter–Word Identification raw score) and. 75 (Reading Comprehension raw score).
Procedures
Sample Selection
Special education and Title 1 teachers participating in the larger study sent out participation invitations to all qualifying students on their caseloads. To qualify for the study a student had to be (1) receiving supplemental or pull–out reading instruction from a Title 1 or special education teacher, (2) able to read at least 10 words of connected text, and (3) likely to remain on the teacher's caseload for the year.
Administration of Fall and Spring Assessments
All CBM probes were administered by research assistants within the students’ schools. First, two maze probes (2 min each) were group administered. Next, two read–aloud probes (each 1 min in duration) were individually administered. During only the spring sessions, the KTEA–II word identification and comprehension subtests (in that order) were individually administered after the CBM probes. All examiners followed the same script and procedure (see Appendix). There were approximately 6 months of instruction between fall and spring assessment sessions.
Scoring and Reliability
Two research assistants independently scored all maze probes (see “Scoring Procedures” above). A word selection was scored as incorrect if it was not the correct answer, it was skipped, more than one selection was circled, or the selection could not be determined. Any differences were discussed until both research assistants agreed on a correct score.
Read–aloud probes were scored for total words (TW) and incorrect words (IW) during administration. A word was scored as incorrect if it was mispronounced, omitted, or the student hesitated for more than three seconds. Differences in dialect or speech patterns were not counted as errors. Test administrators tape–recorded 12 percent of their probes. Later, another research assistant independently scored the taped passages. Interscorer agreement, calculated by dividing total agreements by agreements plus disagreements, was 95 percent. Words read correctly (WRC, calculated as TW minus IW) were determined and used for analysis.
Two research assistants independently determined the raw scores, standard scores, and percentiles for the KTEA–II Letter–Word Identification subtest, Reading Comprehension subtest, and reading composite. Subtest raw scores were used for analyses.
Data Analyses
To answer the first research question, we ran bivariate Pearson correlations between the mean posttest maze scores of the five different scoring procedures and scores of the other posttests: the mean WRC of the read–aloud probes, the raw score of the Letter–Word Identification subtest, and the raw score of the Reading Comprehension subtest. Confidence Intervals (CIs) for rho were calculated based on the Fisher r–to–z transformation. Analyses were also run after sorting the data into grade groups: primary (1st–3rd grades; n = 72), intermediate (4th–5th grades; n = 72), and higher grades (6th–11th grades; n = 55). Middle school (6th–8th grades) and High School (9th–11th) students were combined because of the small number of participants in the latter group.
The answer for the second research question was determined by running six paired–sample t tests; five comparing pretest to posttest scores for each maze scoring procedure and one comparing the read–aloud scores. The resulting mean differences were divided by the pooled standard deviations to determine effect sizes for each.
Results
In this study, we addressed two research questions: (1) Do different scoring methods affect the criterion–related validity of the maze measure when compared to standardized reading scores and to CBM read–aloud measures? (2) Do different scoring methods affect the extent to which the CBM maze procedure shows student growth from fall to spring under typical instructional conditions?
Before investigating the questions, we first examined the alternate–form reliability of and correlations among scores obtained from the five different scoring procedures. Means and standard deviations for the fall scores and spring scores are listed in Table 2, along with alternate–form reliability coefficients, which ranged from r =. 84 to. 90.
Fall and Spring Means, SDs, and Alternate–Form Reliability for Five Maze Scoring Procedures
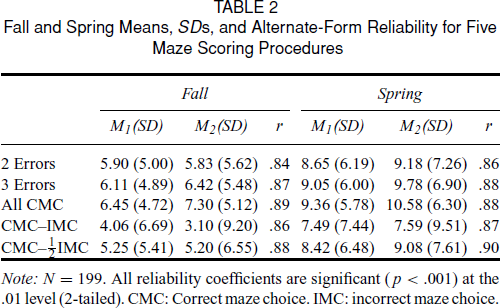
Note: N = 199. All reliability coefficients are significant ( p <. 001) at the. 01 level (2–tailed). CMC: Correct maze choice. IMC: incorrect maze choice.
The correlations among CBM maze scores of the five different scoring procedures are shown in Table 3. Pearson product–moment correlations among fall mean scores ranged from r =. 72 to. 99 (all ps <. 001). Correlations among spring mean scores ranged from r =. 90 to. 98 (all ps <. 001). Correlations among the different CBM maze mean scores continued to be statistically significant when spring data were analyzed by grade groups. As listed in Table 4, correlations in primary grades (1st, 2nd, and 3rd) ranged from r =. 76 to. 97; correlations in the intermediate grades (4th and 5th) ranged from r =. 92 to. 99; and correlations in higher grades (6th–11th) ranged from r =. 95 to. 99.
Correlations among Maze Mean Scores Resulting from the Five Scoring Procedures
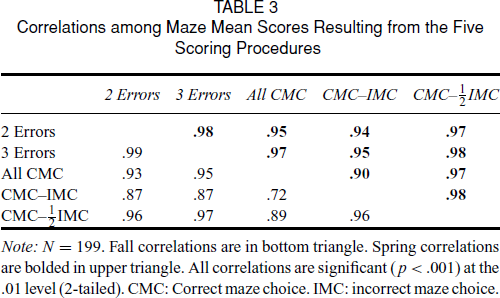
Note: N = 199. Fall correlations are in bottom triangle. Spring correlations are bolded in upper triangle. All correlations are significant ( p <. 001) at the. 01 level (2–tailed). CMC: Correct maze choice. IMC: incorrect maze choice.
Correlation of Spring Maze Mean Scores Using the Five Procedures by Grade Level
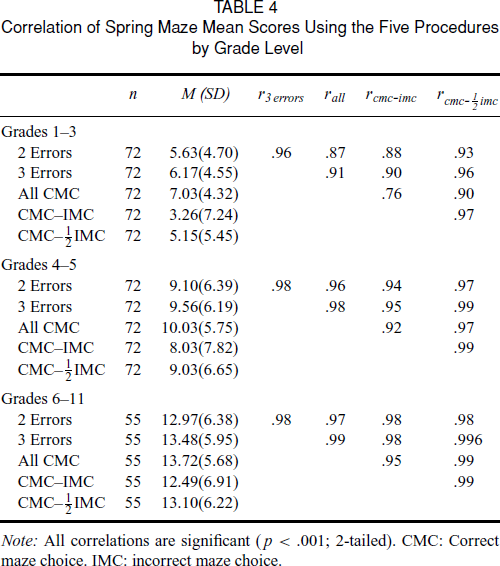
Note: All correlations are significant ( p <. 001; 2–tailed). CMC: Correct maze choice. IMC: incorrect maze choice.
Criterion–Related Validity
The first research question addressed whether the different scoring procedures had differing effects on the criterion–related validity of the maze measure. In this study, the spring mean maze scores were correlated with raw scores from two reading subtests of the KTEA–II and with WRC from CBM read–aloud measures. The researchers analyzed both overall correlations and correlations within grade levels. Table 5 shows the criterion–related validity coefficients and CIs for each scoring procedure. For the overall scores (those not divided into grade groups), the range of coefficients is small, rs =. 73 to. 82. The coefficients vary a bit more within grade groups: the range for the primary group is r =. 67 to. 79, of the intermediate group is r =. 68 to. 86, and of the older group is r =. 61 to. 76. Across every criterion measure, the coefficient of each procedure is encompassed within the CIs of the other approaches, with one exception in the primary grade level. Although the ranges overlap, the coefficients resulting from correlating the KTEA–II Reading Comprehension subtest to the scoring procedure that stopped after two consecutive errors and to the procedure that used unadjusted raw scores (CMC) are not contained within each other's ranges.
Criterion–Related Validity: Correlation Coefficients and 95 Percent CIs
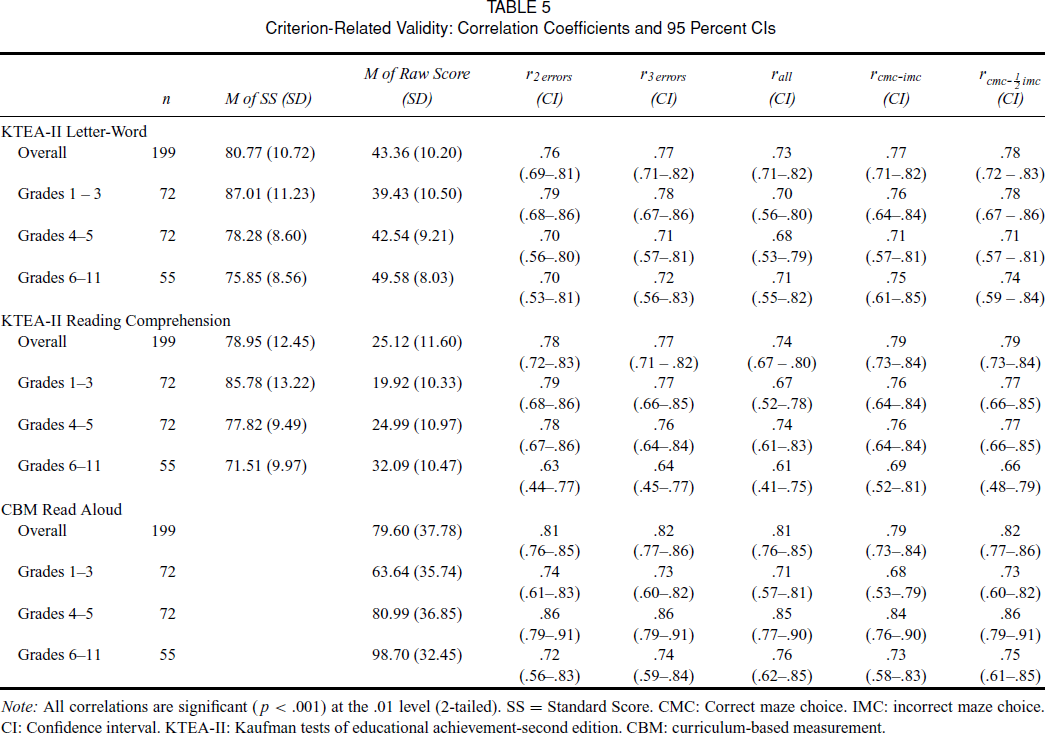
Note: All correlations are significant ( p <. 001) at the. 01 level (2–tailed). SS = Standard Score. CMC: Correct maze choice. IMC: incorrect maze choice. CI: Confidence interval. KTEA–II: Kaufman tests of educational achievement–second edition. CBM: curriculum–based measurement.
Student Growth from Fall to Spring
The second research question addressed the extent to which the different scoring procedures show student growth from fall to spring under existing instructional conditions. Results from paired–sample t tests (Table 6) indicate that all scoring methods reflected statistically significant fall–to–spring growth (all ps <. 001). Cohen's d ES of the procedures ranged from. 50 to. 58 and were higher than the effect size for the read–aloud probes (ES =. 40).
Sensitivity to Student Growth: Paired Sample t Tests Using Fall and Spring Data
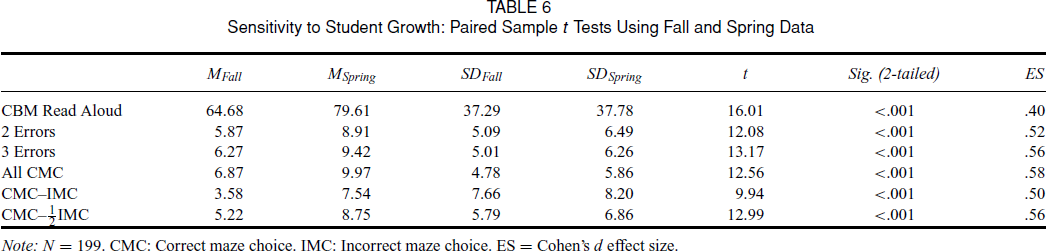
Note: N = 199. CMC: Correct maze choice. IMC: Incorrect maze choice. ES = Cohen's d effect size.
Discussion
Further, we discuss our results with respect to each research question. We end with implications for practice and future research.
Alternate–Form Reliability and Intercorrelations
Study results indicate strong alternate–form reliability coefficients that are stable across scoring procedures and testing times and are similar to findings from past studies. The reliability coefficients reported in this study are within the range of maze alternate–form coefficients reported by Shin et al. (2000) and Ticha et al. (2009). Based on the findings in this study, educators can feel confident that different scoring procedures will not affect the strong alternate–form reliability of CBM maze scores.
Study results also indicate strong correlations among the five maze scoring procedures across grades and across testing times. The correlations remain strong within grade groups; however, the correlations for two of the scoring methods, CMC–IMC and raw maze scores that are not adjusted (CMC), appear to be slightly lower within the Grade 1 through 3 group than within the other two groups. Overall, these results suggest that educators, especially those working with older students, will obtain similar results from using either raw maze scores or scores that have been adjusted for random guessing.
Criterion–Related Validity
As Wayman et al. (2007) note, there are no clearly established standards to guide decisions about what constitutes “strong” validity correlations for reading measures. In their review of research examining technical adequacy of CBM in reading, they defined strong validity correlations as coefficients equal to or greater than. 70. They were careful to note that this criterion was chosen based on previous research findings that supported relatively high validity coefficients for reading measures. Using this rigorous level, our overall results support strong criterion validity for the maze measure when compared to scores from two reading subtests of the KTEA–II (rs =. 73 to. 79). The strength of this relation was robust across all scoring procedures. Similarly, overall scores from each of the five procedures were strongly correlated with read–aloud scores (rs =. 79 to. 82). For each comparison measure, the correlation coefficient associated with a single scoring approach is encompassed within the CIs of all other approaches, which suggests that each scoring procedure yields similar validity coefficients.
Within grade levels, two observations are worth noting. First, across scoring procedures within the older grade level (grades 6 to 11), the correlation coefficients for the reading comprehension criterion are all less than. 70 (rs =. 61 to. 69). The declining coefficients for comprehension are similar to findings of Yovanof, Duesbery, Alonzo, and Tindal (2005; as cited in Wayman et al., 2007), which reported that correlation coefficients between read–aloud CBM scores and comprehension scores diminished from a range of r =. 60 to. 65 in grades 4 and 5 to a range of r =. 42 –. 52 in grades 6, 7, and 8.
Although the validity coefficients for maze may remain stable across grades 2 through 6 (Jenkins & Jewell, 1993), our findings suggest that validity correlations with comprehension measures may begin to decline for students who struggle with reading as they advance beyond grade 6. Interestingly, correlation coefficients with the Letter–Word subtests remained stable across grade levels. This may suggest that maze measures capture similar variance in decoding skills across grades, but fail to do so for comprehension in the older grades. Alternatively, the lower comprehension validity coefficients for older students may be the result of using a reading passage that was simple for them (second–grade reading level). When Ticha et al. (2009) used passages that ranged from the fifth– to eighth–grade reading levels, the criterion–validity correlations for 3 min maze remained high (rs =. 82 and. 88). Further research is required to provide supporting evidence for either supposition.
The second observation relates to the primary–grade level: Across all criterion measures, coefficients were lower for the scoring procedure that relied on raw scores alone (CMC). In line with this finding, it may be preferable to use a procedure that adjusts for guessing when administering CBM maze to younger students.
Criterion–related validity coefficients that resulted from comparing this study's maze and read–aloud scores are similar to past findings; however, criterion validity coefficients that resulted from comparing maze scores to standardized tests of achievement appear to be equal to or higher than the upper end of the range of coefficients reported in previous research (Jenkins & Jewell, 1993; Wayman et al., 2007). One plausible explanation is that the grade levels of the participants in this study ranged from grade 1 to grade 11. This wide range of grades may have increased variance across participants, even though the within–grade variance may have been restricted because all the participants were poor readers.
Another consideration for the higher coefficients may be the use of KTEA–II as a criterion variable. The comprehension subtest of the KTEA–II uses a different format from those of standardized tests used in other studies (e.g., Woodcock Reading Mastery Test, Gates–MacGinitie, and Metropolitan Achievement Test) and thus may be more discriminating between student performance, especially when used with students who struggle with reading. In contrast to the cloze format that requires students to find a word that contextually and structurally fits in the blank, the KTEA–II subtest requires them to read an open–ended question and orally supply a brief answer. The open–ended question format is also different from the multiple–choice format of the other tests because students are not required to complete the additional task of reading through a list of possible answers. This may be important if the reduced reading requirement allows more working memory for finding answers. Finally, the open–ended questions are answered orally, rather than in writing as is required by group–administered tests. Support for any of these explanations would require further examination (e.g., a direct comparison of correlations between maze, KTEA–II, and other standardized tests).
Student Growth from Fall to Spring
CBM was designed to have the capacity to inform instruction by detecting student growth in relatively brief time periods (Deno, 1985). Because this feature is vital to a teacher's use of CBM for improving instruction, we examined the extent to which each scoring procedure revealed a change in scores across time. All five maze scoring approaches resulted in statistically significant fall–to–spring differences and moderate effect sizes (.50 to. 58) when mean fall scores were compared with mean spring scores, which indicates they all capture some degree of fall–to–spring growth. This finding is supported by the read–aloud measure, which also showed fall–to–spring growth (ES of. 40).
It is important to note that CBM measures are considered “sensitive to growth” when they capture growth that occurs as a result of ongoing instruction (Deno, 1985). In this study, we did not manipulate existing instruction; rather, we relied on the assumption that typical classroom instruction would result in some degree of fall–to–spring growth. This assumption is supported by the effect size of the read–aloud CBM, a measure that has been supported by research as being sensitive to student growth (Fuchs & Fuchs, 1992; Shin et al., 2000). In future research, it would be useful to establish some minimum standard of growth and to determine whether maze reflects this standard and whether it detects students’ responsiveness to changes in instruction.
As a final note, although all are moderate, the effect sizes of the different maze scoring procedures are not equal. The smaller effect size evidenced by the CMC–IMC adjustment procedures suggests it may be the least sensitive to student growth from fall to spring.
Educational Implications, Limitations, and Future Research
Taken together, results of this study indicate that, even when different scoring procedures are used, the scores derived from the maze measure are highly correlated, demonstrate strong alternate–form reliability and criterion–related validity, and reveal growth. Educators working with students who are struggling readers could use any of the five scoring procedures to obtain technically sound scores that can be used to inform instruction. That being said, it was observed that CMC–IMC appeared to yield slightly lower correlations with other scoring procedures, lower correlation coefficients with read–aloud scores, and a smaller effect size for fall–to–spring growth. In addition, for educators working with younger children it may be preferable to use one of the scoring procedures that adjusts for random guessing.
For this study, we only collected CBM data in the fall and spring, so slope information could not be used to investigate the sensitivity of each scoring procedure to student growth. Analysis of slope data, along with effect sizes, would have created a more complete understanding of each scoring procedure's sensitivity to student growth and its stability across time. This study's findings would also be strengthened if we knew more about the typical growth our participants could be expected to make as a result of ongoing classroom instruction. It is conceivable that using a common passage (second–grade reading level) across grades had an effect on the slightly lower correlations among the five scoring procedures within the grades 1 through 3 group. If the passages were more difficult for the students in that group than for the students in the older groups, it is plausible that an increased proportion of the younger students may have either earned raw CMC scores close to zero or high IMC scores due to random guessing (e.g., circling answers without reading). In fact, our data support that younger students had disproportionately lower CMC–IMC scores than the other groups. Of the 31 participants who scored a mean posttest CMC–IMC score of less than zero, 21 were within grades 1 through 3, 7 were in grades 4 and 5, and 3 were in the group of older students. However, the disproportion could be due to other factors, such as younger students’ lower reading skills. Further research is needed to examine the residual effects of common passages on scores of young readers. Perhaps CBM probes at each student's instructional level could be administered in addition to common passages.
Our study examined the differing effects of scoring procedures that use a single adjustment for random guessing. In practice, there may be times when two adjustment procedures are used: one in counting (stopping after two or three errors) and one in scoring (CMC–IMC or CMC–.5IMC). In the future, researchers may wish to examine if such combinations result in a more effective scoring procedure.
Finally, it is important to note that our findings are limited to students with poor reading skills who received small–group or individualized reading instruction and may not generalize to students who are average to above–average readers. Also, although our urban sample was ethnically diverse and included students for whom English is a second language, the rural sample thinned this diversity. Thus, although the results of this study are useful, research is needed to investigate whether similar findings apply to more heterogeneous (in terms of reading level and cultural/linguistic background) samples of readers.