
Abstract
This study examined effects of goal setting, frequency of progress monitoring, and method of evaluating progress on the number of instructional change prompts generated by reading–curriculum–based measurements (CBM). Participants were 31 high–incidence special education students in grades 2–6 selected from 8 schools. Following baseline measurements, researchers administered grade–level CBM passages every 2 weeks for 8 weeks. Comparisons included 3 goal levels (0.5, 1.0, or 1.5 word growth per week), 3 monitoring/evaluation schedules (every 2, 4, or 8 weeks), and 2 methods for evaluating progress (points below the aim line or slope). Overall, more ambitious goals, less frequent monitoring, and using slope to evaluate progress generated more instructional change prompts. Results favored less frequent monitoring and using slope to evaluate progress.
This research focused on a particular approach to progress monitoring and formative evaluation of instruction, specifically the application of reading–curriculum–based measurement (R–CBM; Deno, 1985) procedures to signal whether students’ growth is on track to reach Individualized Educational Program goals. R–CBM's methodology for evaluating growth and adjusting instruction has been demonstrated to be effective in improving student achievement (Fuchs, Deno, & Mirkin, 1984; Fuchs, Fuchs, Hamlett, & Ferguson, 1992).
CBM employs alternate–form tests (i.e., texts) of comparable difficulty, with each form representing a sample of the annual curriculum. Reading skill is indexed as the number of words a student reads aloud in 1 minute, expressed as words read correctly (WRC). This score correlates well with both word reading skill (Shinn, Good, Knutson, Tilly, & Collins, 1992) and comprehension (Deno, Mirkin, & Chiang, 1982; Fuchs, Fuchs, Hosp, & Jenkins, 2001; Fuchs, Fuchs, & Maxwell, 1988; Jenkins & Jewell, 1993; Marston, 1989; Jenkins, Fuchs, van den Broek, Espin, & Deno, 2003; Reschly, Busch, Betts, Deno, & Long, 2009), thus it is well suited for intermittent progress monitoring. Teachers can estimate students’ reading growth and evaluate students’ responsiveness to instruction by comparing the actual growth rate to the growth goals established beforehand. Insufficient responsiveness to instruction is a signal to revise the students’ instructional programs (Deno & Mirkin, 1977).
Despite an extensive research base (Wayman, Wallace, Wiley, Ticha, & Espin, 2007), CBM remains an underutilized technology. Time demands associated with measurement and evaluating instruction are likely obstacles to routine use of CBM. Wesson, Fuchs, Tindal, Mirkin, and Deno (1986) found that the time required for organizing materials; giving directions; and administering, scoring, graphing, and analyzing growth data was roughly 2.5 minutes per student, or approximately 10 percent of instructional time. For teachers with a caseload of 24 students, a single round of “1 minute” progress monitoring amounts to an hour of the teachers’ time. Moreover, the time and effort required to design and implement instructional changes may deter teachers from undertaking CBM progress monitoring, especially if procedures for evaluating students’ growth yield frequent prompts to change instruction (e.g., Fuchs, Fuchs, & Hamlett, 1989; Skiba, Wesson, & Deno, 1982). As a consequence, researchers have begun to explore ways of reducing the measurement and evaluation burden on teachers (Jenkins, Graff, & Miglioretti, 2009; Deno, Lembke, & Reschly, n.d.).
Our purpose in this research was to examine aspects of CBM progress monitoring and data evaluation, each with potential for affecting the instructional decisions teachers make and the effort demanded of the decision–making process itself. Specifically, we focus on how three CBM methodological variables—goal setting, frequency of progress monitoring, and method of evaluating progress—affect the number of “instructional change prompts” generated by progress–monitoring data. An instructional change prompt occurs when CBM evaluation guidelines signal that students’ growth is unsatisfactory and instruction should be modified.
Goal setting refers to the amount of weekly growth that teachers establish as a minimum for adequate progress. For example, a teacher might set a goal of increasing growth by an average of one WRC per week. If measured growth matches or exceeds this goal, instruction continues as before, but if rate of growth falls below this level, teachers are prompted to modify the student's instructional program. Goals may be ambitious (e.g., 1.5 WRC growth per week) or modest (e.g., 1.0 WRC growth per week). Some research suggests that aiming for ambitious goals encourages teachers to make more instructional changes and more importantly helps students to greater gains (Fuchs, Fuchs, & Hamlett, 1989b).
Although goal setting is ordinarily left to teacher discretion, normative growth rates provide guidance in selecting goals for growth rates in reading. Deno, Fuchs, Marston, and Shin (2001) reported that, in typical special education programs, the average R–CBM growth was. 58 words per week and this growth rate was relatively stable across grades 2–6. However, Deno et al. noted substantially higher average growth rates (1.39 words per week) in special education programs that delivered “validated treatments” and recommended that teachers aspire to the more ambitious goals associated with such treatments.
Of course, as goal ambitiousness increases, so does the number of students whose growth will be considered inadequate and consequently the number of instructional change prompts that will be generated. We know little about the number of change prompts that different goal levels are likely to generate. This is an important omission because the level of goal ambitiousness will at some point result in an unsustainable number of change prompts.
In this study, we examined three levels of goal ambitiousness: 0.5 WRC gain per week (the average growth rate of typical special education students), 1.0 WRC gain per week (the overall average growth rate of general education students), and 1.5 WRC gain per week (the average growth rate of special education students receiving validated treatments) (Deno et al., 2001). Our research question was not whether more ambitious goals would generate more instructional change prompts, but rather how many instructional change prompts would be generated by different levels of goal ambitiousness.
The second variable of interest in this research is frequency of progress monitoring/evaluation—that is, how often teachers monitor progress and evaluate growth rates. Deno and Mirkin (1977) created CBM to assist teachers in making timely changes to instruction. Research has not established an optimal frequency of progress monitoring, and recommendations have varied from “daily if desired” (Deno, 1985, p. 228), to “at least three times per week” (Mirkin et al., 1981, p. 111), to “twice each week” (Fuchs, Fuchs, & Hamlett, 1989a, p. 166), to weekly or biweekly (Deno, Lembke, & Reschly, n.d., p. 14), to every 3 or 4 weeks (Jenkins et al., 2009).
Both instruction and progress monitoring require time, a finite resource. Teachers can increase time for instruction with a more economical approach to progress monitoring. For example, if progress monitoring were to occur once every 8 weeks instead of once every 4, 2, or 1 weeks, it would reduce the time needed for assessment by 50 percent, 75 percent, and 88 percent, respectively. Of course, if progress monitoring is too infrequent, its benefit is lost. Hence our second research question—relative to a biweekly schedule of progress monitoring, do leaner monitoring schedules generate a comparable number of instructional change prompts? To examine this question, we compared the effects of three progress monitoring/formative instruction schedules—every 2, 4, or 8 weeks—on the number of instructional change prompts they generated. In addition, we examined the consistency with which different monitoring schedules generated change prompts for the same students. For example, if monitoring progress every 2 weeks generated a change prompt for a student, did monitoring progress every 4 or 8 weeks also generate a change prompt for that student?
The third variable examined in this research is the method of evaluating students’ progress. The conventional R–CBM method for evaluating progress is to compare students’ recent scores to an “aim line” representing a desired growth rate (Stecker, Fuchs, & Fuchs, 2005). As a guideline for instructional decision making, Deno et al. (n.d.) recommended that teachers collect baseline data, set a progress goal, monitor progress weekly or biweekly for 6 weeks, and evaluate the adequacy of progress according to the following rule, “If three consecutive data points fall below the goal line, make an instructional change in the student's program” (p. 24). We refer to this as the “points–below” guideline.
The points–below rule combines what is essentially a proxy for linear growth slopes and a rule of thumb for comparing slopes with growth goals. Today with advances in computational software, teachers can directly model students’ growth rate, or slope, rather than relying on a points–below proxy. For example, a slope (e.g., 0.80) that falls short of an established growth goal (e.g., 1.0 WRC growth per week) would generate an instructional change prompt. We refer to this as the “slope” guideline.
How these two methods of evaluation affect decision making is uncertain; thus, our interest was in comparing the points–below and slope rules on the generation of instructional change prompts. Finally, we were also interested in examining the possible interaction effects of the three study variables—goal setting, progress monitoring schedule, and method of evaluation.
Method
Participants
Thirty–one students (18 males) receiving special education from eight schools situated in four school districts in urban and suburban neighborhoods of a metropolitan area of the northwest United States participated in this study. We asked each special education resource teachers to select three to four students who were receiving reading instruction in their program, who could read at least first–grade text and whose reading we could monitor for an 8–week period. The sample consisted of 2 second–graders, 15 third–graders, 3 fourth–graders, 10 fifth–graders, and 1 sixth–grader that received reading instruction in resource rooms. Records of disability classification, IQ scores, and qualifying achievement tests of these students were unavailable because our permission request did not include file information; however, all participants received special education in the area of reading and were reported by their special education teachers to have a learning disability. All but 7 of the 31 students were monitored on passages that were one or two levels below their nominal grade levels (described later).
Baseline oral reading levels of 27 of the 31 students fell into the Dynamic Indicators of Basic Early Literacy Skills (DIBELS; Good & Kaminski, 2002) At Risk category for their respective grade levels. The other four, all of whom were monitored on passages below their nominal grade level, fell into the low end of DIBELS’Some Risk category, missing the At Risk benchmark by a mean of 4.75 WRC.
Passages
Reading progress was monitored conventionally using standard CBM passages. For each participant, 13 passages were randomly selected from each of the 20–passage grade–level sets that DIBELS provides for progress monitoring. Student and examiner versions of each passage were provided. Examiner versions displayed a word count in the right–hand margin. Further details are described in the Procedures section.
Training and Reliability
Examiners were graduate students enrolled in a special education teacher certification program. The examiners were trained in the administration and scoring of the R–CBM in a 2–hour workshop conducted by the researchers. They were given step–by–step written and verbal directions detailing assessment and scoring procedures. Examiners practiced these procedures in pairs under the supervision of the researchers until they could conduct the procedures reliably. Mean interscorer agreement, calculated on 30 percent of the protocols in this study, was 98 percent. Percent agreement was calculated as the lower WRC score in a paired observation divided by the higher WRC score.
Design
In a 3 × 3 design, we examined three independent variables: goal setting/ambitiousness (0.5, 1.0, or 1.5 WRC growth per week); monitoring/evaluation frequency (every 2, 4, or 8 weeks); and method of evaluation (points–below rule or slope rule). The dependent variable in this research was the number of instructional change prompts that would be generated under the various conditions from students’ CBM data during an 8–week period.
Procedures
In the third week of the school year, special education resource teachers selected three to four students for progress monitoring and provided an estimate of students’ reading level. Using these estimates, we assigned 13 passages for each student from the pertinent DIBELS grade level set. All but seven of the students were monitored on passages that were one or two levels below their nominal grade levels. Order of passage administration was unique for each student (i.e., at each measurement point, examiners randomly selected passages from a set designated for the student). In the first week of the study, students were administered four baseline passages, then two passages every 2 weeks until the 8th week, when three passages were given as a final measurement. At each measurement point, multiple passages were administered in one sitting.
Testing procedures were standardized. The examiner introduced the assessment with the following scripted instructions: “I want to do a short reading check with you today. I'm using a timer to remind me how long I need to listen. When I say ‘please begin’ start reading aloud.” (Examiner demonstrates by pointing to the first word in the passage.) “Your job is to try to do your best reading. Do you have any questions? (Pause) Ok, please begin.” The examiner began timing when the student read the first word of the passage and continued for 1 minute, marking on another copy of the passage (shielded from the student) the errors and the last word read. Conventional CBM error definitions were employed (Deno & Mirkin, 1977), and included mispronounced words, skipped words, and hesitations longer than 3 seconds. Repetitions, self–corrections, and insertions were not considered errors.
Analysis
Points–Below Guideline
At each scheduled measurement, we calculated the student's median WRC score, consistent with the convention in CBM practice of using medians when multiple scores are collected at once. For the weeks that students’ progress was monitored with two passages, a student's median score was also equivalent to the mean score. Graphs for each student were generated for the three monitoring schedules: every 2, 4, and 8 weeks. We then overlaid each graph with three separate goal lines, reflecting the three levels of goal ambitiousness 0.5, 1.0, and 1.5 WRC weekly gains. This resulted in nine graphs for each student. To illustrate, for the every 2–week schedule, three separate graphs were generated for each student, one graph for each of the three levels of goal ambitiousness—0.5, 1.0, and 1.5—showing the student's performance in relation to the associated aimline. For each of the nine combinations of monitoring schedules and goal levels, we applied a points–below decision rule to determine whether a student's progress scores generated an instructional change prompt.
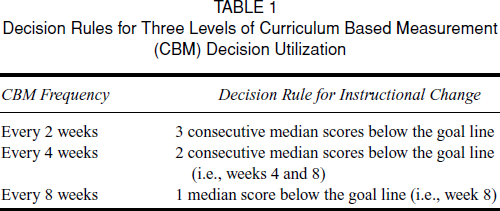
For the every–2–week measurement/data evaluation schedule, we used Deno et al.'s (n.d.) recommendation for the points–below decision guideline for this schedule. Because data evaluation guidelines had not been developed for 4– and 8–week progress monitoring schedules, we created evaluation rules using scores from the available measurement points to determine whether progress was adequate. Like the points–below guidelines established for other measurement/evaluation schedules (e.g., Stecker et al., 2005), our guidelines emphasized students’ most recent scores. Table 1 shows guidelines for the points–below evaluation method that define when an instructional change prompt is generated. For example, an instructional change prompt for the every–4–week evaluation guideline required that two consecutive scores (i.e., at weeks 4 and 8 in the present study) fall below the aimline.
Decision Rules for Three Levels of Curriculum Based Measurement (CBM) Decision Utilization
Slope Guideline
For each student, we calculated least squares slopes using the scores provided by each of the three monitoring schedules (i.e., every 2, 4, and 8 weeks). This resulted in three slopes per student. Note that, in calculating slope, the middle score for the every–4–week schedule does not enter into the calculation, meaning that slopes for the every–4–week and every–8–week schedules are identical. We then determined whether students’ slopes satisfied the growth goal for each of the nine combinations of monitoring schedules and levels of goal ambitiousness. Slopes that did not meet or exceed the target goal level generated an instructional change prompt. For example, student 5's calculated slope of 1.68 for the every–2–week monitoring evaluation schedule exceeded all three levels of goal ambitiousness and thus generated no instructional change prompts. However, his calculated slope of 0.88 for the every–8–week schedule generated instructional change prompts for two of the three goal levels (1.0 and 1.5), but not for goal level 0.5.
Results
Weekly Growth
Table 2 shows the sample's means and standard deviations for CBM scores at each measurement point. The mean WRC score showed an increase at each measurement point. To describe growth, ordinary least squares slopes were calculated for each student then averaged for the sample, yielding mean slopes of 1.67 for the every–2–week schedule (SD= 1.60) and 1.48 for the every–4 and –8–week, schedules (SD= 1.52). As expected, the biweekly and 8–week slopes were highly correlated,. 92, p <. 001, and a dependent sample t test comparing the mean slopes (biweekly vs. 4 weeks and 8 weeks) was not significant, t(30) =. 106, p >. 10.
Means and Standard Deviations for Baseline and Biweekly Words Read Correctly Scores
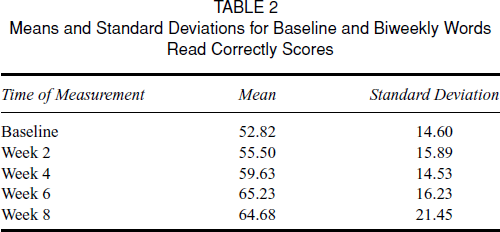
The mean of the every–8–week slope was calculated for the students in the two grade levels that had a large enough sample to consider—grade 3 (n= 15) and grade 5 (n= 10)—revealing slopes of 1.29 for grade 3 and 1.63 for grade 5.
Percent of Sample Generating Instructional Change Prompts
Table 3 shows means and standard deviations of the percent of the sample that received change prompts for each combination of treatment factors. Rather than reporting results for the number of change prompts generated, we instead report the percent of the sample receiving change prompts under the various conditions, thereby eliminating the task of dividing number of prompts by 31. We submitted the change prompts generated by each student to a 3 (frequency of monitoring/evaluation) × 3 (level of goal ambitiousness) × 2 (method of evaluation) analysis of variance with repeated measures on all factors. This approach to analysis has proven robust for dichotomous data and has the advantage of testing interaction effects (Hsu & Feldt, 1969).
Mean Percent of Instructional Change Prompts Generated by Points–Below and Slope Guidelines for Goal Ambitiousness and Monitoring/Evaluation Frequency
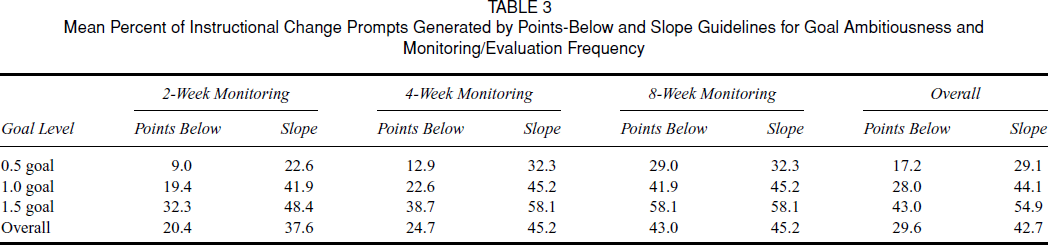
Results of Greenhouse–Geisser tests showed a significant effect for the goal–setting condition, F(1.70, 50.892) = 13.038, p <. 001 (η2=. 30), with an increase in the number of change prompts as a function of goal ambition. The percent of the sample receiving change prompts was 23, 36, and 49 for goal levels of 0.5, 1.0, and 1.5, respectively. Follow–up pair–wise t tests to locate differences between goal levels showed a significant difference between the number of change prompts generated by goal levels 0.5 and 1.0 and between the number generated by goal levels 1.0 and 1.5, in both cases t(30) = 2.87, p=. 007.
The interaction effect of frequency of monitoring by method of evaluation was also significant, F(1.933, 57.988) = 4.266, p=. 02 (η2=. 124). Follow–up pair–wise t tests showed the slope method of evaluation generated significantly more change prompts than were generated by the points–below evaluation method for both the every–2–week (p=. 012) and every–4–week (p=. 001) monitoring schedules, but that the two evaluation methods did not significantly differ in the change prompts generated for the every–8–week monitoring schedule. This was due to the consistently high percentage of prompts generated for the slope evaluation method across monitoring schedules. By contrast, the points–below method showed a sharp and significant increase in change prompts generated from the every–2–week to the every–8–week schedule, t(30) = 2.57, p =.015, and from the every–4–week to the every–8–week schedule, t(30) = 2.97, p =.006. Figure 1 illustrates these patterns. Neither of the other two–way interactions nor the three–way interactions was significant, all Fs < 1.0.
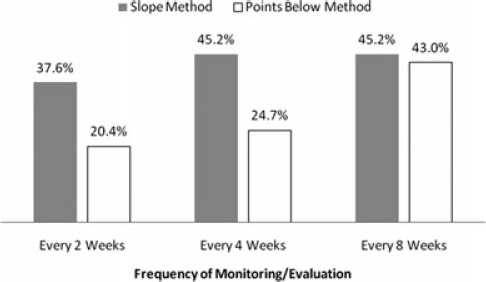
Percent of sample receiving change prompts for monitoring schedules and methods of evaluation.
Consistency of Change Prompts from More and Less Frequent Monitoring
We next examined whether students who received a change prompt based on a relatively frequent monitoring schedule (e.g., every 2 weeks) also received a change prompt based on a less frequent monitoring schedule (e.g., every 4 weeks or every 8 weeks). Table 4 shows the consistency of change prompt generation from more and less frequent monitoring schedule, using the points–below evaluation method. Except for the least ambitious goal condition (0.5), most students who received a change prompt under a more frequent monitoring schedule also received a change prompt under a less frequent monitoring schedule. For the 1.0 goal level, 67 percent of those receiving a change prompt with every–2–week monitoring also received a change prompt with every–4–week and every–8–week monitoring. Results for the every–4– and every–8–week schedules were remarkably consistent with 100 percent of those receiving a change prompt with every–4–week monitoring also receiving a change prompt with every 8–week monitoring, regardless of goal level.
Percent and Number of Sample Receiving a Change Prompt from Every 2–Week Monitoring that Also Received a Change Prompt from Every 8–Week Monitoring (Points–Below Method)
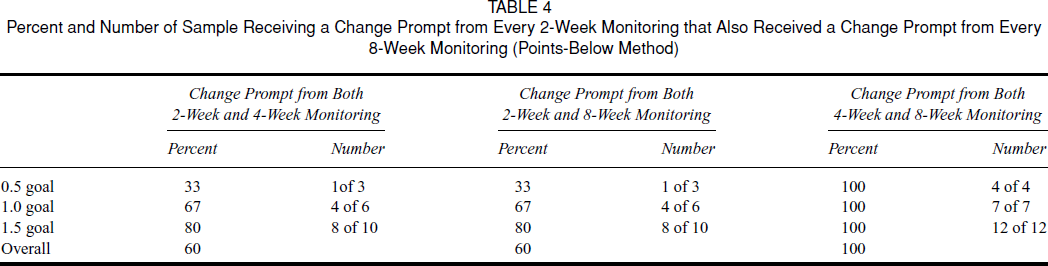
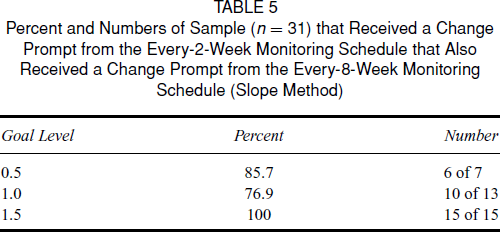
Table 5 shows that even greater consistency is observed between more and less frequent monitoring when evaluation is conducted using slopes. Depending on the growth goal employed, results showed that between 77 and 100 percent of those receiving a change prompt under every–2–week monitoring also received a change prompt under every–8–week monitoring. (Note that results are not shown for the every–4–week slope, as they are identical to those using the every–8–week slope.)
Percent and Numbers of Sample (n= 31) that Received a Change Prompt from the Every–2–Week Monitoring Schedule that Also Received a Change Prompt from the Every–8–Week Monitoring Schedule (Slope Method)
Finally, we checked whether the slope evaluation method detected those students who received a change prompt according to the points–below evaluation. The result showed that slope detected unsatisfactory growth in nearly every case that the points–below signaled unsatisfactory growth. For example, in 100 percent of the cases that the points–below method yielded a change prompt from monitoring every 4 weeks or every 8 weeks, the associated slope method also generated a change prompt. And, in 80–83 percent of the cases employing either the 1.0 or 1.5 goal levels in which the points–below method signaled a change prompt based on an every–2–week monitoring schedule, the every–2–week slope method also generated a change prompt. The single exception to consistency occurred with the lowest goal level (0.5) in combination with every–2–week monitoring, where the slope method detected only one of the three students for whom the points–below method signaled a change prompt.
Discussion
This investigation targeted three procedural aspects of CBM: goal setting, monitoring/evaluation frequency, and method of evaluation. All three variables significantly affected the generation of instructional change prompts. We discuss effects on both the relative and absolute number of change prompts generated by the procedural variations. But first, we note the overall growth rate of the sample.
Mean Growth
Across 8 weeks of monitoring, the sample registered a mean growth slope between 1.48 and 1.67 WRC per week, depending on whether only baseline and week 8 scores or all scores were used in the slope calculation. These growth rates are in line with Deno et al.'s (2001) finding of 1.5 WRC per week for students served in research–validated programs. Consistent with other research on frequency of progress monitoring (Jenkins et al., 2009), slopes from the every–2–week and every–8–week monitoring schedules were similar in magnitude and highly correlated.
Goal Ambitiousness
The effects of goal ambitiousness are straightforward, uncomplicated by interactions with either monitoring frequency or method of evaluation. Collapsed across the other conditions, instructional change prompts were generated for 23, 36, and 49 proportions of the sample for goal levels 0.5, 1.0, or 1.5 words per week, respectively. Differences were significant between every level. This result is consistent with the idea that more ambitious goals result in more students performing below their teachers’ aspirations and more prompts to change instruction.
Generation of instructional change prompts is also affected by the relationship between the goal that is set and students’actual growth rates. The sample of students in this research gained an average of approximately 1.5 words per week, much higher than the. 58 gains reported for students in special education programs (Deno et al., 2001). Had our sample averaged the growth rate reported by Deno et al. (2001) of. 58 words per week, many more change prompts would have been generated for every level of goal ambition.
Setting more ambitious goals may serve to prod teachers to revise instruction more often; conversely, setting less ambitious goals may seduce teachers to settle for weak growth (Fuchs et al., 1989b). Of course, there are limits to the generalization that higher goals lead to higher achievement. Unrealistically high goals will result in judgments of unsatisfactory growth week after week and produce a series of instructional change prompts that may lead to unneeded, perhaps even detrimental instructional changes. In selecting growth goals, teachers face a Goldilocks’ dilemma—choosing goals that are neither too low nor too high, but just right.
Monitoring Frequency and Method of Evaluation
Even though monitoring/evaluation frequency and method of evaluation both registered strong main effects, their influence was intertwined in important ways, as depicted in Figure 1. Consider first the pattern of results for the three monitoring schedules within each evaluation method. With the points–below evaluation method, twice as many change prompts were generated from monitoring every 8 weeks as were generated from monitoring every 2 weeks (43 percent vs. 20 percent). By contrast, with the slope evaluation method, the three monitoring schedules generated change prompts for similar proportions of the sample (38–45 percent).
Why did slope evaluation yield a similar number of change prompts across the different monitoring schedules? The answer lies in the aforementioned similarity of the growth slopes (1.48 and 1.67) generated by the every–2–week and the every–8–week schedules, respectively. With the slope evaluation method, generation of change prompts is a simple function of goal and slope—the steeper the slope, the fewer instructional change prompts. If two monitoring schedules yield similar slopes, they generate similar numbers of change prompts, as shown in the results for every–2, –4, and –8–week monitoring. By contrast, the points–below proxy yielded poor matches to students’ actual slopes under the every–2– and every–4–week monitoring/evaluation schedules.
In judging the relative validity of the different methods of evaluation, we place greater confidence in slope as an index of growth, given its mathematical properties along with the fact that slope evaluations yielded consistent information across different monitoring schedules. Moreover, for all but one of the nine combinations of monitoring schedule and goal level, slope evaluations detected 77–100 percent of the students for whom the points–below evaluation also generated a change prompt. That is, slope evaluation captures the relevant progress information derived from points–below evaluation and in addition identifies other students whose growth is unsatisfactory. Examined in this light, the points–below method may significantly overestimate the progress of some students that are monitored every 2 weeks or every 4 weeks.
What conclusions can be drawn from the findings that (1) an evaluation method with stronger mathematical properties yielded results differing from those obtained from a method that uses a proxy for estimating growth, (2) slopes generated from the three monitoring schedules were highly correlated, and (3) monitoring every 8 weeks identified most of the students that more frequent monitoring/evaluation detected as requiring a teaching change? The findings suggest that teachers may be better served by slope evaluation, regardless of the monitoring schedule chosen. Results also suggest that monitoring progress as infrequently as every 8 weeks may be sufficient. However, we are reticent to generalize broadly until results are replicated with other samples and longer studies.
Implications for Practice
Successful teachers theorize about their students’ instructional needs (e.g., decoding, reading by sight, vocabulary, comprehension strategies) and design lessons consistent with their analysis—allocating lesson time differentially. CBM progress monitoring is meant to help teachers determine whether students are benefiting sufficiently from instruction and when instruction should be adjusted. Exactly how instruction should change is left to teachers’ judgment—whether to allot more time to instruction, redistribute instruction to other aspects of reading, revisit motivational procedures (e.g., rewarding diligence, providing more interesting text for instruction), or redesign the general instructional approach (e.g., perhaps emphasizing the sociocultural meaning and purposes of literacy). Both the analytic work and instructional redesign are labor intensive, requiring significant time and attention.
For these reasons, many teachers regard frequent progress monitoring as impractical in light of competing demands on their time—serving large caseloads, scheduling and instructing, managing paraprofessionals, consulting with colleagues and parents, and fulfilling paperwork requirements. In attempting to explain findings that special education teachers implemented few instructional changes even though student progress was inadequate, Skiba, Wesson, and Deno (1982) speculated:
…special education teachers, accustomed to making few changes in educational plans, find making frequent changes in the instructional plan based on graphed data to be in conflict with their current mode of teaching. Further, the teachers may well be doing all that they know how to do to teach reading and may not have a repertoire of alternative tactics from which to draw. Finally, few prompts or reinforcers are available for making changes. In fact, making changes may increase work—a punishment contingency (p. 17).
Given Skiba et al.'s (1982) analysis, consider how the procedural variations examined in this study might play out, generalizing from our results. The actual number of change prompts generated will vary according to the level of goal ambition, monitoring schedule, evaluation method, and students’ actual progress. Depending on specific combinations of these three variables, a teacher managing a caseload of 30 students could receive between 3 and 17 change prompts in an 8–week period. At what point does the number of change prompts outstrip a teachers’ capacity to reformulate instruction and what kind of supports will teachers need to be responsive?
Teachers will vary in their ability to keep pace with different numbers of change prompts and in their expectations of how much growth is enough. Understanding the ramification of different procedural variations for goal setting and monitoring frequency should help teachers as they design progress–monitoring routines. Ascertaining whether various combinations of goal ambitiousness, monitoring frequency, and methods of evaluation break the sustainability threshold will require further study.
Limitation of the Research
Three study features limit generalizability of our findings. First, the duration of this study is fairly short, conducted over a period of 8 weeks. For Shapiro and Clemens (2009), 8 weeks is the minimum interval for evaluating response to intervention, although other CBM authorities allow for shorter evaluation intervals (Stecker et al., 2005). Second, the finding that an every–2–week monitoring/evaluation schedule was no better than an every–8–week schedule cannot be generalized beyond an 8–week period. Consider a hypothetical situation in which students’ growth appears adequate at week 8, but no longer adequate at week 10. In such cases, an every–2–week measurement schedule would signal a teaching change several weeks earlier than would a monitoring schedule that did not measure again until week 16. Whether this hypothetical situation occurs with any frequency is unknown. Third, the growth rate of our sample, which exceeded some of the rates reported in the special education literature, must be taken into account. The growth rate could be representative of contemporary evidence–based special education services. Alternatively, at the beginning of the school year growth may appear stronger because students are reacquiring skills that were unused during summer vacation. Or, the growth rates could be an artifact of the student selection process in which teachers nominated students for monitoring. Regardless, research is needed with additional teachers and student groups, studied for a longer period and yielding a clearer picture of variations in approaches to progress monitoring.
In conclusion, our results suggest that, within an 8–week period of instruction, the manner that teachers set goals, monitor progress, and evaluate growth will strongly affect the number of change prompts they receive. Research is needed on the number of instructional change prompts teachers can realistically manage and the support teachers must be afforded to respond effectively to change prompts. Foremost, finding a balance between maximizing students’ achievement and teachers’ capacity for program modification is critical.