
Abstract
This article presents a meta–analysis of experimental and quasi–experimental studies in which intermediate and secondary students with learning disabilities were taught science content through the use of graphic organizers (GOs). Following an exhaustive search for studies meeting specified selection criteria, 23 standardized mean effect sizes were extracted from six articles involving 271 participants in grades 6 through 12. Findings included that, across immediate posttest and maintenance conditions, the use of GOs was associated with increased vocabulary knowledge and factual comprehension measured by researcher–generated multiple–choice tests in science. Conclusions, implications for future research, and practical recommendations are presented.
All students face heightened academic demands in content area classes as they enter intermediate and secondary grades (Fletcher, Lyon, Fuchs, & Barnes, 2007). Intermediate and secondary content area curricula include increasingly complex material and abstract concepts that require students to use higher–order processing and comprehension skills (Dexter & Hughes, 2011; Gajria, Jitendra, Sood, & Sacks, 2007; Hughes, Maccini, & Gagnon, 2003). Furthermore, the presentation of content area material relies more on didactic lecture and expository text than in primary grades (Minskoff & Allsopp, 2003).
These increased demands are clearly evidenced in intermediate and secondary science classrooms. Scientific reasoning in the classroom requires students to rely more heavily on inductive and deductive thinking, skills that are often difficult for students (Mastropieri, Scruggs, Boon, & Carter, 2001; Mastropieri et al., 2006). Additionally, intermediate and secondary science text relies on complex structure that is often conceptually dense and filled with unfamiliar, technical vocabulary (see Mason & Hedin, this issue). While these factors present academic hurdles to all students, they are particularly challenging for students with learning disabilities (LD).
According to data from the National Assessment of Student Progress (NAEP; U.S. Department of Education, 2009), only 11 percent of students with LD were at or above the proficient level for science compared to 35 percent of nondisabled peers in eighth grade. Further, 66 percent of students with LD were at or above the basic level for science compared to 33 percent of nondisabled peers in eighth grade. These troubling percentages are also reported in the science results of the NAEP for twelfth grade (U.S. Department of Education), where only 6 percent of students with LD scored at or above the proficient level and 70 percent scored at the below basic level, compared to 24 percent and 37 percent, respectively, for their nondisabled peers.
It is abundantly clear that students with LD need assistance with science content. This issue has served as the basis for several approaches and strategies for assisting students with LD to better access the science curriculum. One content enhancement that has often been recommended as an instructional device to assist students in understanding increasingly abstract concepts is a graphic organizer (GO; Bos & Vaughn, 2002; Dexter, 2010; Dexter & Hughes, 2011; Kim et al., 2004; Nesbit & Adesope, 2006; Rivera & Smith, 1997).
What are Graphic Organizers?
GOs are visual and spatial displays that make relationships more apparent between related facts and concepts (Gajria et al., 2007; Hughes et al., 2003; Kim et al., 2004). They are intended to promote more meaningful learning and facilitate understanding and retention of new material by making abstract concepts more concrete and by connecting new information with prior knowledge (Ausubel, 1968; Mayer, 1979). While there is inconsistency in defining different types of GOs (Rice, 1994), we used the five general categories put forth by Dexter and Hughes (2011) to classify the science studies reviewed in this article:
Semantic Mapping
Semantic mapping (SM) is a heuristic that enables students to recognize relevant information from lecture and text (i.e., main ideas, important supporting details), delete isolated details that may not be relevant to overall understanding, and highlight key concepts that may have not been fully developed in a lecture or text (Bos & Anders, 1990). Typically, concepts are listed and the teacher and students make about the relationships between concepts (Bos & Anders, 1992). Those relationships are illustrated on the SM. A well–made SM consists of a superordinate concept (i.e., main idea, topic) placed in an oval in the middle or top of the page. Coordinate concepts (i.e., categories representing related concepts) are then placed in ovals surrounding or underneath the superordinate concept and connected by lines. Coordinate concepts can include a variety examples, functions, or characteristics of the superordinate concept. Finally, subordinate concepts (i.e., concepts representing the coordinate concept) are listed below each coordinate concept (Bos & Anders, 1990). Figure 1 provides an example of a completed SM GO.
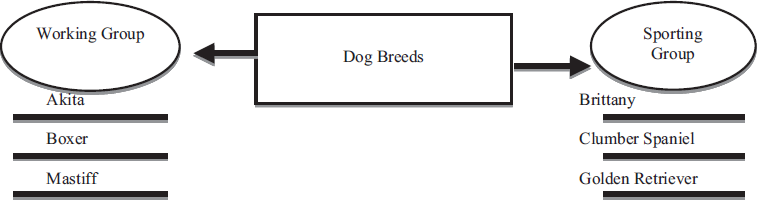
Semantic mapping example.
Semantic Feature Analysis
Semantic Feature Analysis (SFA) is similar to SM in that it helps students to recognize relevant information from lecture and text. This is done through a presentation of related concept characteristics in a matrix form. In SFA, unrelated concepts can be inferred directly from the chart (Darch & Gersten, 1986). Typically, a relationship matrix is constructed with words representing the coordinate concepts placed along the top of the matrix, and the words representing the subordinate concepts placed along the side (Bos & Anders, 1990) The teacher and students can then make predictions about relationships and later confirm those predictions (i.e., related, not related, not sure) between the coordinate and subordinate concepts (Bos and Anders, 1992). The superordinate concept serves as the title. Figure 2 provides an example of an SFA GO.
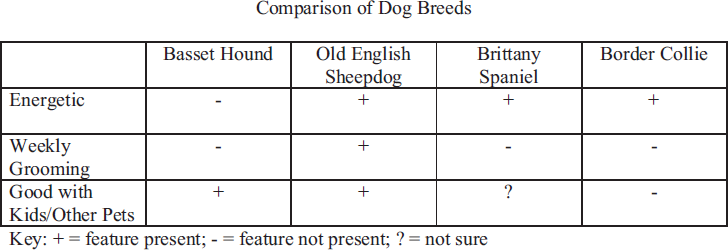
Semantic feature analysis example.
Syntactic/Semantic Feature Analysis
Syntactic/Semantic Feature Analysis (SSFA) is nearly identical to SFA with the addition of cloze–type sentences written on the matrix (Bos & Anders, 1990). Cloze sentences contain blank spaces replacing new vocabulary words. Students must use the context of the sentence and the SFA matrix to fill in the blanks. An example of an SSFA GO is found in Figure 3.
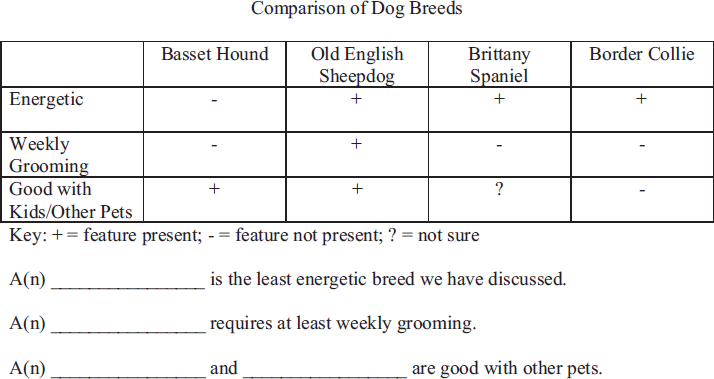
Syntactic/semantic feature analysis example comparison of dog breeds.
Visual Display
Visual displays present concepts or facts spatially, in a computationally efficient manner. That is, relationships between concepts are made apparent and clear by their location on the display. According to Hughes et al. (2003), in a visual display, facts or concepts are typically presented in one of five ways: temporal (e.g., timeline), spatial (e.g., decision tree), sequential (e.g., flowchart), hierarchal (e.g., taxonomy), or comparative (e.g., Venn diagram). An example of a comparative visual display GO is found in Figure 4.
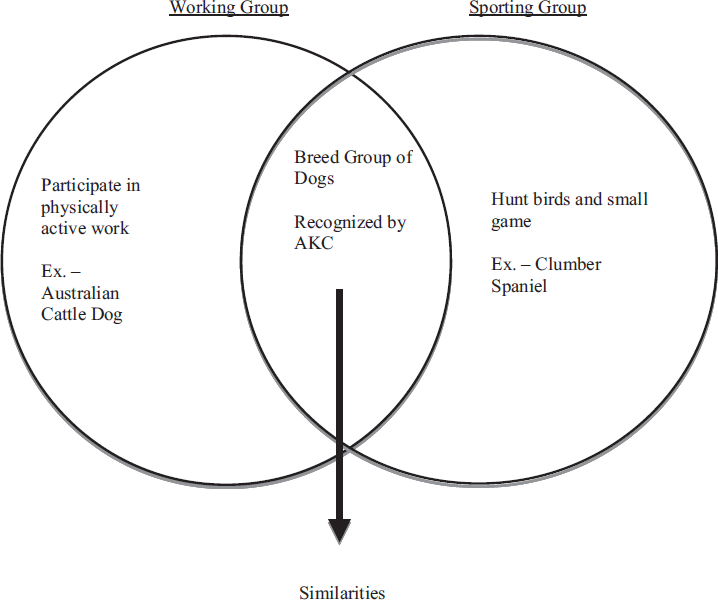
Visual display example.
Previous Research
A recent meta–analysis (Dexter & Hughes, 2010) and two research syntheses of school–aged children with LD (Gajria et al., 2007; Kim et al., 2004) have focused on GOs. In each of these reviews, GOs were found to have large effects on comprehension of vocabulary for secondary students with LD. The researchers attribute the effects, in part, to how GOs spatially group and connect concepts so readers are more likely to perceive them as being interrelated and to draw perceptual inferences about their relationships (i.e., computationally efficient). The way concepts are grouped and connected on the GO helps minimize the stress on working memory and allows better access to prior knowledge (Dexter & Hughes). While computationally efficiency should have direct implications to science content, it has not been formally analyzed.
Thus, we conducted a meta–analysis of GO research and science content to address the following questions:
What are the overall effects of GOs on posttest science performance of students with LD? Do these effects maintain over time? Are there differential effects by type of GO on posttest and maintenance science performance?
Method
A three–step process was used to identify studies using GOs with intermediate and secondary students (e.g., grades 6–12) with LD. First, we conducted computerized searches of the literature on science instruction using GOs for students with LD using the following electronic databases (e.g., PsycINFO, ERIC, and ProQuest) from 1980 to 2010. We used the following combination of descriptors: graphic org*, content enhance*, semantic map*, semantic org*, cognitive map*, cognitive org*, visual display, science, content–area, and learning disab*. Second, we conducted ancestral searches of identified articles, as well as the three most recent reviews of GOs used with students with LD (e.g., Dexter & Hughes, 2011; Gajria et al., 2007; Kim, Vaughn, Wanzek, & Wei, 2004). Finally, we hand–searched the following special education journals to locate the most recent literature: Exceptional Children, Journal of Special Education, Journal of Learning Disabilities, Learning Disability Quarterly, and Learning Disabilities Research & Practice. This process yielded a total of 11 published articles to analyze, several (i.e., seven) including more than one study.
Inclusion Criteria
We used five criteria to evaluate the appropriateness of each found study. First, the study had to include a GO as the independent variable and a measure of science material as a dependent measure. One article (Horton, Lovitt, & Bergerud, 1990) was excluded because specific science results could not be disaggregated, while another article (Lovitt, Fudsit, Jenkins, Pious, & Benedietti, 1986) was excluded because the independent variable was not a GO. Second, the study had to take place in intermediate and/or secondary level classrooms (e.g., grades 6–12). This grade range was selected because it is typically when curricula become more complex and students are required to learn primarily through didactic lecture and expository text presentation (Fletcher et al., 2007; Hughes et al., 2003; Minskoff & Allsopp, 2003). Two identified articles (Sinatra, Stahl–Gemake, & Berg, 1984; Williams, Stafford, Lauer, Hall, & Pollini, 2009) were excluded because the research took place in earlier grades.
Third, studies had to include experimental or quasi–experimental group designs with control groups (Lipsey & Wilson, 1993; Rosenthal, 1994). Additionally, the study had to provide sufficient quantitative information (i.e., group means and standard deviations; F statistic) to permit calculation of an effect size (ES). It was the intention of the authors to include description and review of other science GO studies (i.e., single–subject research studies, repeated measures studies, single–group studies, etc.), however, no such studies were located in our search.
Fourth, participants in the experimental and control groups had to include students with LD. As in previous reviews (e.g., Dexter & Hughes, 2011; Kim et al., 2004; Swanson, Hoskyn, & Lee, 1999), LD was defined as average intelligence and poor performance in at least one academic or related behavioral area. All participants were identified as students with LD in each of the included studies. One article (Guastello, Beasley, & Sinatra, 2000) was excluded because the experimental groups only included “low–achieving students.”
Finally, based on the recommendation of Slavin (1995), the study had to have been published in a peer–reviewed journal and in English. While this excluded any studies in Dissertation Abstracts International and unpublished studies from researchers in the field, this criterion increases the odds that only the highest quality research was included in this meta–analysis. The resulting potential publication bias (Lipsey & Wilson, 1993, 2001) will be discussed in the limitations section of this meta–analysis. The overall process yielded a total of six articles to be included in the analysis.
Study Coding
The second author coded pertinent study features including: participant characteristics (e.g., grade level, disability classification), type of GO, stated purpose, study contrasts, dependent measures, and reported findings. The first author then double–coded this information. Interrater reliability was 100 percent on each study feature.
Individual Effect Size Calculation
Using methods described by Lipsey and Wilson (2001), standardized mean difference effect size was computed using pooled standard deviation. To correct for upwardly biased effect sizes due to small samples, a Hedges correction (Hedges, 1981; Lipsey & Wilson, 2001) was utilized. According to Hedges, Shymansky, and Woodworth (1989), the inverse variance weight is a better approach to account for the sample size of a given study than the more simple approach of weighting by sample size. Extreme or outlying individual effect sizes (i.e., greater than 1.5 times the mean effect size; Burns, 2004) were not present.
Data Analysis
Following transformations, data were analyzed by computing the weighted mean effect size and the standard error of the mean effect size (Hedges & Olkin, 1985). The z–test for the weighted mean effect size was then computed by dividing the mean effect size by the standard error of the mean effect size. The z–test was used to compute the 95 percent confidence interval for the weighted mean effect size (Thompson, 2006).
Homogeneity Analysis
A Q–statistic was computed to test homogeneity. Homogeneity analysis tests whether the assumption that all of the effect sizes are estimating the same population mean is reasonable (Hunter & Schmidt, 2004). Furthermore, Lipsey and Wilson (2001) contend that single mean effect sizes by themselves are not sufficient descriptors of the distribution. Our significant Q–statistic allowed us to examine underlying effect sizes and we chose to fit a random effects model, which assumes sampling error, plus other sources of variability assumed to be randomly distributed (Lipsey & Wilson). The random effects model weights each study by the inverse of the sampling variance plus a constant that represents the variability across the population effects. This model provides a conservative estimate of differences between a moderating variables model and is appropriate for our analysis because we do not have a large number of effect sizes and the corresponding samples are relatively small (Hunter & Schmidt).
The preceding analyses were conducted for posttest measures and maintenance measures, and to uncover differential effects of GO type on science performance. Cohen's (1988) criteria for interpreting strength of effect sizes (small ES < 0.20, medium ES = 0.50, large ES > 0.80) were used to gauge the magnitude of the findings in this analysis.
Results
A total of 23 unique posttest effect sizes were extracted from studies in six published articles meeting our inclusion criteria. For the purposes of this analysis, each unique effect size was considered an individual estimate of effect. (Included articles are marked with an asterisk in the Reference section). In addition, five of the published articles included maintenance data rendering 20 additional unique effect sizes. Table 1 includes detailed information on each included study, participants, variables, measures, and individual effect sizes. Additionally, Table 1 and Table 2 delineate how many studies produced the reported effect sizes. For example, the five unique effect sizes for SM posttest were derived from three articles: two from the first article, two from the second article, and one from the third article. This leads to the possibility of certain studies differentially having an impact on the mean effect size. This will be discussed further in the methodological limitations section of this article.
Independent Variables, Dependent Measures, and Effect Sizes of Individual Science Experiments
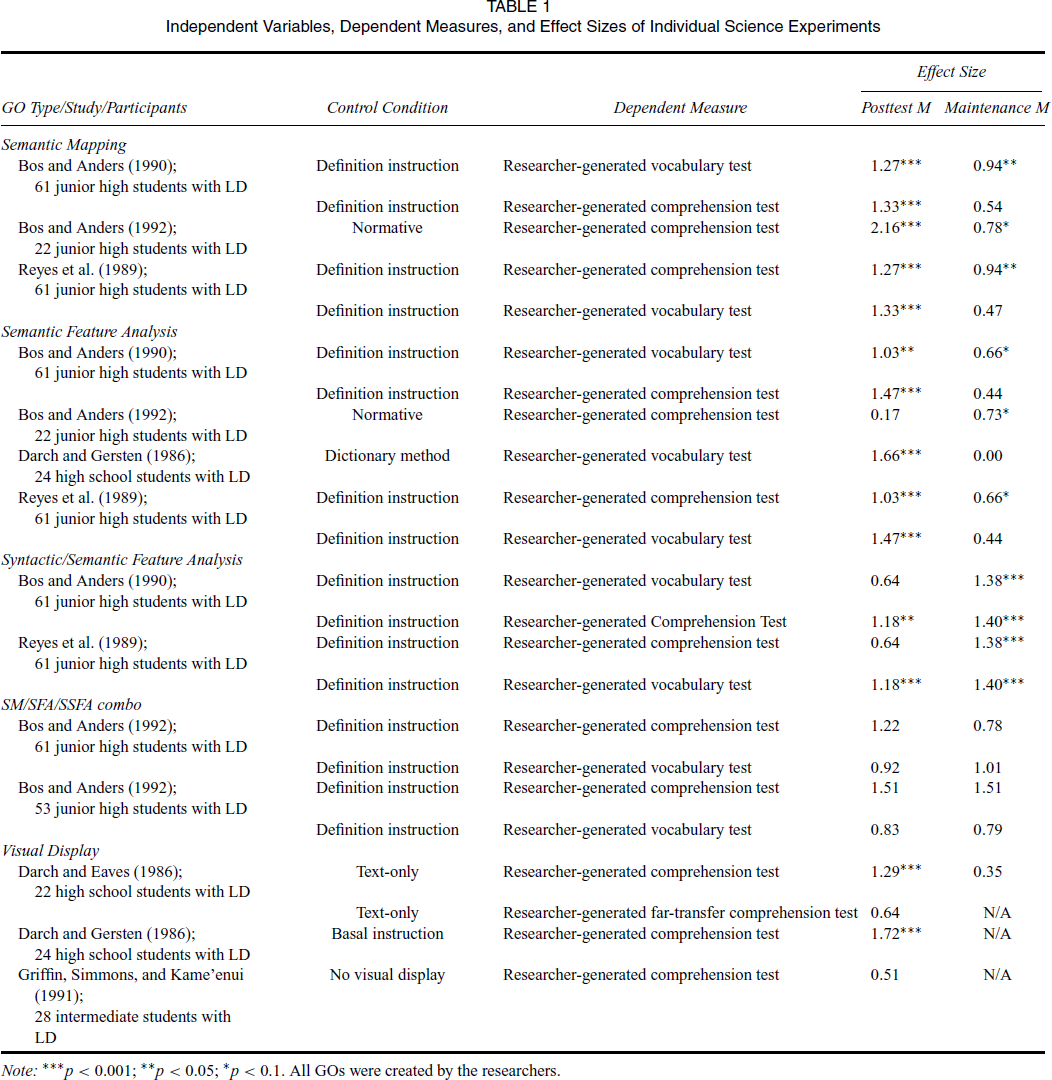
Note: ***p < 0.001; **p < 0.05; *p < 0.1. All GOs were created by the researchers.
Science Performance by Type of Graphic Organizer Random Effects Model
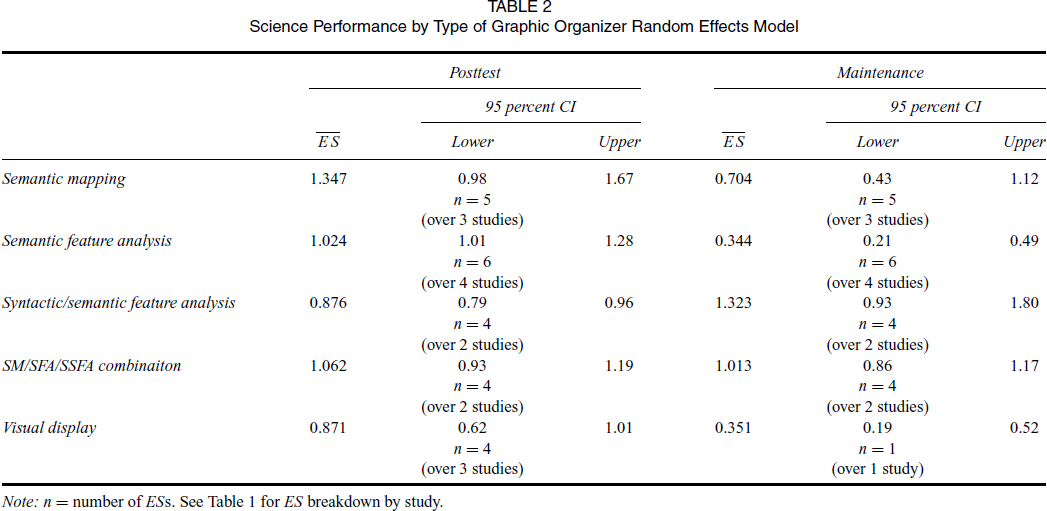


Note: n = number of ESs. See Table 1 for ES breakdown by study.
Instructional Context
Each of the studies included instruction on the use of a GO. Additionally, each of the included studies (Bos & Anders 1990, 1992; Darch & Eaves, 1986; Darch & Gersten, 1986; Griffin, Simmons, & Kame'enui, 1991; Reyes, Gallego, Duran, & Scanlon, 1989) incorporated aspects of direct, explicit instruction (e.g., modeling, prompted practice; Archer & Hughes, 2011) during group instruction.
Generally, instruction for the experimental groups included one to two sessions focused solely on how to use the GO, one to two sessions of prompted practice using the GO, and independent student use of the GO for the remainder of sessions. During the initial sessions the teacher or researcher presented the GO to students and described how it illustrated relationships. For example, Darch and Eaves (1986) presented their visual display via overhead projector and students followed along while the teacher followed a script to describe the various cells in the display and their interrelationships. The following sessions generally included the instructor explicitly guiding the students in creating or filling out the GO. For example, Bos and Anders (1990) explicitly prompted the students in each step of creating a hierarchical semantic map from a vocabulary list. This level of assistance was then gradually faded. For instance, Darch and Gersten (1986) first presented a visual display with all the cells labeled and prompted the entire group in answering questions about specific facts in the GO. The researchers followed this by guiding the students through a visual display that did not provide cell labels. Finally, individual students were prompted in labeling blank visual displays. Instruction in the remaining sessions generally focused on independent use of the GO by the students in addition to text or lecture presentations. However, in each of the visual display studies all of the content was presented solely through the GO.
Duration of each of the interventions lasted between 1 and 5 weeks with an additional 1–4 weeks between posttest and maintenance measures. All of the studies were conducted in a resource classroom during or after the school day.
What are the Overall Effects of GOs on Posttest Science Performance of Students with LD?
There was a large overall standardized effect of GOs on the posttest science performance (i.e., multiple–choice comprehension, multiple–choice vocabulary) of students with LD across all studies (ES = 1.052) and a 95 percent confidence interval of 0.88, 1.23 for the random effects model.
Do these Effects Maintain over Time?
Twenty effect sizes were calculated for maintenance. In each of the studies, measures consisted of multiple–choice comprehension or multiple–choice vocabulary items. These measures were given to students 1–4 weeks after the conclusion of the intervention studies. There was a large overall effect for maintenance across all studies ( = 0.8035) with a 95 percent confidence interval of 0.64, 0.97 for the random effects model.
Are There Differential Effects by Type of GO on Posttest and Maintenance Science Performance?
The types of GOs used in the studies matched with the definitions in the introduction to this analysis (e.g., SM, SFA, SSFA, visual display). However, in one article (Bos & Anders, 1992), the researchers used a combination of SM, SFA, and SSFA. The method they used to present their results prohibited disaggregation of the findings. Therefore, a sixth category (SM/SFA/SSFA Combination) was added to the analysis. Large posttest effects (e.g., 0.871–1.347) were found for all types of GOs on science content. There were no statistically significant differences between GOs with large posttest effects. For maintenance measures, SSFA and SM/SFA/SSFA combination had significantly larger effects than the other GO types (e.g., 1.323, 1.013). SM had a moderate effect for maintenance (e.g., 0.704), while each of the other GO types demonstrated small effects. Table 2 provides the full comparison between types of GOs.
Discussion
Findings from this meta–analysis indicate that GOs improve the factual comprehension and vocabulary knowledge of intermediate and secondary students with LD in science. Furthermore, the findings from this analysis also indicate that GOs help to facilitate maintenance of learned science material for students with LD.
What Are the Overall Effects of GOs on Posttest Science Performance of Students with LD?
Overall, there was a large mean effect for science posttest performance (ES = 1.052 for students with LD using the random effects model. Further, the lower band of the 95 percent confidence interval (e.g., 0.88) is also in the large effect range. These effects demonstrate the strong potential for GOs to help students with LD in learning certain types of science material. While immediate posttest performance was based on results from multiple–choice factual comprehension and multiple–choice vocabulary measures, the nature of the science material covered in the studies called for inductive thinking and inference from students with LD. This suggests that GOs are effective not only for improving basic skills (e.g., factual recall), but also for improving higher–level skills (e.g., inference). This finding is consistent with the theories of Ausubel (1968) and Mayer (1979) that GOs may especially assist struggling learners in both basic and higher level skills by creating an easier context to assimilate information into their memory. Additionally, the large effects in science may be explained by the unfamiliar, technical vocabulary, and content often based on relationships between concepts (Lovitt et al., 1986). This type of content lends itself to computationally efficient GOs that make relationships explicit and clear.
Do these Effects Maintain over Time?
There was a strong mean effect for maintenance (ES = 0.8035) of science content for students with LD, with the lower band of the 95 percent confidence interval (e.g., 0.64) falling in the moderate effect range. While significant drop–offs from posttest to maintenance have been reported in other GO research syntheses (e.g., Dexter & Hughes, 2011; Gajria et al., 2007), this finding demonstrates that, for science material, students with LD were not only able to learn new content for immediate posttest, but also to remember the content for longer periods of time. This finding is especially promising given the conceptually dense nature of science text (see Mason & Hedin, this issue). GOs may serve as a key to not only decoding, but also understanding this difficult text.
Are There Differential Effects by Type of GO on Posttest and Maintenance Science Performance?
Each of the GO categories (e.g., SM, SFA, SSFA, combo, visual display) had strong effects for posttest measures in science. While it is worth noting that consistent with findings from previous reviews of GO research (e.g., Dexter 2010; Dexter & Hughes, 2011) the most instructionally intensive GOs (e.g., SM, SFA) had the largest effects for posttest, it is promising that all GOs had strong effects regardless of type. This may suggest that the structure of GOs is particularly suited to science content.
There was more variability between types of GOs on maintenance of science material. The SSFA and combo GOs both had strong effects, while the others showed only small or moderate (e.g., SM) effects. A closer look at effects by type of GO shows the effect size for SSFA was actually larger for maintenance than posttest. This may lend support to the visual argument hypothesis (Waller, 1981) that posits that the structure of GOs easily facilitate understanding and perception of concept relationships and are superior to more complicated GOs that may require instruction to recognize conceptual relationships (Dexter, 2010). The SSFAs were more computationally efficient than the other GOs. That is, they were simple enough for students to recognize conceptual relationships through the GO itself without teacher instruction (Dexter & Hughes, 2011). This may explain why maintenance effects were larger for this type of GO. In previous reviews of the literature on GOs and students with LD (e.g., Dexter & Hughes), visual displays have also had stronger maintenance effects than posttest effects. Unfortunately, only one effect size was available for a visual display on science content. This small effect (0.351) may not be representative of the actual utility of a visual display on maintenance of science material.
Methodological Limitations
There are two methodological limitations to the current study. First, as suggested by Slavin (1995), we purposefully selected only published studies to ensure the highest quality of research designs. This creates the possibility of a publication bias because published articles have a larger mean effect size than unpublished studies (Lipsey & Wilson, 1993; Smith, 1980). To counter this potential bias, we used Rosenthal's (1979) fail–safe N statistic (adapted by Orwin, 1983) and determined that over 40 unpublished studies with null effects would be required to bring our reported mean effect to zero.
Second, our 23 unique effect sizes were gathered from only 6 published articles. While this is an acceptable practice (Lipsey & Wilson, 2001), it does limit the generalizability of the findings because there were only 6 distinct samples of students with LD (Total N = 271). Therefore, caution should be observed in generalizing these findings to all intermediate and secondary students with LD.
Individual Study Limitations
There are two limitations to the individual studies that warrant consideration. First, while each of the effect sizes in this analysis were based on differences between a treatment group and a control group, it was not clear if the control conditions provided an adequate standard to measure the effects of GO interventions (Gersten, Baker, & Lloyd, 2000). The control conditions in the included studies used primarily typical classroom practices (e.g., dictionary instruction) rather than more closely comparable practices (e.g., outlines, structured overviews, etc.). While this provides evidence for GO effects compared to typical classroom practice, it does not provide information for GO effects compared to other researched practices (Kim et al., 2004).
Second, while results indicate large effects for vocabulary and comprehension, it is important to note that all of the studies used measures that were researcher–created and closely tied to the content. While these measures should have good content validity, there is no way to measure broader construct validity. This fact may limit the generalizability of these findings and questions the actual level of understanding obtained by students in the GO conditions.
Implications for Practice
The major implication for applied practice is that GOs are effective for initial acquisition and retention of science content for intermediate and secondary students with LD. Furthermore, instructionally intensive types of GOs (e.g., SM, SFA) are better for immediate factual recall while more computationally efficient GOs (e.g., SSFA) are better for maintenance. This knowledge can help teachers in designing GOs for initial instruction and for re–teaching, studying, and retention purposes. For instance, a semantic map for initial instruction, followed by a simpler SSFA for review and study will potentially maximize the effects of recall and maintenance for students with LD.
Another implication for practice is that, regardless of GO type, a teacher must explicitly teach the students how to use the GO. Students with LD need explicit instruction to understand how concepts are related, to recognize differences between main and subordinate ideas, and to put all the pieces together to make a clear picture of the content being learned no matter how implicit a GO may seem. A teacher's use of effective instruction practices (i.e., modeling, corrective feedback, etc.) will positively impact the intervention's effectiveness (Archer & Hughes, 2011).
Conclusions and Implications for Future Research
This meta–analysis revealed that, in comparison with activities, such as reading text passages, attending to lectures, and participating in typical classroom practice (e.g., dictionary instruction), GOs are more effective for learning and maintenance of science material. However, this finding must be tempered due to several issues.
First, each of the studies took place in self–contained resource classrooms. This may not be typical for modern intermediate and secondary students with LD. The feasibility and practicality of GOs needs to be closely examined in general education science classrooms as many students with LD are now fully included with nondisabled peers in science class.
Second, there is great need for GO replication studies. The most current article in this meta–analysis was published 19 years ago! More current group design, randomized control trials are needed to fully validate the benefits of GOs across science classrooms for students with LD.
Finally, for student independent practice, it was not always clear from the studies if the GO was used correctly or at all. For instance, when students independently filled in a blank GO, there was no reported procedure for ascertaining if they were properly labeling main and subordinate details. Likewise, two of the studies (e.g., Bos & Anders, 1990; Bos & Anders, 1992) reported students had both a GO and text to study for the posttests. They did not include a procedure to make sure the students were actually using the GO to study. These students may have been using the text as their study guide. This lack of control may somewhat negate the attribution of effects to the GO. Future research must tightly control for these potential problem areas.
Taking the above issues into account, the evidence in this analysis still should persuade educational practitioners to make well–planned and well–instructed use of GOs for science content. There were no negative effects across any of the categories of analysis and no other identified detrimental effect. A thoughtful use of GOs will help make the learning process in the science classroom more efficient for intermediate and secondary students with LD.