
Abstract
This article examines the spatial distribution of all edifices of mainline, evangelical, and fundamentalist Protestant denominations and other religions in a Midwestern metropolis. Classic ecological theory holds that people minimize their travel costs by patronizing organizations closest to their residence. This has been generally verified for economic organizations, but not for churches that emphasize sentiment and noneconomic values. Since residential areas of American cities tend to be socioeconomically stratified and denominations and religions manifest a similar tendency, we predict a general convergence of church and member residential location. For seven tiers surrounding downtown that extend to the suburbs, rising house values accompany rising representation of mainline churches. The exurban zone exhibits the greatest diversity in the socioeconomic status of its residents and denominations. The inner city around downtown contains a higher and lower socioeconomic district for whites and African Americans. The denominational composition in all four districts conforms to the theory's predictions. Downtown churches are an exception to ecological theory because sentiment and family tradition pull members from the entire metropolitan region. We conclude that, with this exception, the convergence of church location, denomination, and member residence supports ecological theory for noneconomic organizations such as churches.
Introduction
Early in the twentieth century scholars began to study the association between the socioeconomic status of members of American churches, church location, and the location of their members’ residence. They used data from the U.S. Census of Religious Bodies (1926 and 1936) to plot the segregation of ethnoreligious groups (Jews and Catholic immigrants) in the city and the concentration of denominations (e.g., Lutherans and Catholics) in various regions of the country (see references in Queen and Thomas, 1939; Gist and Halbert, 1933). Niebuhr's early studies of Protestant denominations in Great Britain and United States also considered the convergence of the socioeconomic status of church members and denomination and religion in urban and rural communities as well as in regions. Recently, Finke and Rodney (1992) examined the relation between the demographic characteristics of early Christians and their migration patterns over the centuries.
The increasing spatial mobility of people over the years may have weakened the traditional link between church location and member residence (Blau, 1994, Ch. 7; Cadwallader, 1992, Ch. 2; Long, 1988, Ch. 2; Queen and Thomas, 1939, Ch. 18; South and Crowder, 1997). That is, churches may have become less spatially mobile than their members, thus lessening the convergence of church location and member residences. Yet, very few researchers have attempted to examine the extent of this convergence in the modern city (see the exception of Ebaugh, O'Brien, and Chafetz, 2000). Although contemporary human ecologists have explored the location of economic organizations with respect to the residence of their clients, they have virtually ignored religious organizations (Form and Dubrow, 2005). We use the term “church” to refer to the edifice of worship (temple, meeting hall, other).
To be sure, scholars have recently conducted case studies of churches in selected urban areas such as downtown (Form and Dubrow, 2005; Price, 2000), Catholic parishes (Fichter, 1954, Ch. 11), racially segregated urban areas (McRoberts, 2003), small towns (Stebinger, 2000), suburbs (Eisland and Warner, 1998; Winter, 1962), and exurbs (Ammerman, 1997; Eisland, 1999). Fruitful as these studies are, they have not applied systematic ecological theory that requires analyzing the distribution of all churches in a community and the socioeconomic features of the distribution. Our search for such studies uncovered only a few conducted decades ago (e.g., Douglass, 1927; Kinchloe, 1962).
Hawley (1950, 1968) based his theory of human ecology on biological ecology's approach to plant and animal communities where competition and the struggle for survival play the key role in determining habitat. Later, students of organization ecology (e.g., Hannon and Carroll, 1992; Hannon and Freeman, 1989) examined competition among organizations and their locations throughout their life cycles of birth, growth, stabilization, decline, and death. These ecologists typically studied economic organizations. Although churches also compete for members and resources, they differ from economic organizations in having to consider religious values and traditions in their location decisions. Firey (1947) studied land use in central Boston and noted that history, tradition, and sentiment played important roles in preserving the Boston Common and land uses around it. However, he did not consider the role that these variables play in determining the location of other institutions and agencies in other parts of the city. This would have been a more difficult challenge because people vary in the value they attach to land use (housing, schools, shopping centers, parks) in different parts of the community. Classic ecological theory attacks location exceptions like many economists attack price exceptions to Smithian supply–demand theory, as irrational or ignorant behavior. Simply put, few scholars have successfully integrated classic ecological and sociological theories. We purse two questions: Do the principles of classic human ecology generally explain the location of religious organizations (churches) in a metropolis? Where and to what extent do sentiment, values, and tradition also play a role?
We examine the spatial distribution of all churches in Columbus, Ohio, a metropolis of one and three–quarter million inhabitants. We classify the major subareas as downtown, the inner city, urban neighborhoods of varying wealth levels, suburbs, and the exurban fringe. The Protestant churches were classified as mainline (e.g., Presbyterian, Lutheran), evangelical (Church of Christ, Wesleyan), and conservative–fundamentalist (Southern Baptist, Pentecostal, Apostolic), according to the consensual practices of sociologists of religion (see Kellstedt and Smidt, 1996; Roof and McKinney, 1987, p. 110; Smith, 1990; Mead, 1995). These distinctions are largely based on the degree of belief in the Biblical text or on God's continuing revelations. Other churches (Roman Catholic, Greek Orthodox, place–named) were classified separately.
Church data were obtained from the City and County Directories, The Telephone Directory, Geographic Information Systems (GIS), a private business firm, and the Metropolitan Area Church Council (MACC), a church–supported information–gathering voluntary association. Since the lists disagreed on the number of churches in the city, their denominational–religious composition, and their type of locale, below we describe the differences, how we made the lists more accurate, and why we used different lists for different analytical problems. GIS provides only the church's name and its census tract in the city. The City and County Directories provide the church name and street address, but not its locale (city, suburb, township, rural). MACC provides the church name, street address, sometimes the locale, and the ZIP Code that ignores corporate boundaries.
We do not claim that Columbus adequately represents all 32 state capitols with population over 250,000 or that it represents all cities of its size. However, its metropolitan area has the characteristics needed for this study: hundreds of churches, a wide array of denominations, churches not affiliated with standard denominations, different religions, and churches associated with different racial and ethnic groups.
Expected Findings
Since a main principle of human ecology holds that organizations tend to be located in places that maximize access for their patrons to reduce their travel costs (Gist and Halbert, 1956, p. 116; Quinn, 1950), we generally expect churches to locate in residential areas that correspond to the socioeconomic characteristics of their members. As noted above, early studies showed that the adherents of different denominations were socioeconomically stratified (e.g., see Niebuhr, 1929; Swenson, 1999; Troeltsch, 1931; Weber, 1963) and this condition currently holds in the United States (Demerath, 1965, Ch. 4; Dynes, 1955; Gold, 2002, Ch. 10; Roof and McKinney, 1987, Ch. 4). Although the status levels of denominations and religious organizations change over time (Roof and McKinney, 1987, p. 110; Stark, 2004), our study is limited to Columbus today.
Other factors equal, we expect mainline Protestant churches to concentrate in areas of higher socioeconomic status of the city and the suburbs. Since suburbs generally are the most affluent parts of the metropolis, they should display the highest concentration of mainline churches (Winter, 1962). Since religious fundamentalism has generally characterized the poor, we expect the highest concentration of their churches to appear in the inner city where many poor whites and African Americans live (McRoberts, 2003). Evangelical churches, mainly derived from historical splits from mainline denominations, have tended to attract middle–class adherents and they should predominate where they reside. Catholics, always a minority in the United States, are mostly descended from nineteenth–century immigrants from northern Europe (Ireland, Germany) and twentieth–century immigrants from eastern and southern Europe (Poland and Italy). By the mid–1970s, they attained socioeconomic equality with Protestants. However, Catholic churches should predominate in working–class and middle–class areas because their rate of growth in the suburbs after 1970 lagged that of Protestants (D'Antonio et al., 1989, Ch. 21; Schlegel, 2001, p. 45). Also, the Catholic hierarchy has been reluctant to abandon parishes once they are established. Nonecological variables also play a limited role in determining church location as explicated below.
Downtown Or Central Business District (Cbd)
Downtowns (CBDs) of metropolises have been losing residents for years. Except for the affluent that live in luxurious apartments and condominiums, most downtown residents in Columbus fall below the metropolitan median in income (Form and Dubrow, 2005). Most CBD churches have not served local residents for years (Ammerman, 1997, p. 130; Ebaugh, O'Brien, and Chafetz, 2000, Ch. 3), but they do serve members who live in scattered areas of the metropolis. This fact violates the ecological principle that people minimize their travel costs by patronizing organizations close to their residence and supports the sociological principle that people will pay extra to support their traditions and values. That is, they pay the extra travel cost to worship with a more cosmopolitan congregation or because they value an historic church (Firey, 1947), a particular type of outreach or musical program, or family tradition. We expect these church–goers to be above the metropolitan median in socioeconomic status and more socially diverse than church members of similar socioeconomic status who attend neighborhood churches (Form and Dubrow, 2005). in addition, downtown often serves as a central location for edifices of denominations with only one or two churches whose members are residentially scattered: Unitarians, Christian Science, some ethnic–heritage churches (Greek Orthodox). This conforms to the ecological principle that a central location minimizes the collective travel costs of church members.
With these considerations in mind, we expect downtown churches to be primarily mainline, with a sprinkling of evangelical, and even fewer fundamentalist. Mainline churches have survived because they are the oldest churches in the city, have the most material resources, and have been able to respond to the needs of week–day downtown populations of employees, shoppers, downtown business clients, hotel guests, and poor transients, such as the homeless and mentally ill.
The Inner City
Early human ecologists characterized the area around downtown as a zone in transition (Park, Burgess, and McKenzie, 1925) comprised mainly of warehouses, small businesses, and housing for immigrants, poor whites, and African Americans. However, continuous metropolitan growth eventually created subareas stratified by race and class. in the prosperous post–World War II era, poor Appalachian whites and African Americans crowded into the inner city. in the 1970s, affluent childless white professionals began to move in, gentrifying areas that had the best original housing. It probably still has mostly mainline churches. in a section of the inner city where Appalachians settled, evangelical churches flourished and some may have survived. Where the African Americans settled, many small fundamentalist churches were established, died, and reestablished in an unending cycle.
Over the years, with continuing population growth, Appalachians began to move out and second–generation African Americans who experienced upward mobility moved into the vacated areas. in effect, this stratified the African American community ecologically. We hypothesize that in the poorer parts of the African American area, fundamentalist–conservative churches predominate and in the more affluent part, more evangelical churches appear. in sum, we hypothesize that over the decades, the inner city became stratified into four subareas: upper– and lower–white and upper– and lower–African American, each with a different mix of evangelical and fundamentalist–conservative churches.
Neighborhoods
Early ecological theory (Park, Burgess, and McKenzie, 1925) stipulated that the socioeconomic level of urban neighborhoods rises with distance from the inner city. Hoyt (1933) later showed that some higher–status sectors of the inner city expand unbroken into adjacent areas. Further, some of the early suburbs maintained their strict zoning laws and eventually became surrounded by working–class neighborhoods (Hunker, 2000, pp. 104–116). in these land–locked suburbs, we predict that mainline churches remain predominant. Apart from gentrified and land–locked suburbs, we hypothesize that, as the socioeconomic level of urban neighborhoods rises with distance from the central city, the proportion of fundamentalist churches declines and evangelical churches increase to a point and then decline as mainline churches again increase their representation. Like the mainline denominations, Catholic churches also survive downtown and in parts of the inner city. They also grew in urban neighborhoods, but lagged the rate of Protestant church growth in the suburbs (see above).
Another secular trend likely accompanied the post–World War II migration of Appalachians and African Americans into the growing Midwestern metropolises. With continuing population growth (Rossi, 1980, Ch. 5, 6), Appalachians moved out of the inner city into adjacent urban neighborhoods and suburbs. With upward mobility, many of them did not switch to the mainline denominations. This historical drift likely resulted in a declining proportion of mainline churches in the metropolis and a rising evangelical share. in addition, the growth of the African American community led to an increasing share of fundamentalist–conservative churches.
Suburbs
The continuous growth of metropolitan populations also resulted in an increasing variety of suburbs—African American, working class, middle class, and affluent (Baldassare, 1992, pp. 481–483). Some residents of older land–locked suburbs and their descendents also moved to the new outer suburbs (Wuthnow, 1979). However, the stable and aging residents of the inner suburbs retained their mainline churches while the newer suburbs, with their more heterogeneous residents, accommodated higher shares of evangelical and fundamentalist–conservative churches.
Exurbs
Some of the outlying areas of the metropolitan region are sparsely populated and have few zoning laws. The least–expensive land often displays mixed land uses (homes, farms, unfertile patches, woods) and attracts socially heterogeneous residents. The least–affluent migrants build basement houses to be finished later; contractors build starter homes for young couples who have few resources; still others build gated communities with their golf courses, ponds, and bridle paths for the affluent (Patterson, 1998). We hypothesize that the socially heterogeneous exurbs display a mix of mainline rural churches, small evangelical, and fundamentalist–conservative churches, perhaps a mega–church, and mainline churches for the affluent.
The Setting
Metropolitan Columbus, situated in the center of Ohio, currently has about one and three–quarter million residents. The village of about 1,000 residents was selected as the state capitol in 1816. Columbus grew slowly but steadily through depressed and prosperous times largely due to its central location in the state and a balanced economy of state government, education (Ohio State University and several smaller colleges), banking, financial services, and manufacturing. Apart from the German immigrants who started to arrive before the Civil War (Hunker, 2000, pp. 109–113), the majority of residents had been of British stock who had emigrated from the East, West Virginia, and Kentucky. The small German colony that grew south of downtown became known as “German Village.” A small contingent of African Americans arrived in the Columbus area soon after the original settlers. After World War II, more arrived and, by 2000, they constituted a seventh of the city's residents. in the 1970s, “urban renewal” programs razed much of downtown's slums, effectively destroying the African American community and dispersing it to the northeast and south. in the 1990s a few Hispanics and Asians began to settle into scattered areas of the city and recently a Somali colony has settled in a northern working–class area.
The State Capitol is still located in the heart of downtown, at the corner of East Broad Street (U.S. Route 40), the main east–west gradient, and High Street (U.S. Route 23), the main north–south gradient. The Scioto River on the west and the ring of Inter–State highways on the other three sides now define downtown's boundaries (see Figure 1). The few residents living downtown north of East Broad have family incomes below the metropolitan's median while those living south of East Broad have slightly higher incomes (see Form and Dubrow, 2005). The recent construction of apartments and condominiums north of East Broad may erase the difference.
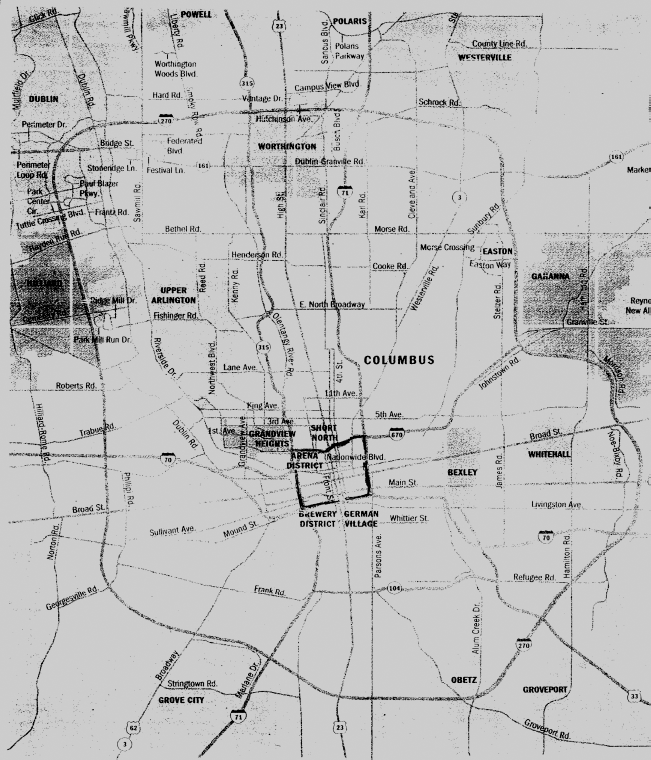
Map of Columbus, Ohio.
Residents of the inner city, defined as the two tiers of census tracts around the CBD, are stratified socioeconomically into upper– and lower–whites and upper– and lower–African Americans (Figure 2). The area directly west of downtown and the Scioto River is Franklinton, an area of poor whites and African Americans. Further west is a predominately working–class area. North of downtown, still in the inner city, three gentrifying neighborhoods have appeared: the Short North, Victorian Village, and Italian Village. Then, in sequence, moving south and then west again to the edge of German Village, are areas of lower–status whites, and upper–middle, middle–, and lower–status African Americans. Then west to the River is the mostly white gentrifying German Village and Brewery District (see Figures 1 and 2).
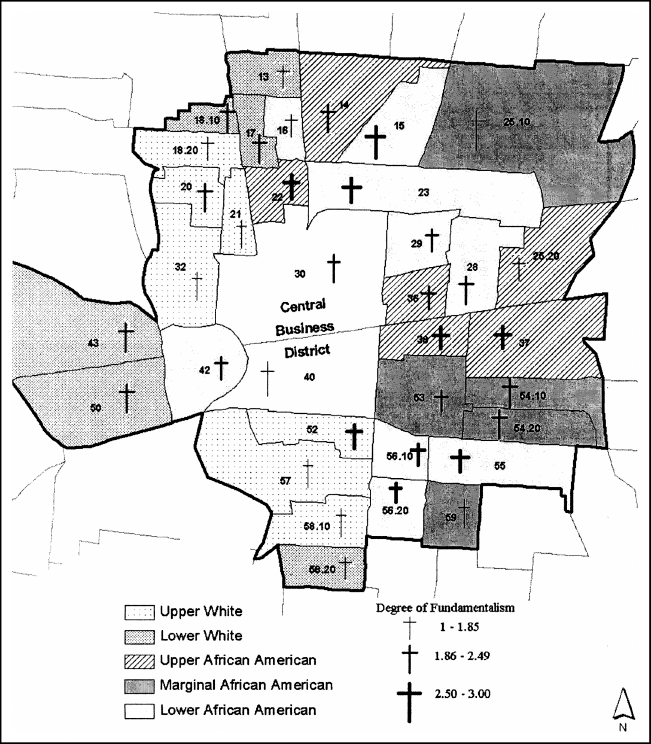
Typology of census tracts in/the inner city of Columbus, Ohio, and their degree of fundamentalism.
Data and Methods
Ideally, the data for this research should include all churches in the metropolis. However, due to data limitations discussed below, we had to make some ad hoc decisions. Since the data sources defined the metropolitan area differently, we decided to define it as Franklin County. This seemed sensible because most of Columbus's suburbs are located in the county and six of them are surrounded by the city. Small parts of the city and suburbs extend into adjacent counties.
The City Directories list churches in the city for 1950 and 2000. Geographic Information Systems (GIS) provides a list of churches by census tracts for Columbus and some adjacent areas for 2000. Three lists of churches are available for the metropolis in 2000: the Franklin County Directory, the Columbus Telephone Directory, and the mailing list of MACC, the Metropolitan Area Church Council (see table 1). Weed (1996) assembled a list of 75 African American churches in the city. He later revised the list to include 137 churches. It provides the church's name, address, ZIP Code, and the pastor's name, but misses many small churches. We derived a closer estimate for 2000 by culling from the GIS list all churches in census tracts with more than 70 percent African American residents and from MACC's list, all churches in ZIP Codes with more than 70 percent African American residents. We also consulted other sources (Chamber of Commerce, City Brochures) and made on–site visits. We arrived at an estimate of 100 more churches than did Weed.
Denominations and Religions in Metropolitan Columbus
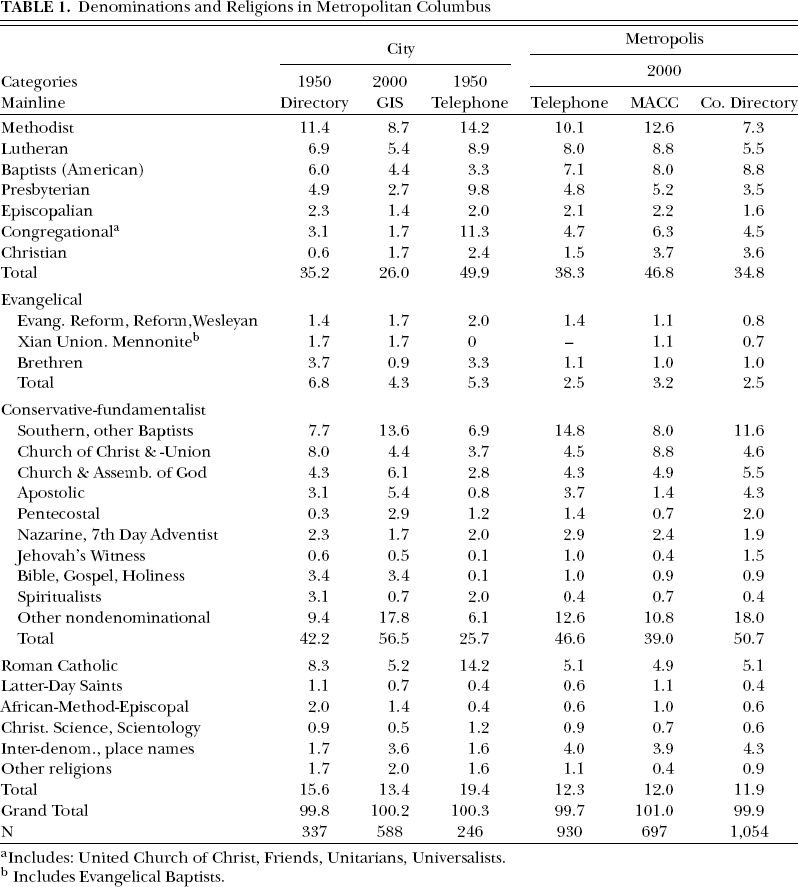
Includes: United Church of Christ, Friends, Unitarians, Universalists.
Includes Evangelical Baptists.
In order to test the hypotheses, we needed data on the social characteristics of the metropolitan subareas and their denominational–religious composition. GIS provides only the church name and its census tract, while the City Directory, the Franklin County Directory, and the Columbus Telephone Directory list only the church names and street address. MACC gives the church name, street address, ZIP Code, and usually the name of city, town, or suburb. Since Census Tract and ZIP Code boundaries are not coterminous, we could not fit census tracts into ZIP Codes areas. Further, ZIP Code boundaries ignore city, county, suburb, or township boundaries.
The 1950 City Directory data had to be purged of churches actually located in four land–locked suburbs. The most recent Franklin County directory had to be purged of some churches located outside the County. MACC included a few churches in townships and urbanized areas outside of Columbus. Yet it provides a check on some churches in the GIS list. 1 The GIS list proved to be somewhat troublesome for three reasons. First, it appears that it gathered most of its data in the 1990s because it lists census tracts not found in the 2000 census. Second, it lists some churches actually in the suburbs and townships. Third, its methodology is not spelled out in detail. This forced us to undertake the tedious process of checking other sources, making phone calls, and visiting some sites. Despite these precautions, an unknown small margin of error likely remains. GIS's big advantage is that census tract data are available about the church's location or neighborhood, especially when most members live near the church. We also drew eight concentric circles stretching from downtown to the exurbs and noted census tracts that lay mostly within each circle or tier. Then we calculated the distribution of denominational types and religions in each tier to measure the steepness of the ecological gradients (see Figure 3).
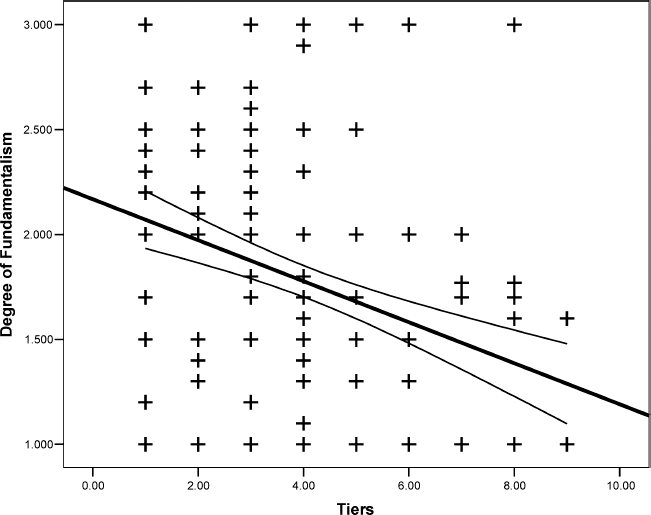
Relationship between tiers and degree of fundamentalism.
We drew the tiers by inspection and by precise measurement. For the latter we utilized a census tract map of the Columbus standard metropolitan areas (SMAs) based on mapping software in the U.S. Census Bureau's website. The inspection method grouped census tracts into eight tiers (see above) by “eyeballing” the map, such that downtown constitutes is the first tier, the census tracts surrounding downtown on all sides as the second tier, and so on. Even though the shape of Columbus is not round, the tiers represent a rough measure of distance from downtown.
The measurement method starts with the center point as the midpoint between downtown census tracts 30 and 40 and the radius is set 1.5 inches to draw a ring. Tier two is 3 inches from the center point; tier three is 4.5 inches, and so on (see Figures 2 and 3). This method yielded nine tiers, with the last one in the exurbs. Miles can be calculated based on the dimensions of the map, 20.4 inches by 23.10 inches. From the midpoint of downtown to the east boundary of census tract 40 along a straight line is 0.75 inches, and from the corner of Fourth and East Broad Street south on Fourth Street to I–70 and Livingston Avenue is 0.75 inches, or about 0.8 miles. Each tier is approximately 1.6 miles wide. Correlation between the two methods of making tiers is 0.926 (p < 0.001), meaning that both methods measure distance about the same.
MACC's list is the shortest and the County Directory is the longest, a range of 357 churches. The smallest conservative–fundamentalist churches are the most likely to be missing from MACC's list and the Telephone Directory (table 1). The Telephone Directory lists 124 fewer churches than the County Directory probably because some small churches have no phones. MACC obviously missed many churches when it sent out an appeal to churches to register with it. Our best estimate is that there are about 1,100 churches or congregations in the metropolitan area.
Although MACC's list is the shortest, it generally provides the church's ZIP Code and the city, suburb, or community in which the church is located. Fortunately, the ZIP Code Directory for 2000 provides some sociodemographic data for the areas. MACC is probably the best source for identifying the suburban churches that are predominantly mainline and evangelical. They are the most likely to respond to MACC's request to register in order to receive information about the local church scene. For some ecological analyses, we included Roman Catholic, Friends, non– and inter–denominational, and place–named churches with the mainline denominations. While some students list African American churches separately (e.g., Kellstedt and Smidt, 1996), we sought to identify their religion and denomination. We had no way of identifying all of them except to assume that all churches in overwhelmingly Black residential areas are Black.
Usually, the more adjectives attached to a church name, the more likely it is conservative or fundamentalist; for example, “The Ever Unwinding and Unfolding Church of the Redeemer.” When “community” and “nondenominational” churches had such prefixes, we classified them as conservative–fundamentalist. The same applies to Baptist churches that were the most likely to have such prefixes (Woodberry and Smith, 1998). While we undoubtedly made some classification errors, we believe they are few based on our site visits of churches and religious districts (see table 2).
Levels of Fundamentalism of Churches in Subareas of Metropolitan Columbus for 2000 (%) a
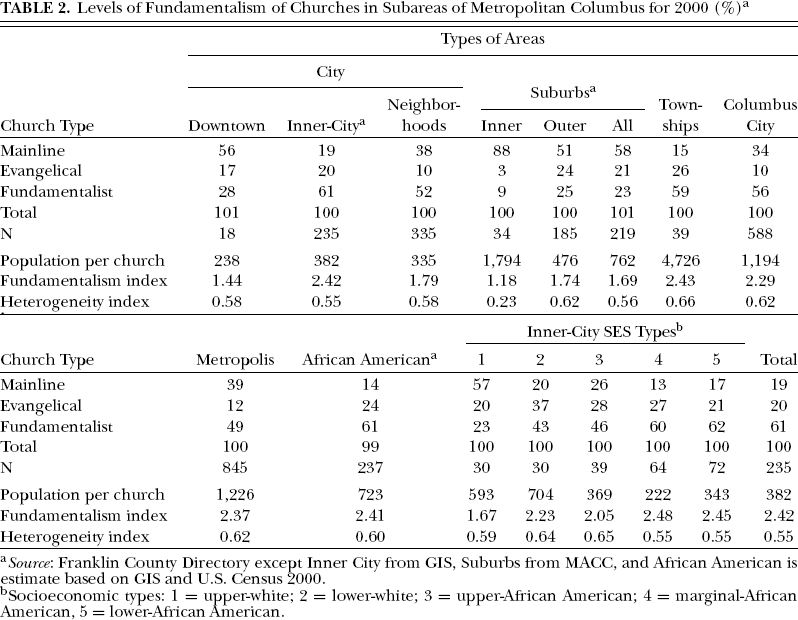
Source: Franklin County Directory except Inner City from GIS, Suburbs from MACC, and African American is estimate based on GIS and U.S. Census 2000.
Socioeconomic types: 1 = upper–white; 2 = lower–white; 3 = upper–African American; 4 = marginal–African American, 5 = lower–African American.
To arrive at an indicator of church composition in subareas, we assigned a value of one to the percentage of mainline and associated churches, two to evangelical, and three to conservative–fundamentalist, and then divided by the total number of churches. For a measure of denominational–religious heterogeneity of subareas, we used Blau's (1977) index: the percentage of churches in each category (mainline, evangelical, conservative–fundamentalist) squared, then added, and subtracted from one. The theoretical upper limit of the index of heterogeneity is 0.677 because there are only three categories; the higher the index, the greater the heterogeneity of churches in an area. Perfect homogeneity appears when only one church type is in the census tract. Perfect heterogeneity signifies that the three types are equally represented, one–third each.
Findings
City and Metropolis
The number of churches in the city of Columbus in 1950 (City Directory) increased by 64 percent by 2000, while the population of the city grew 53 percent. Thus, the number of persons per church increased from 1,115 in 1950 to 1,194 in 2000, or 79 fewer inhabitants per church. A parallel change for the metropolis cannot be determined because the Census Bureau did not define the Columbus metropolitan area in 1950. We can, however, compare the number of inhabitants per church in the city and suburb in 2000: 1,194 and 762, respectively, or 432 fewer for the suburbs. Churches are expensive to support and apparently suburbs, being richer, can support relatively more of them (see Chaves, 2004, p. 215).
In 1950 Columbus, slightly more than two–fifths of the churches were conservative–fundamentalist and slightly more than one–third were mainline (City Directory). Catholic churches made up eight percent and evangelical churches slightly less (table 1). By 2000, probably reflecting the in–migration of Appalachians and African Americans and some religion–denomination switching, conservative–fundamentalist churches increased by 14 percent while mainline churches declined by nine percent (GIS). in 1951, the population outside of Columbus made up 25 percent of the county's; in 2000, 34 percent. in 1951, the county contained fewer suburbs and a larger rural population. The Columbus Telephone Directory listed 6.5 percent of the churches as outside of the city. That figure is unreliable because many churches had no phone. Thus, the Telephone Directory listed 246 churches for its area of coverage, while the City Directory listed 337 churches for the city alone, a plurality of 91 (table 1).
Comparing the three metropolitan lists for 2000 (table 1), the number of conservative–fundamentalist churches in the County Directory is the highest, which should be the case. This suggests that that Directory has the most accurate church count at least for the city where more conservative–fundamentalist churches are found. This also again points to an undercounting of conservative–fundamentalists churches especially by MACC (see Appendix of County Directory). Obviously, a few small churches do not have phones. Because all lists probably miss some very small churches, the County Directory, the longest list, likely has the least error. in as much as all the disagreements among the lists cannot be resolved, we used the most appropriate list for the problem being considered.
In view of the fact that most residents of metropolitan Columbus are of British–German origin, we expected mainline denominations to be the plurality, followed by evangelicals, and conservative–fundamentalist. This turned out not to be the case because conservative–fundamentalist churches are the plurality (table 1). of the 700 to 1,100 churches in the metropolis, about five percent are Catholic, 29 Roman and five Orthodox (MACC). 2 A survey of a representative sample of 832 adult respondents in Franklin county in 2001 revealed that 41 percent identified themselves as Protestants, 20 percent Catholic, two percent Jewish, 24 percent none, and three percent refused to answer (OSU Survey Research Center, 2001). 3
Although individual religious identification cannot be translated into church ratios, the 20:1 ratio of Protestant to Catholic churches in our lists suggests that Catholics are comparatively less churched, even when we consider that Catholic churches hold more than one mass daily and on Sundays. The Catholic diocese of Columbus reported (Schlegel, 2001, pp. 45–47, 99) that the number of parishes in 1960 declined significantly by 2000 even though the Catholic–identified population had grown steadily. The diocese estimated that rate of church attendance for registered Catholics had fallen from about 69 to 46 percent. This suggests that roughly half of self–identified Catholics today are not registered and that the number of churches per 1,000 self–identified Catholics has fallen, a national trend (D'Antonio et al., 2001, pp. 12, 103). in the Columbus metropolitan area, Catholic churches are relatively more concentrated in the inner city and urban neighborhoods while the Protestant churches are more highly concentrated in the suburbs. 4
The Protestant church–population ratio has increased faster than the growth of either city or metropolis. From 1950 to 2000, the city's population grew about 30 percent while its churches increased by half, from 337 to 520 (see table 1). The metropolitan trend must be estimated because 1950 census data for the metropolis are unavailable. However, the U.S. Census reports that Franklin County's population doubled between 1950 and 2000. in 1950, the population outside the city was about 25 percent of the city's. If we take the same church–population ratio for both areas and add 25 percent to Columbus's 337 churches in 1950 (City Directory), this would make 421 churches for the metropolis. Again, if we accept the County Directory's count of 1,054 churches for 2000, church growth for the county from 1950 would be about 250 percent, significantly higher than for the city.
Over the half century, the combined mainline, Catholic, and evangelical churches in the city declined by 15 percent while conservative–fundamentalist churches increased by about the same rate. These changes likely resulted primarily from in–migration by Appalachians and African Americans, although some switching undoubtedly occurred. Supporting our hypothesis on the suburban plurality of mainline churches, all three lists report a larger percentage of mainline churches for the metropolis than for the city (GIS) and all a lower conservative–fundamentalist percentage. When we compare the 1950 City Directory and the 2000 GIS list, all mainline denominations shrank in their relative representation as did the evangelical share while inter– and non–denominational churches increased (table 1). Finally, among conservative–fundamentalist denominations, conservative Baptist grew the most, followed by nondenominational churches, Church– and Assembly of God, Apostolic, and Pentecostal (table 1).
While we do not have baseline data for denominations in the metropolis in 1950, the telephone and county directories largely agree on the composition of churches in 2000. About half of the churches in the metropolis are conservative–fundamentalist, slightly more than a third are mainline, Catholics, five percent, inter–, non–, and place– name churches, slightly less, and evangelical are about three percent. Among the mainline, United Methodists have the largest percentage of churches followed in order by Lutherans and American Baptists, Congregational, Presbyterians, and Episcopal.
If 1950 Columbus is taken as the start of a secular trend, changes in the religion–denominational composition of the areas have been relatively small. The mainline, conservative–fundamentalist, and non– and inter–denominations have increased slightly; the Catholic percentage declined slightly as has the evangelical.
Finally, two ecological concentrations or “religious districts” appear in Columbus in 2000—the 18 downtown churches that are largely white and mainline (Form and Dubrow, 2005) and the 22 African American mostly conservative–fundamentalist (see McRoberts, 2003, p. 12) clustered east of German village. Broad Street, the main east–west gradient, divides the city roughly into a northern and southern half. The northern half has a slightly larger percentage of fundamentalist–conservative churches due largely to its larger concentration of African Americans.
Church Composition of Metropolitan Subareas
Downtown
In 1950, downtown housed about 40,000 inhabitants in black and white neighborhoods that had a range of institutions: schools, churches, services, and recreational facilities. About two–fifths of its churches were mainline, two–fifth conservative–fundamentalist, and one–tenth evangelical (Form and Dubrow, 2005). The expansion of business and government after 1950 forced some residents to move, but in the 1970s, slum clearance, urban renewal, and the building of Federal Interstate highways around downtown forced the majority of inhabitants to move out. As black and white neighborhoods withered, a poor and a more–affluent segment totaling almost 5,000 remained. By 2000 a majority of residents in the northern half were poor, single, black males. The southern half had a slightly higher percentage of better–educated whites. As hypothesized, more than half of the 38 churches of the 1950s died, most of them being small African American conservative–fundamentalist (Form and Dubrow, 2005). Eighteen churches survived, 14 mainline, two evangelical, and two fundamentalist. Most of these were financially strong with a majority of their congregants middle– and high–status whites who lived outside of downtown. The two small fundamentalist churches were barely surviving.
The Inner–City Tier
The two tiers of census tracts surrounding downtown constitute the inner city. As revealed above, the area is stratified into upper–status and working–class whites, and into upper–middle, middle status, and poor African Americans (Figure 2, table 2). The distribution of mainline, evangelical, and conservative–fundamentalist churches in the subareas almost constitutes a scale of declining proportions of mainline churches and increasing proportions of evangelical and conservative–fundamentalist ones. The largest drop in mainline churches and the largest increase in conservative–fundamentalist churches occurs between upper– and lower–status whites, while the differences between the lower–status white and the three African American subareas are smaller. Expectedly, the differences in the fundamentalism indexes among the three African American subareas are relatively small.
While our theory of how race and socioeconomic status intersect with church location has substantial empirical support, level of fundamentalism on the census tract level reveals greater complexity (Figure 2). For upper–white areas, the pattern displays relatively low levels of fundamentalism as expected, with the anomaly (table 2) that census tract 52, which is part of the German Village area, has a higher–than–average fundamentalism index (2.70). Upper–African American subareas, such as census tracts 37 and 38, areas immediately adjacent to downtown, also have higher fundamentalism indexes than expected: 2.7 and 2.6, respectively. Like the lower–white subareas, marginal–African American areas tend to have mid–range fundamentalism levels, though parts (census tracts 25.10 and 59) have some particularly low levels; indices of 1.3 and 1.5. The lower–African American areas are most like upper–whites in that they are least likely to contain deviations from the average. These mismatches between socioeconomic levels of areas and fundamentalism indexes reveal historical lags between church location and population mobility not found in other parts of the metropolis.
Urban Neighborhoods
We hypothesized that, with distance (number of tiers) beyond the CBD, the proportion of mainline churches rises and that of the conservative–fundamentalist declines. We excluded from this analysis the inner–city tracts on the assumption that racial segregation distorts the land market. The positive correlations of socioeconomic level (income, education, and occupation) with distance lie in the range of 0.20 to 0.25. The rise in property value of homes in the first four tiers is modest, but sharp in tiers five, six, and seven: $60, 59, 61, 61, 80, 80, and 99 (in thousands).
Data in table 3 reveal that the rise in the percentage of mainline churches by tier is relatively steep but uneven and the decline for conservative–fundamentalist churches is less steep and more even. The percentage of evangelical churches is constant for tiers two, three, and four, and then declines. With one exception, the index of fundamentalism falls steadily with distance from the inner city. However, the index of heterogeneity is curvilinear, high in tiers 2–5 and falls steadily for the next three. The number of inhabitants per church declines steadily with distance from the inner city, especially in the suburbs and the exurbs. However, relatively more churches are concentrated in small areas of lower status. Finally, as expected, relatively more Catholic than Protestant churches are concentrated in urban neighborhoods, 74 and 52 percent, respectively.
Level of Fundamentalism of Churches in Census Tract Tiers Around the Central Business District (%) a
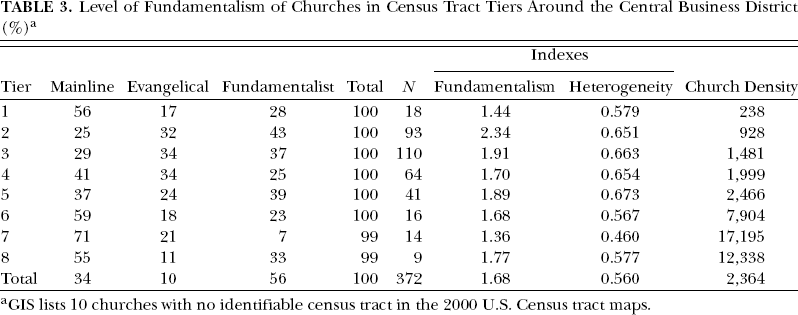
GIS lists 10 churches with no identifiable census tract in the 2000 U.S. Census tract maps.
Suburbs and Exurb
As hypothesized, the older land–locked suburbs contain a higher proportion of mainline and a smaller proportion of conservative–fundamentalist churches than the newer outer suburbs. Expectedly, both the indices of fundamentalism and heterogeneity are significantly lower for the land–locked suburbs than for the outer suburbs. Further, the former have larger population–church ratios. The churches either have larger congregations or fewer local residents attend church. Another differentiating factor is that the outer suburbs have a higher proportion of families with young children living at home. They are more likely to attend church. Finally, as predicted, the proportion of mainline churches in the exurbs (townships) is much lower than in the suburbs and the conservative–fundamentalist, much higher. The denomination profile of the exurbs is remarkably like that of the inner city. Both have high indices of church heterogeneity that reflect their socially heterogeneous residents.
Multivariate Tests of the Main Hypotheses
To supplement the above findings, we constructed multivariate equations that demonstrate how the level of fundamentalism varies by ecological situation, controlling for relevant factors. We assigned an index of fundamentalism for each census tract; the higher the score, the higher the proportion of conservative–fundamentalist churches. To reveal the gradient of decreasing fundamentalism from the central city to the suburbs, we used the precise geographic measure for the nine tiers. Since suburbs, landlocked or no, should have lower levels of fundamentalism, we constructed a dummy variable whereby 1 = suburb, with all else as the reference category.
Using the U.S. Census data for 2000, we constructed variables for population, socioeconomic status, and percent African American. Population is the total population of the census tract, logged. The socioeconomic index is comprised of three variables; percentage with four–year college education, household income, and percent managers and professionals. table 4 presents data on the index and the distribution of its components. Factor loadings are high (ranging from 0.905 to 0.970), indicating high correlation between each variable and the factor. The eigenvalue associated with the factor is above 2, and the variance explained, above 87 percent. Thus, the measurement model fulfills basic statistical requirements. Data on percent Black are also derived from the Census and refer to their percentage in the tract.
Measurement of Socioeconomic Index and Distribution of its Components

Eigenvalue = 2.618; explained variance = 87.28 percent.
In assessing the relationship between tiers and the degree of fundamentalism in Figure 3, the thickest line represents the line of best fit, with the two thinner lines as the confidence intervals. As the number of tiers rises, the degree of fundamentalism declines, but the confidence intervals or variance increases. Variance is similarly high in the inner–city ring, as predicted. The rise in variance with distance from downtown is probably due to a curvilinear effect, such that the exurbs, as hypothesized, contain a higher proportion of conservative–fundamentalist churches than the suburbs.
In the multivariate regression, we constructed two equations because our socioeconomic index and percent Black were too highly correlated to be included in the same model (r =−0.532, p < 0.001). Both models employ ordinary least squares regression with the index of fundamentalism as the dependent variable (table 5).
Ordinary Least Squares Regression of Level of Religious Fundamentalism on Ecological Variables
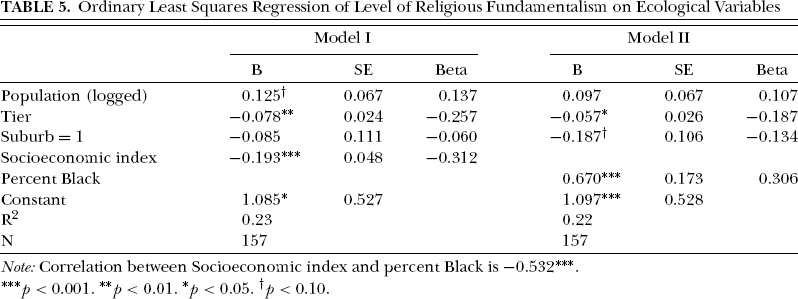
Note: Correlation between Socioeconomic index and percent Black is −0.532***.
p < 0.001.
p < 0.01.
p < 0.05.
p < 0.10.
In Model I, when we control for population and suburban status, as tiers from the inner city to the suburbs increase, the degree of fundamentalism declines. Although the suburban coefficient is in the predicted direction, it does not approach significance. Our socioeconomic index is the strongest variable and weighs considerably in measuring the decline of conservative–fundamentalist churches.
Model II, which portrays the impact of racial composition of the census tract on the composition of its churches, portrays a similar picture. Both tier and suburban status coefficients are significant and in the predicted direction. However, percent Black is a much higher coefficient that points in the opposite direction. Thus, the racial composition of census tracts is a more powerful predictor than number of tiers and suburban status combined. Census tracts with high percentages of Blacks in the farther tiers and suburbs are still more likely to contain higher percentages of conservative–fundamentalist churches. The relative magnitudes of the socioeconomic index (Model I) and percent Black (Model II) suggest that upper–status Black census tracts contain a lower representation of conservative–fundamentalist churches than marginal– or lower–status Black tracts.
Member Residence and Church Location
Except for churches downtown, we hypothesized that churches locate in areas that match the socioeconomic characteristics of their members. Churches with socially heterogeneous members will be centrally located. Another factor to consider is the supply of churches for a single religion or denomination. The larger the supply, the more likely churches will locate in different parts of the community, thus shortening members’ commute to church; the smaller the supply of churches, other factors equal, the more likely the church will be centrally located. Ethnic and racial segregation also tends to reduce the distance between church location and member residence.
Unfortunately, census tract data are not available for the residences of church members, but church directories provide the ZIP Codes of their members’ residences. We classified members of a convenience sample of church directories as living in the same ZIP Code as the church, adjacent ZIP Code areas, or ZIP Codes areas beyond. Ideally, we should have a representative sample of church directories for each subarea of the metropolis. That huge task is beyond the scope of this article, but a few cases probe the ecological prediction of the relation of church location and member residence.
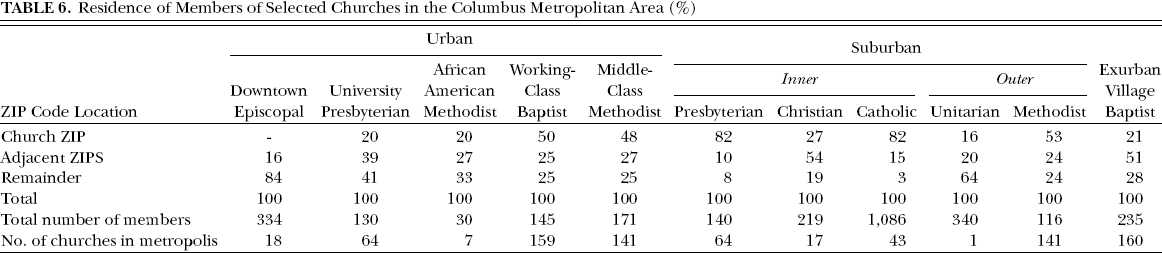
As hypothesized, an overwhelming majority of members of a downtown church (Episcopal) reside beyond the church's ZIP Code area and adjacent ones (table 6). This likely holds also for old mainline churches in gentrified areas of the inner city and for the only United Methodist African American church in the metropolis. The middle–class University Presbyterian church located just beyond the inner city also has a somewhat scattered membership. Importantly, three churches in high–supply denominations have very similar patterns of member residence. For the urban working–class Baptist church, the urban middle–class United Methodist church, and the outer suburb United Methodist church, half of the members live in the same ZIP Code as the church, one–quarter in adjacent ZIP Codes, and one–quarter beyond. Confirming the pattern for a one–church denomination, members of a Unitarian–Universalist church in an outer suburb live in widely scattered ZIP Codes. in accordance with the principle of status convergence of resident and organization location, the most parish–like churches, both Protestant (Presbyterian) and Catholic (St. Agatha), appear in the homogeneous upper–middle class inner suburb (see table 6). Over four–fifths of their members live in the same ZIP Code as the church. Finally, in an exurban area where the church is located near the boundary of two ZIP Codes, member residences are widely dispersed. in short, location theory of human ecology is generally supported.
Residence of Members of Selected Churches in the Columbus Metropolitan Area (%)
Conclusions
The application of location theory of ecology has been neglected by both urban sociology and the sociology of religion. We used the basic principle that an ecological order emerges when groups compete for location. This principle parallels the social stratification principle that status groups locate their organizations to maximize easy accessibility by their members. Yet, some scholars argue that the decreasing cost of transportation in modern societies has weakened the convergent location of organizations and their members’ residences. Since we lack historical data to test this proposition for churches, we examined it in a metropolis where automobile transportation is the dominant mode of transportation (Form and Dubrow, 2005).
We found that mainline, evangelical, and conservative–fundamentalist churches tend to locate in different areas of the metropolis. Downtown, the gentrified part of the inner city, and the inner suburbs display the highest percentage of mainline churches. in contrast, the inner city as a whole and exurban areas display the highest concentration of conservative–fundamentalist churches. Urban neighborhoods, extending from the inner city to the suburbs, display declining representation of conservative–fundamentalist churches and increasing representation of mainline churches. This is sturdy evidence that organizations locate to maximize access of their patrons and that ecological theory can be profitably applied to organizations that stress noneconomic or religious values.
Can our conclusions be generalized to the location of other institutions (schools, clinics, play grounds) in metropolises? We believe they can with four important preconditions: continuous population growth, a relatively flat geographic area, free competition for the use of land, and minimum restrictive zoning (see Bowers, 1939). The Columbus region is relatively flat, but its early suburbs were settled relatively close to downtown and became surrounded by subsequent growth of the city. With this exception the city conforms to the principle of ecology's location theory.
Longitudinal studies are needed to fully understand the dynamics of ecological change. Thus, we noted denominational changes in certain areas of the city (downtown) that resulted from urban redevelopment after 1950. Another secular change was the slow decline in the rate of growth of Catholic churches and the soaring growth rate of Protestant denominations in the expanding suburbs.
Other changes in American society call for tuning the application of ecological theory to religious trends. These include the declining rate of church attendance, the secular decline of mainline denominations, the growth of conservative–fundamentalist sects, and the appearance of non–Christian Asian and African immigrant groups in the cities. The formidable challenge is to test whether the stratification dynamics upon which current ecological theory rests will apply to these changing conditions.
Footnotes
Acknowledgments
We gratefully acknowledge Joan Huber for her comments, criticisms, and suggestions for improving this manuscript. We also thank Kent Schwirian, Richard Hamilton, J. Craig Jenkins, and Jimi Adams for their careful reviews. Finally, we are indebted to Anthony Orum and four anonymous reviewers for their comments and suggestions. Mary “Merlin” Marshall of The Ohio State University Population Initiative provided technical assistance for making the maps.