
Abstract
This study examines the relationship between gentrification and neighborhood crime rates by measuring the growth and geographic spread of one of gentrification's most prominent symbols: coffee shops. The annual counts of neighborhood coffee shops provide an on–the–ground measure of a particular form of economic development and changing consumption patterns that tap into central theoretical frames within the gentrification literature. Our analysis augments commonly used Census variables with the annual number of coffee shops in a neighborhood to assess the influence of gentrification on three–year homicide and street robbery counts in Chicago. Longitudinal Poisson regression models with neighborhood fixed effects reveal that gentrification is a racialized process, in which the effect of gentrification on crime is different for White gentrifying neighborhoods than for Black gentrifying neighborhoods. An increasing number of coffee shops in a neighborhood is associated with declining homicide rates for White, Hispanic, and Black neighborhoods; however, an increasing number of coffee shops is associated with increasing street robberies in Black gentrifying neighborhoods.
Resumen
Este estudio analiza la relación entre el proceso de aburguesamiento (“gentrification”) y la tasa de criminalidad en base a la medición del crecimiento y dispersión geográfica de uno de los símbolos más destacados del proceso de aburguesamiento: los cafés. Datos anuales sobre la cantidad de cafés por barrio ofrecen una medida concreta a nivel local de una modalidad particular de desarrollo económico y de cambios en los patrones de consumo que hace uso de marcos teóricos cruciales dentro de la literatura sobre el aburguesamiento. Nuestro análisis complejiza el uso de las variables censales usuales al incluir la cantidad anual de cafés existentes por barrio con el fin de evaluar el impacto del proceso de aburguesamiento en la cantidad de homicidios y robos en la vía pública acontecidos en períodos de tres años en la ciudad de Chicago. El modelo de regresión de Poisson con efectos contextuales a nivel barrial revela que el proceso de aburguesamiento está fuertemente marcado por las diferencias raciales dado que el mismo tiene efectos distintos en comunidades predominantemente blancas (anglosajonas), latinas y negras (afroamericanas). El aumento en el número de cafés por barrio está asociado con la reducción de las tasas de homicidio en los barrios de población blanca, latina y negra. Sin embargo, el incremento en la cantidad de cafés está asociado con una mayor presencia de robos en la vía pública en los barrios negros en proceso de aburguesamiento.
Introduction
Gentrification is a process that—for better or worse—changes neighborhoods. New people move into a neighborhood, often displacing existing residents. Older housing stock is renovated, repaired, removed, or reconstructed. And, eventually, commerce also changes as new stores and amenities arise to meet the demands of the shifting population. Whether or not such changes are “good” or “bad” for neighborhood residents is heavily debated by politicians, developers, city planners, and academics alike. On the one hand, research documents the harms of gentrification, which include the displacement of disadvantaged populations and the disruption of social networks (Abu–Lughod, 1999; Rymond–Richmond 2007; Smith 1996). On the other hand, gentrification is also viewed (or utilized) as a way to revitalize a neighborhood's economy, cultural heritage, and social organization (Florida 2002; Freeman 2006).
One dimension of neighborhood change often associated with gentrification is the reduction of crime. The logic of politicians and city planners is that disadvantaged neighborhoods “upgrade” with the influx of more well–to–do residents and, in so doing, reduce crime. Yet, the empirical relationship between gentrification and crime has produced contradictory findings. In some studies, gentrification is found to increase crime (Covington and Taylor 1989; Lee 2010; Van Wilsem, Wittebrood, and De Graaf 2006); in others, gentrification is linked to decreases in crime (Kreager, Lyons, and Hays 2007). These contradictions are partially explained by wide variation in types of gentrification and criminal activity studied.
The present study examines the relationship between gentrification and neighborhood crime in Chicago from 1991 to 2005. We augment the more commonly used census indicators of gentrification (e.g., median household income) with one of gentrification's most widely recognized symbols: coffee shops. More specifically, we operationalize the spatial distribution of this indicator of gentrification through the annual increase in corporate and noncorporate coffee shops. Measuring the number of coffee shops in a neighborhood has the distinct advantage over the more commonly employed census and survey indicators in that coffee shops provide an on–the–ground and visible manifestation of a particular form of gentrification—the increased presence of an amenity often associated with gentrifiers’ lifestyles. Furthermore, this measure also captures the role of corporate and private actors (i.e., coffee shop properties) in the gentrification processes. Using fixed effects longitudinal Poisson regression models, we examine (1) how conventional structural indicators of gentrification and the number of coffee shops relate to changing neighborhood levels of homicide and robbery; and (2) how these effects vary by neighborhood racial composition. We find that gentrification associated with increased amenities such as coffee shops is strongly related to declines in homicide and robbery. This process, however, is racialized, with differing effects for White and Hispanic neighborhoods compared to Black neighborhoods.
The paper proceeds as follows. We begin by defining gentrification and reviewing the empirical research on the relationship between gentrification and crime. We situate this project in the larger debates over whether gentrification is a “misunderstood savior” or a “vengeful wrecker” (Atkinson 2003b); in other words, whether gentrification affects the residents of a poor neighborhood for the better or the worse (see Brown–Saracino, 2010). 1 Our analysis is presented in three stages: (1) descriptive analysis of the distribution of crime and coffee shops in Chicago; (2) longitudinal analysis of neighborhood levels of gentrification predicting crime; and (3) an analysis of these findings by neighborhood racial composition. The paper concludes with a review of the findings and implications for future research.
Gentrification and Crime
Broadly defined, gentrification is a process that changes the character and composition of a neighborhood, resulting in the direct and indirect displacement of lower income households with higher income households (Clay 1979; Glass 1964; Kennedy and Leonard 2001; Wyly and Hammel 2005; Zukin 1987). For our purposes, we conceptualize gentrification as a churning process that involves the in–migration of wealth and the out–migration of poverty, most often resulting in over time increases in median household incomes, property values, and presence of lifestyle amenities that appeal to the tastes—and meet the demands of—the wealthier residents (Lees, Slater, and Wyly 2008). The exact definition of “gentrification”—not to mention its political utility—stirs much academic debate (see Brown–Saracino 2010; Freeman 2005). To be clear, our study does not seek to redefine gentrification. Instead, we contribute an additional indicator of gentrification that follows from qualitative research and that may have important implications for neighborhood–level quantitative research. However, this study does address an important debate within the gentrification literature—namely, whether gentrification is “good” or “bad” for neighborhoods, residents, and the larger urban environment.
While academics have mainly debated the implications of gentrification for theories of social change, urban demography, and inequality, activists, politicians, and the general public are divided over whether gentrification is beneficial or detrimental for neighborhood residents (Atkinson 2003b, 2004; Brown–Saracino 2010). On the one hand, increased tax revenue, improved schools, and neighborhood investments associated with gentrification are potentially beneficial outcomes for poorer residents (Florida 2002; Freeman 2006). A study by Freeman (2006), for example, suggests that longtime residents can benefit from new social connections to in–movers’ social, cultural, and economic capital, which enables them to demand better police patrol after dark, send their children to improving schools, and receive other public services. Likewise, Pattillo's (2007) work on Black gentrifiers found that some longtime residents believed that gentrification (at least in its early stages) improved their quality of life. On the other hand, displacement, increased rents, and new forms of surveillance are potentially detrimental—if not outright harmful—outcomes of gentrification for longtime residents (Chernoff 1980; Levy and Cybriwsky 1980; Pattillo 2007; Perez 2004). Indeed, the disruption of social support networks and local neighborhood social organization in disadvantaged communities is one of the greatest casualties of gentrification (Rymond–Richmond 2007). Although what constitutes the benefits and detriments of gentrification varies across social groups and over time (Kerstein 1990; Lloyd 2005), in most cases, the gentrifiers benefit while the gentrified suffer.
This debate over the consequences of gentrification frequently invokes crime rates. The implicit connection between gentrification and crime relates to the ways that gentrification processes might alter the neighborhood conditions associated with crime. Proponents of gentrification widely claim (though rarely empirically assess) that reductions in neighborhood crime rates are a benefit of gentrification at the neighborhood and even city level. This logic assumes that the influx of more affluent residents and improvements in resources, institutions, and amenities lower crime rates and, thereby, improve overall safety in gentrifying neighborhoods (McDonald 1986). Another argument posits that gentrification ameliorates crime and delinquency through increased law enforcement efforts, new economic and social opportunities, or the displacement of prior criminal residents (see Kirk and Laub 2010). 2
Despite the frequency with which the literature mentions the relationship between gentrification and crime, there are surprisingly few empirical tests of this relationship. Likewise, criminologists studying neighborhood change frequently raise the issue of gentrification as an important social process but rarely measure it. The research that does test this relationship has produced evidence of both a negative and a positive association between gentrification and crime.
Several quantitative studies have found a positive relationship between gentrification and crime—crime actually increases as neighborhoods gentrify (Covington and Taylor 1989; Lee 2010; Taylor and Covington 1988; Van Wilsem et al. 2006). As such, gentrification might be considered “bad” for the overall safety of neighborhood residents. Routine activities and rational choice theories suggest crime arrives as the result of the convergence in time and space of motivated offenders, lack of social control, and suitable targets (Felson 1994); as such, the in–migration of wealth into poorer areas may create new and more lucrative opportunities for particular types of crimes, especially property and economic crimes. Social disorganization theory suggests that gentrifying neighborhoods might experience an increase in crime rates as the neighborhood social structures undergo a period of flux and socioeconomic heterogeneity, which lessen a community's ability to control crime internally. Yet, as the community continues to gentrify and population changes stabilize, disorder should decline and social organization should increase (Kirk and Laub 2010). For instance, as neighborhoods stabilize, coffee shops (like other social institutions) might provide additional “eyes on the streets” to monitor public behavior. Crime, therefore, would eventually decrease as neighborhood structural conditions stabilize, thereby improving the overall safety of neighborhood residents. Along these lines, Kreager et al. (2007) found a curvilinear relationship between gentrification and property crime in Seattle, with an increasing and positive relationship when the gentrification process first begins, followed by a decline in property crimes as gentrification progresses; this study also finds an overall negative effect of gentrification on violent crime (Kreager et al. 2007). Lee (2010) also finds both positive and negative effects in his study of gentrification in Los Angeles that varied by the type of crime and neighborhood examined; however, the majority of his crime outcomes (seven out of 11) did not yield significant results.
Recent developments in the study of neighborhoods and crime might help to unpack such divergent findings, especially as they pertain to racial disparities in rates of crime and violence. This line of inquiry focuses on how neighborhood–level social processes influence outcomes such as health, political participation, and levels of crime and violence (Kirk and Laub 2010; Sampson, Morenoff, and Gannon–Rowley 2002). Most relevant for the present study, this body of work consistently demonstrates that neighborhood structural characteristics, such as concentrated disadvantage, tend to be the largest and most resilient predictors of neighborhood crime and violence regardless of the racial composition of a neighborhood (Peterson and Krivo 1999; Pratt and Cullen 2005). Furthermore, and again regardless of the racial composition of a neighborhood, higher levels of trust, social cohesion, and informal social organization among neighborhood residents are associated with lower levels of crime and delinquency (Kirk and Papachristos 2011; Sampson, Raudenbush, and Earls 1997).
Mounting evidence further supports the fact that racial disparities in crime tend to be confounded with significant differences in community contexts (Sampson and Bean 2006; Sampson and Wilson 1995). Often referred to as “ecological dissimilarity,” this research posits that it is impossible for statistical models to reproduce the same neighborhood conditions for Whites and Blacks, since they occupy markedly different positions in the social and spatial order of the city (Sampson and Bean 2006). For example, a recent study by Kirk and Papachristos (2011) finds that Bronzeville, a Black gentrifying neighborhood in Chicago with considerable levels of social control, continues to have high crime rates, in part because it is geographically surrounded by other high–crime/low–social control disadvantaged neighborhoods. In contrast, White neighborhoods with comparable levels of social control experience greater crime declines because they are spatially adjacent to neighborhoods with higher levels of social control (see also Morenoff, Sampson, and Raudenbush 2001). In short, even though informal social control is associated with lower levels of crime, regardless of race, such processes unfold differently given the dissimilarity in the ecological conditions between White and Black neighborhoods.
We maintain that gentrification may similarly vary by the racial composition of a neighborhood, the racial composition of the gentrifiers, and the ecological position of a neighborhood in a city. The ecological dissimilarity hypothesis would suggest that Whites, Blacks, and Hispanics gentrify and experience gentrification in different ways, not just because of individual characteristics and preferences, but also because of the community contexts in which they reside or the neighborhoods they gentrify. In fact, prior research already suggests that gentrification is a highly racialized process. In the 1960s and 1970s, most gentrifiers tended to be college–educated, younger Whites who moved into working–class White and non–White Hispanic communities (Clay 1979). This continues today, as in the case of Brooklyn's Williamsburg, a formerly Jewish and Hispanic working–class neighborhood that is now associated with a White, young, single, educated (but nonwealthy), artsy crowd called “hipsters”—the modern equivalent of “bohemians” (Zukin 2010). Historically, Black Brooklyn neighborhoods, such as Bedford–Stuyvesant, are associated with far less displacement of long–time residents (Freeman 2006) and, thus, are more likely to remain Black even though the economic and cultural organization of the neighborhood may change. Gentrifiers in these neighborhoods tend to be members of the Black middle class or “buppies”—Black Urban Professionals (Hyra 2008; Pattillo 2007).
However, whether or not the effect of gentrification on other neighborhood outcomes—such as crime—varies by the racial composition of a neighborhood is not well understood. The research on gentrification and crime has not fully considered how gentrification might vary by the racial composition of a neighborhood, nor has the criminological research on the subject fully measured gentrification processes. Yet, given the observed disparities of crime rates along racial and ethnic dimensions, the effects of gentrification may also vary by the racial composition and ecological position of a neighborhood. Gentrification may unfold differently in Black, Hispanic, and White neighborhoods based on individual preferences, the practices of corporations and banks (Wacquant 1989; Yinger 1995), and the distribution of amenities and retail establishments across socioeconomic neighborhood conditions (Small and McDermott 2006).
The present study contributes to the gentrification and crime debate by improving how neighborhood scholars measure gentrification. Specifically, we devise a noncensus indicator identified in qualitative research on gentrification: the number of coffee shops in a neighborhood. Whereas census indicators provide measurements of demographic and economic conditions, our measure of coffee shops encompasses additional aspects of gentrification such as lifestyle, consumption patterns, and the capacity of corporate and private actors. Consistent with prior research on neighborhoods and crime, we hypothesize that crime rates will decline at a greater rate in gentrifying neighborhoods as population shifts stabilize. However, consistent with the ecological dissimilarity framework, we suspect that the effect of gentrification on crime will vary by neighborhood racial composition. More specifically, any crime–reducing effect associated with gentrification will most likely be lower in Black neighborhoods as compared to non–Black neighborhoods.
Indicators of Gentrification and Crime
Gentrification is a process and, therefore, necessitates a measure that increases or decreases quantitatively to enable meaningful comparisons over time and across neighborhoods. Yet, gentrification is a multifaceted, complex process involving political, corporate, and independent actors. Furthermore, gentrification often unfolds at an uneven temporal pace, sometimes occurring quickly (e.g., the demolition of public housing) and other times occurring more slowly (e.g., turnover of neighborhood population). Hence, gentrification is not necessarily linear or cumulative. Given this complexity, qualitative methods are perhaps best suited to study gentrification as a contextual experience and a powerful generator of urban inequality. Nevertheless, a quantitative indicator of gentrification is necessary if we wish to test the popularly and politically employed theory that gentrification leads to improved neighborhoods regardless of racial composition and time period.
To date, quantitative gentrification measures have relied almost exclusively on census data. The resulting research is often limited by inadequate measures of displacement (Hammel and Wyly 1996; Kreager et al. 2007; Taylor and Covington 1988), cross–sectional measures of gentrification (Kreager et al. 2007; Wyly and Hammel 1999 3 ), or measures that employ limited definitions of gentrification such as only changes in residential income (Lee 2010). Given this lack of attention to adequate quantitative measures of gentrification, it is little surprise that the research on gentrification and crime has produced divergent results.
While census–based indicators of gentrification are able to capture some important dimensions of gentrification, such indicators face at least two significant limitations. First, the decennial availability of the census means that measures of neighborhood change must be interpolated using 10–year time intervals, essentially estimating any change associated with gentrification as a linear trend. Second, relying on aggregate neighborhood level, census indicators assume that only individual residents drive gentrification processes, an assumption that fails to consider of the role of corporate and political actors in the gentrification process.
The goal of our study is to augment commonly used census indicators of gentrification with a noncensus–based measure that maps onto the nonlinear tendencies of gentrification and that can be measured precisely over time and space—the number of coffee shops in a neighborhood. We have chosen coffee shops as an indicator of gentrification because of their prominent place in both the urban imaginary (Atkinson 2003a; Lloyd 2005; Zukin 2008) and in policy prescriptions from consultants (see Florida 2002).
Prior qualitative gentrification scholarship refers to the appearance of coffee shops as a meaningful representation of neighborhood change. For example, urban sociologist Richard Lloyd traces the life and death of Urbus Orbis, a legendary punk–rock coffee shop in the gentrified Chicago neighborhood of Wicker Park. Lloyd (2005) suggests that Urbus Orbis’ magnetism in the 1990s, its reputation as a gathering spot for newcomers, its eventual status as an iconic outpost of gentrification in the once poor Hispanic neighborhood, and its closing shortly before the neighborhood's feature in the television series The Real World are all emblematic of a coffee shop's role in neighborhood change. Although rising commercial rents and financial viability ushered in the death of Urbus Orbis, a Starbucks currently stands less than 400 feet from the old Urbus, and four additional Starbucks and eight other independent coffee shops can be found within a one–mile radius. In much the same way, the presence of coffee shops, specifically Starbucks, is referenced in other qualitative and descriptive accounts of gentrified neighborhoods (e.g. Boyd 2008; Hyra 2008; Kennedy and Leonard 2001; Wyly and Hammel 2005), but to the best of our knowledge, not a single quantitative study has actually measured the temporal and geographic distribution of coffee shops and analyzed their influence on other neighborhood processes.
There are also theoretical reasons to use coffee shops as indicators of the neighborhood shifts associated with gentrification. 4 When scholars debate whether the engine of gentrification is economic or cultural, they are asking whether something like a proliferation of consumption amenities in a previously disinvested area is a response to supply or demand (Brown–Saracino 2010). Coffee shops, however, are clearly both. While they do require some start–up capital and a market, cafés and coffee shops have for centuries been used as “third places,” serving the critical function in the community as locations where people may socialize and retreat from home and work (Oldenburg 1999). Though this function is less applicable to the contemporary United States (many coffee shops today are primarily a modern convenience for the on–the–go caffeine consumer), the commodification of third place nostalgia has proven a successful marketing tool for corporate coffee shops such as Starbucks (Simon 2009). 5 Coffee sellers use specific marketing language to recreate high–culture ideas tied to art and philosophy for its customers, targeting an ideal bourgeois patron (Roseberry 1996; Simon 2009; Thompson and Arsel 2004). Not dealing in a necessary comestible product, such as milk or bread, but rather a status product, coffee shops are integral to the leisure and lifestyle amenities package so attractive to urban gentrifiers. In a postneed economy, coffee shops meet the urban consumer's demands for a space to meet friends or use the Internet, demands which were mostly absent from the neighborhood's prior population.
In short, we argue that measuring the number of coffee shops located in a neighborhood each year provides an almost real–time measure of one type of development commonly associated with gentrification. To this end, we counted the total number of coffee shops in a neighborhood each year from 1991 to 2004 from all listings under “Coffee & Tea” and “Coffee Shops” in annual Chicago Business Directories. DirectoriesUSA compiles these data from public records including phone books, annual reports, courthouse filings, etc. 6 Recent research suggests that business directories and geocoding business addresses are a resilient and robust way to measure urban change (Bader et al. 2010; Carroll and Torfason 2011; Kubrin et al. 2011; Schlichtman and Patch 2008; Small and McDermott 2006). Our final coffee shop variable is constructed as a three–year average count of coffee shops for the 15–year period between 1991 and 2005, yielding a total of five time periods.
Data
The sources of the other data utilized in this study are the U.S. Census and the Chicago Police Department (CPD). The units of analysis used here are 341 neighborhood clusters over time identified in prior research by Sampson et al. (1997). 7 The Project on Human Development in Chicago Neighborhoods created these neighborhood clusters by combining the 847 census tracts of Chicago into geographically contiguous areas that are internally homogenous on the key census indictors of race/ethnicity, housing density, and family structure (Sampson et al. 1997: 919). Though not without drawbacks, the use of neighborhood clusters as the unit of analysis has two major benefits over census boundaries. First, previous research demonstrates that these neighborhood clusters are ecologically meaningful (Sampson et al. 1997). Second, given the rarity of crime as an event and the even smaller number of coffee shops in Chicago, aggregating to the neighborhood cluster reduces the number of zeros used in the analysis and, therefore, minimizes some of the overdispersion in the distribution of key variables.
Dependent Variables
Our empirical analysis examines the temporal diffusion of gentrification across neighborhood clusters’ levels of crime. The main dependent variables are the annual counts of homicides and street robberies. 8 Homicide and robbery tend to function as strong indicators of the overall level of neighborhood violent crime. Homicide data, in particular, have several advantages over the use of other crime measures because (1) there is a close match between known homicides and the true number of homicides—that is, homicides are highly likely to be reported or discovered by police, and (2) homicide is less susceptible to definitional variation by the police. The threat of robbery victimization has far–reaching effects on urban life through its influence on choices for residents and visitors about where to live, work, shop, and dine; as such, robbery operates as a measure of how “safe” a neighborhood feels to residents. Because crime is a rare event, it is standard practice to construct counts based on three–year periods (e.g., Morenoff et al. 2001). These three–year periods also reduce the number of zeros in the dependent variables. For the present analyses, we created a measure of three–year counts of homicide and street robberies for each of the 341 neighborhoods in Chicago for the 15–year period between 1991 and 2005, yielding a total of five time periods: 1991–1993, 1994–1996, 1997–1999, 2000–2002, and 2003–2005.
Neighborhood Structural Characteristics: A Factor Analytic Approach
Quantitative research on gentrification tends to include an extensive list of census–based measures of levels of education, income, residence costs, kinds of occupations, and other population characteristics (Hammel and Wyly 1996). Keeping with this tradition, our analysis includes seven census indicators: percent of population with a bachelor's degree, percent of population that moved into the neighborhood in the last five years, percent of new housing built in last five years, the log of mean family income, the percent of population that is Black, the percent of population that is Hispanic, and the percent of population that is foreign born. These individual census indicators are highly correlated with themselves across time, suggesting that very few neighborhoods experience any detectable change along these dimensions (see also Sampson 2009). 9 Thus, while gentrification can have dramatic consequences, it is quite a rare phenomenon when measured using only census indicators. Our measure of coffee shops is specifically designed to try to capture a more subtle cultural process of neighborhood change that might not be captured by such census indicators.
Several of these census indicators are highly correlated, so that the simultaneous inclusion of multiple Census variables increases the variance inflation factors in our models (see Table S2). To correct for multicolinearity, we adopt a factor analytic approach for the census measures (e.g., Land, McCall, and Cohen 1990). In addition, we attempted to run a similar factor analysis that included our coffee shop indicator. Using principal component factor analysis, we combined seven census measures into two rotated factors. Table 1 presents the individual variables and their factor loadings.
Principal Component Factor Analysis of Neighborhood Structural Variables
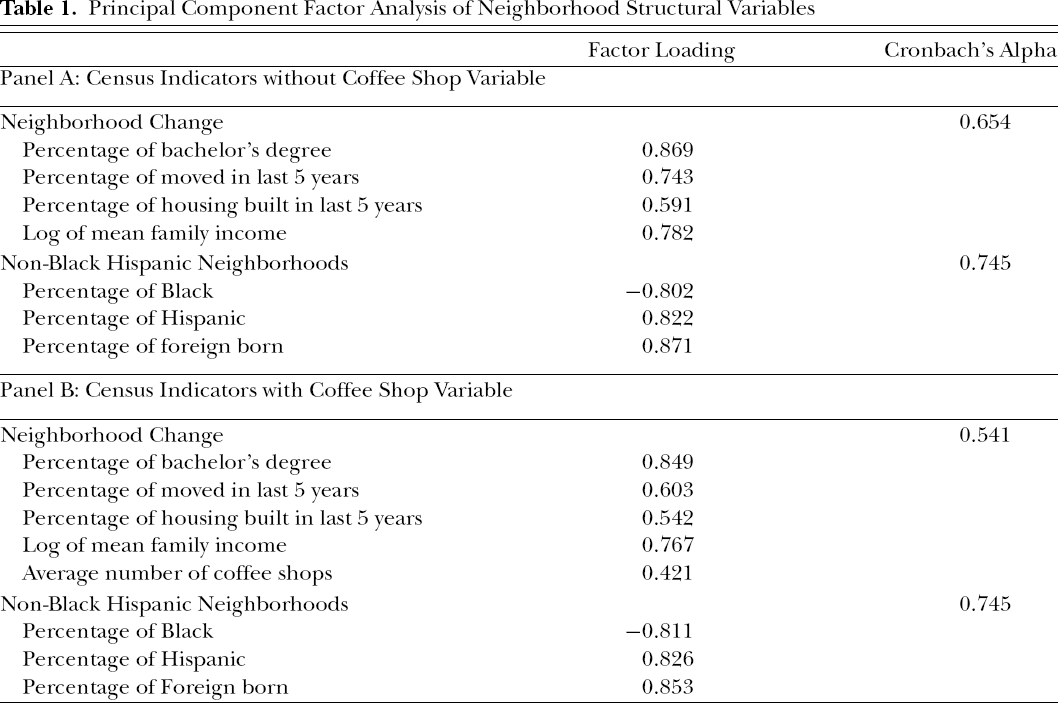
Panel A in Table 1 shows that our seven census variables load on two factors. Four of the census variables loaded on a single factor we call Neighborhood Change. Consistent with prior studies of gentrification, the neighborhood change factor represents those neighborhoods that experienced an increase in the proportion of the population with bachelor's degrees, recently moved individuals, new housing, and overall mean family income. In other words, higher values of this variable over time suggest that, overall, neighborhoods changed along these dimensions. The second factor, Non–Black Hispanic Neighborhoods, stresses the racial segregation of Chicago neighborhoods. As the name of this factor suggests, higher values of this factor indicate that a neighborhood is comprised of non–Black Hispanic population with high levels of foreign–born residents. Conversely, lower values of this indicator suggest that the neighborhood is comprised mainly of native–born Blacks. Taken together, these two factors are indicative of the process of gentrification: gentrifying neighborhoods experience population turnover and the influx of typically White, well–educated individuals with higher levels of income.
To ensure that our measure of coffee shops was not highly correlated with other independent variables, we conducted a principal component factor analysis that included the coffee shop variable. As seen in Panel B of Table 1, the coffee shop variable can load onto the neighborhood change factor, but only at a modest level (0.421). Further, the addition of the coffee shop variable to the factor analysis reduces the Cronbach's Alpha from 0.654 to 0.541. Thus, while the coffee shop variable taps into some of the underlying factors captured by the neighborhood change variable, it appears to make its own unique contribution. 10
Analytic Strategy
Our analysis proceeds in two stages. The first stage of analysis describes spatial and temporal trends of gentrification and crime in Chicago between 1991 and 2005. The goal of this stage is to detail the temporal and spatial dynamics of gentrification. The second stage seeks to unravel the effects of gentrification on neighborhood crime through a series of longitudinal regression models. To these ends, we use longitudinal Poisson models with neighborhood fixed effects. These models are ideal for analyzing count data as they correct for the overdispersion of a highly skewed distribution (Long and Freese 2006) and are especially well suited for analyzing crime data (Osgood 2000). Additionally, longitudinal models allow for modeling gentrification as a process over time rather than a singular event or singular change. Population is used as an exposure term in all models, which effectively assumes comparable rates.
The choice of using fixed effects deserves some comment. Given the complex nature of gentrification processes and the limitations of census indicators as well as our coffee shop measure, it is quite possible that some unobserved third social process or neighborhood dimension is driving both crime trends and gentrification. A fixed effects approach essentially controls for such unobserved factors, but does so at a cost. On the downside, the use of fixed effects eliminates the possibility of using time invariant control variables (such as collective efficacy) and also drop all neighborhoods from our sample that have zero crime incidents during all time periods. 11 On the upside, fixed effects provide a powerful control for unobserved neighborhood processes and thereby reduce important sources of potential bias. As might be expected, running our models with random effects produces regression coefficients that have much higher rates of statistical significance than our fixed effects models. This reduction of statistical significance in fixed effects models suggests that there are indeed unobserved neighborhood–level processes at work on both gentrification and crime—something to which most ethnographies of Chicago neighborhoods would attest. 12 Ultimately, we make the trade–off for a slightly smaller sample in order to achieve theoretical precision—in this case, to better isolate the effect of coffee shops on crime.
Coffee and Crime in Chicago, 1991 to 2005: Descriptive Analysis
The present analysis begins in 1991, a year when gentrification had already begun and when crime rates in Chicago were at a nearly all–time high. 13 Figure 1 summarizes the basic gentrification and crime trends in Chicago during the study period by plotting the annual number of coffee shops, homicides, and street robberies.
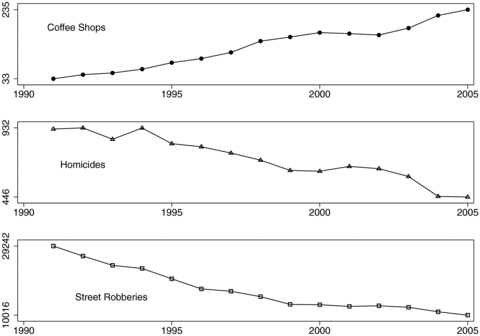
Annual number of coffee shops, homicides, and street robberies in Chicago, 1991 to 2005.
The annual number of coffee shops in Chicago increased dramatically from approximately 30 coffee shops in 1991 to nearly 240 in 2005. At the same time that coffee shops increased, both homicides and robberies declined. Homicide dropped more than 45 percent during this time period, while robbery dropped more than 60 percent. In short, Figure 1 summarizes the fact that both gentrification and crime rates were experiencing dramatic changes during this period. To address issues of spuriousness, our longitudinal models presented in the next section will address the relationship of these trends as well as their association with various changes in sociodemographic trends. The goal of the present section, however, is simply to document these trends.
Disaggregating the increase in coffee shops by the type of coffee shop in Figure 2 reveals an interesting trend concerning the way in which this expression of gentrification unfolded in Chicago. 14 From 1991 until the late 1990s, growth in the number of coffee shops was mostly driven by the proliferation of independent coffee shops, establishments with names such as the Bean Post, Coffee Chicago, and the Bourgeois Pig, whereas Starbucks and other corporate coffee shops (e.g., Caribou Coffee, Dunkin’ Donuts, Seattle's Best) 15 maintained steady but slower growth. Around 1996, the number of Starbucks and other corporate coffee shops increased at a rapid pace and surpassed the growth of local coffee shops around 2001. During this period of growth, a corporate shop replaced an independent shop in 10 instances, and in another 15 instances, one independent coffee shop replaced another independent shop. Thus, the growth of corporate coffee shops during this period occurs mainly through the opening of new establishments, but also to a lesser extent through the acquisition of independent shops. In addition, the trends in Figure 2 clearly indicate that gentrification (in the aggregate) did not occur in a simple linear trajectory suggesting that that our measure of coffee shops indeed captures some of the temporal unfolding of this complex processes.
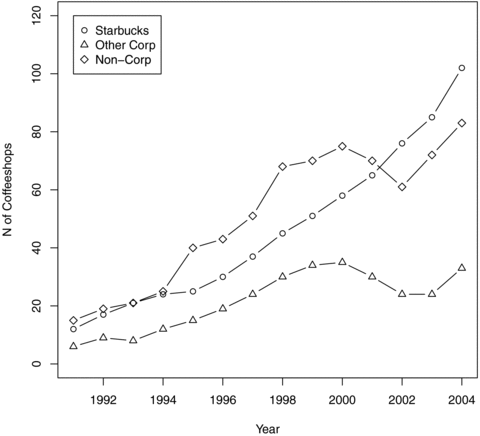
Annual number of coffee shops by type in Chicago, 1991 to 2004.
As one might expect, these crime and coffee shop trends are not distributed evenly across neighborhoods. Overall, there is an inverse relationship between the spatial distribution of coffee shops and homicide but a similar relationship between coffee shops and several of the census indicators of gentrification. 16 Figure 3 provides a series of maps displaying the distribution of homicides, coffee shops, percent Black population, and percent population with bachelor's degrees.
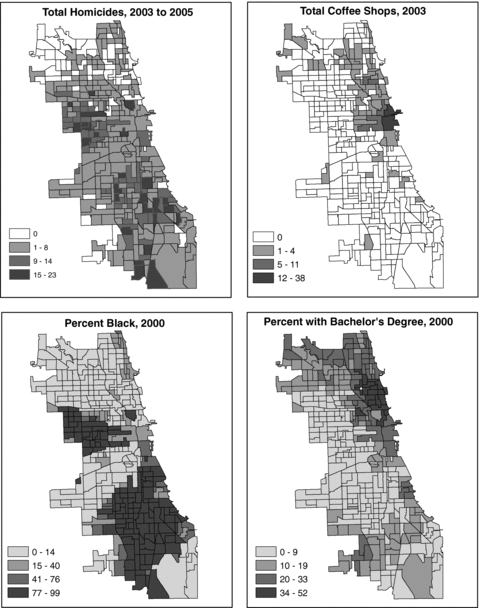
Maps of Chicago depicting total homicides between 2003–05, number of coffee shops in 2003, percent Black population in 2000, and percent population with a Bachelor's degree in 2000.
Consistent with prior research, homicide tends to be spatially concentrated in disadvantaged, predominantly Black neighborhoods on the south and west sides of the city (e.g., Morenoff et al. 2001; Papachristos, Meares, and Fagan 2007). In contrast, coffee shops tend to concentrate along the north and northwest sections of the city—predominantly White neighborhoods with high levels of education and mean family income. Comparing the spatial distribution of percent Black and the total coffee shops in Figure 3 highlights the lack of amenities such as coffee shops in Black neighborhoods—some of which, such as Bronzeville, are in fact gentrifying (Hyra 2008; Kirk and Papachristos 2011). Such a distribution supports the idea that the type of gentrification associated with the growth of coffee shops tends to concentrate in non–Black neighborhoods perhaps because of the ecological dissimilarity between Black and non–Black neighborhoods—on average, Black neighborhoods tend to have fewer organizational resources and amenities (e.g., Small and McDermott 2006).
To illustrate how such changes in coffee shops and crime patterns unfold across the city, Figure 4 maps the spatial distribution of the neighborhood level change in crime and gentrification by plotting the raw change in the number of homicides and coffee shops from 1991 to 2005. The change in homicides was calculated by subtracting the 1991 to 1993 (first three–year period) neighborhood homicide counts from the 2003 to 2005 (last three–year period) neighborhood homicide counts. Negative values show that homicides decreased in the later years, whereas positive values indicate an increase in homicides in the later time period. The shade of the neighborhood on the map indicates the change in homicide: darker–shaded neighborhoods experienced decreases in homicide, while lined/hatched neighborhoods experienced increases in homicide. Similarly, we measured the change in the number of coffee shops by subtracting the total neighborhood number in 1991 to 1993 from the 2003 to 2005 neighborhood coffee shop total. Points visualize the coffee shop change in Figure 4, where the larger points indicate a greater growth in the number of coffee shops over the time period. Although a few neighborhoods did lose a coffee shop, not a single neighborhood went from a positive number of coffee shops to zero.
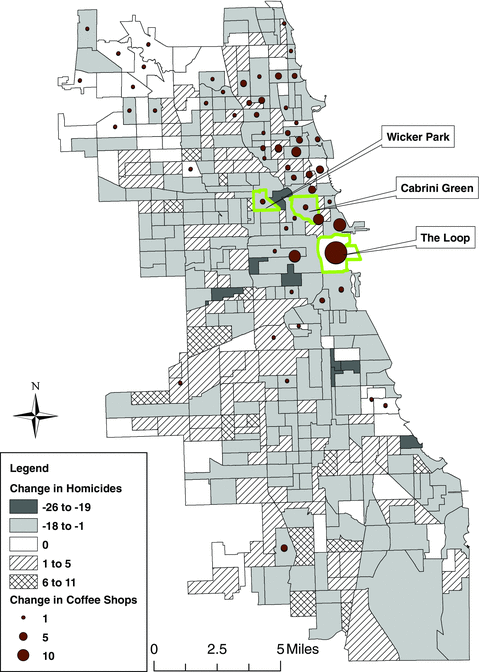
Chicago neighborhood change in homicides and coffee shops, 1991 to 2005.
Figure 4 reveals several trends. First, changes in coffee shops display an even greater spatial concentration than changes in crime. Whereas almost every neighborhood experienced a homicide during the study period, only 25 percent of neighborhoods had a coffee shop. The largest concentration of coffee shops is in the central business district (The Loop) and spreading to neighborhoods to the north along major arteries of the city such as Lincoln Avenue. Furthermore, there is a noticeable lack of coffee shops in the predominantly Black south and west sides of the city, areas with the highest levels of crime and socioeconomic disadvantage. Those neighborhoods on the south and west side that do have coffee shops, in contrast to neighborhoods on the north side, typically have only a single coffee shop.
Second, coffee shops are present almost entirely in areas with declining homicide. In fact, only eight coffee shops are found in neighborhoods with increasing homicide numbers, and, in at least one of these eight, the neighborhoods adjacent to the high–crime neighborhood are experiencing declining homicides. Thus, such a neighborhood reaps an ecological advantage in that it is surrounded by other neighborhoods with lower crime rates and less socioeconomic disadvantage. In general, the concentration of coffee shops is greater in neighborhoods that are adjacent to other neighborhoods with (1) declining homicide rates or (2) already existing coffee shops. In contrast, note the lack of coffee shops in declining homicide neighborhoods on the south and west sides, predominantly Black communities. Thus, while coffee shops are present in areas with declining homicide levels, they are not present in Black neighborhoods with declining homicide. While we lack the data to explain precisely why coffee shops are absent in Black neighborhoods with declining homicides or with higher socioeconomic status, the observed pattern may result from (1) lack of demand, (2) corporate practices, (3) the refusal of banks to provide credit to business owners in these communities, or (4) some combination therein. Regardless of the exact reason for this pattern, if the presence of coffee shops is related to gentrification, then Figures 3 and 4 imply that this type of gentrification process is extremely racialized: coffee shops are more likely to open in non–Black communities, especially those near neighborhoods with declining crime rates.
The location of the Cabrini–Green housing projects is a prime example of how the distribution of coffee shops and crime rates capture gentrification in action in Figure 4. Historically, the Cabrini area has been a pocket of crime within walking distance of Chicago's Gold Coast (Zorbaugh [1929] 1976), and the areas immediately surrounding the nearly all Black housing projects have experienced increased gentrification over the past decade. Recently, the value of public housing lands has attracted investors, and policies have been pushing toward privatization, demolition, and revitalization projects. Consistent with our indicator of gentrification, a Starbucks opened in 2002 some 200 yards from the front door of Cabrini–Green. 17 Put another way, a coffee shop catering to a middle–class clientele opened up next to one of Chicago's most crime–ridden housing projects largely because the tide of gentrification from surrounding communities and the planned demolition of the Cabrini highrises ensure this area will soon experience rapid gentrification. And, though Cabrini did experience an overall decline in homicide, it still has higher levels of homicide that the surrounding areas (see Figure 3). Here, we might see a “positive” effect of gentrification in the form of long–term neighborhood crime reduction, but at the severe expense of the displacement of Cabrini residents.
Predicting Violent Crime: Longitudinal Analysis
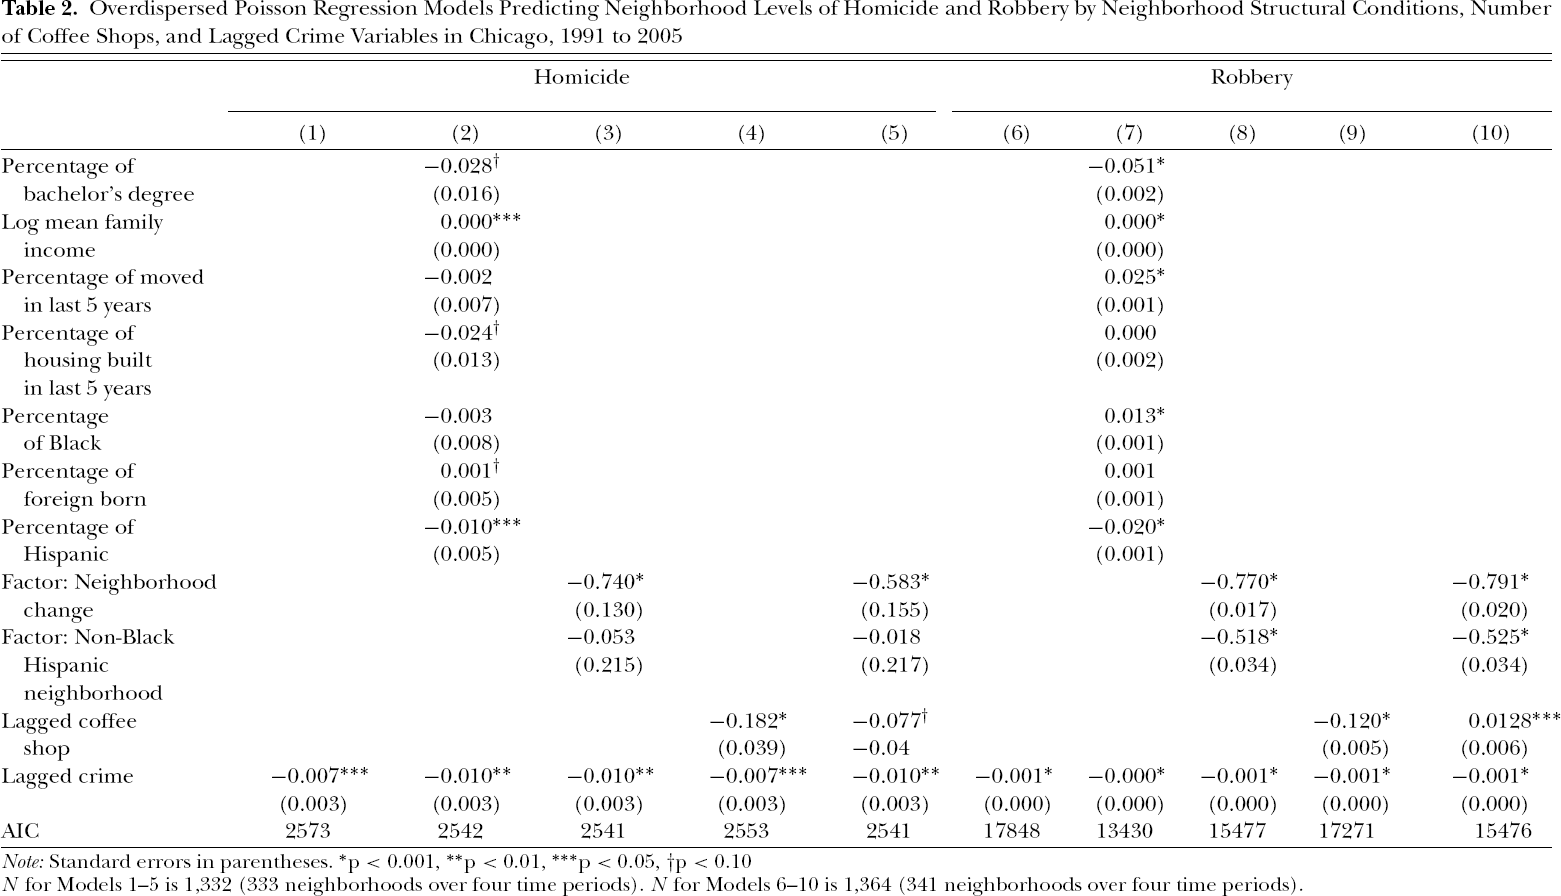
The final stage of analysis turns to the issue of time: to what extent are the growth and spatial distribution of coffee shops associated with neighborhood violent crime? To answer this question, Table 2 presents a series of overdispersed longitudinal Poisson models with neighborhood fixed effects. We regress the total number of neighborhood homicides and robberies, respectively, on census factors, the number of prior coffee shops, and the lagged levels of neighborhood crime. In order to track changes in the neighborhood structural conditions, we created linear interpolations using ordinary least squares regressions of the 1990 census factors on the 2000 census factors to create three–year period specific measures. Lagged levels of crime are added to the equations as prior research suggests that one of the strongest predictors of current levels of crime is prior crime rates (Kirk and Papachristos 2011; Morenoff et al. 2001). 18 We lag the coffee shop variable to operationalize our argument that gentrification precedes the decline in crime; namely, it is the preceding development (not necessarily contemporaneous development) that should affect subsequent crime rates. 19
Overdispersed Poisson Regression Models Predicting Neighborhood Levels of Homicide and Robbery by Neighborhood Structural Conditions, Number of Coffee Shops, and Lagged Crime Variables in Chicago, 1991 to 2005
Note: Standard errors in parentheses.
p < 0.001,
p < 0.01,
p < 0.05,
p < 0.10
N for Models 1–5 is 1,332 (333 neighborhoods over four time periods). N for Models 6–10 is 1,364 (341 neighborhoods over four time periods).
Models (1) through (5) in Table 2 list the parameter estimates for models predicting the number of homicides while Models (6) through (10) list the estimates for models predicting the number of robberies. Both homicide and robbery models progress from (1) a baseline model, (2) a model including only census variables, (3) a model including only the factor scores, (4) a model including only the coffee shop variable, and (5) a model including the factors and the coffee shop variable.
Overall, the models predicting homicide (Models 1 through 5) suggest that those neighborhoods experiencing gentrification also experience a greater than expected decline in homicide. Considering only the census variables, Model (2) demonstrates that neighborhoods with increasing levels of education, a decreasing proportion of new housing, and an increasing proportion of Hispanic population experience greater than expected declines in homicide. Model (3) reduces some of the collinearity associated with these census indicators and also further clarifies some of these relationships. Neighborhoods experiencing increases in the Neighborhood Change factor—that is, areas with increasing mean family income and education, newly built housing, and recently mobile population—experience greater decreases in homicide. Similarly, non–Black Hispanic neighborhoods (as compared to Black neighborhoods) also tended to experience greater than expected decreases in homicide, though this effect was not statistically significant. As expected, prior levels of homicide are a strong predictor of subsequent homicide in all models.
When we add the coffee shop variable to Models (4) and (5), its effect is negative and statistically significant. Lagged coffee shops retain significance even when controlling for the census factors. That is, as the number of coffee shops in a neighborhood increases, the number of subsequent homicides decreases. In other words, more coffee, less homicide.
The robbery models (Models 6 through 10) produce somewhat similar findings. As expected, prior levels of robbery are a strong predictor of subsequent robbery—that is, high–robbery neighborhoods tend to stay high–robbery neighborhoods (Braga, Hureau, and Papachristos 2011). Similar to the homicide Model (2), the robbery Model (7) includes several statistically significant census variables associated with robbery. Again, similar to the homicide models, the more parsimonious factor equation (Model 8) reduces the collinearity among the individual census variables and provides a more concise interpretation of the associated processes: neighborhoods increasing in the Neighborhood Change factor experienced greater than expected declines in robbery, as did neighborhoods experiencing increases in the Non–Black Hispanic population.
However, the robbery models differ from the homicide models slightly when considering the coffee shop variable and the census factors in the same equation. When considered with only the lagged robbery rates, the coffee shop variable is negative and statistically significant. However, when considered in conjunction with the census indicators in Model (10), the coffee shop variable is positive, indicating that when other factors of gentrification are considered, an increase in the number of coffee shops is associated with an increase in robbery.
The differing effect of the coffee shop variable on homicide and robbery implies that gentrification's effect on crime may vary by crime type—in this case, gentrifiers may be more tolerant of nonlethal crimes (robbery) as compared to lethal crimes (homicide). Or, as some previous research suggests, increased wealth associated with gentrifiers, in fact, provide an opportunity for criminal activity (Cohen and Felson 1979; Covington and Taylor 1989; Kreager et al. 2007). However, as we describe below, this observed effect of the increase of coffee shops on robbery may very well be related to important ways in which gentrification unfolds across neighborhoods with different racial composition.
Race–Specific Effects
Our descriptive analysis, as well as prior research, suggests that gentrification is a highly racialized process. And, while both Black and non–Black neighborhoods might gentrify, our Non–Black Hispanic factor suggests that it is in gentrifying non–Black neighborhoods that coffee shops proliferate. Given the spatial distribution of coffee shops (Figures 3 and 4), one might expect that the effect of gentrification associated with our coffee shop measure on crime would be greater in White neighborhoods or neighborhoods that were moving toward White gentrification. Framed in our discussion on ecological dissimilarity, the crime reduction associated with gentrification should not be equally distributed between Black and non–Black neighborhoods. 20
To assess how such racialized processes may modify our findings, Figure 5 presents the unstandardized regression coefficients from race–specific regression models for our final homicide (Model 5) and robbery (Model 10) equations. In the present analysis, we categorize a neighborhood as “White,”“Hispanic,” or “Black” as the majority racial composition (50 percent or more) at any given time period. 21
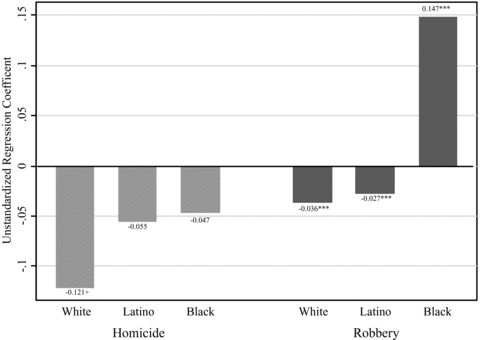
Race–specific effects of coffee shops on homicide and robbery.
Figure 5 demonstrates that the effect of coffee shops on homicides is larger for White neighborhoods as compared to Hispanic and Black neighborhoods but the effect is negative for all groups. That is, all neighborhoods experiencing coffee shop growth also experience a corollary decline in homicide, but the effect is more pronounced in White neighborhoods. In contrast, the effect of coffee shops on robbery is negative for White and Hispanic neighborhoods (and quite similar in magnitude), but the effect is positive and quite large for Black neighborhoods. Therefore, gentrification is associated with declines in robbery in White and Hispanic neighborhoods, but increases in robbery in Black neighborhoods. This dramatic difference between White/Hispanic gentrifying neighborhoods and Black gentrifying neighborhoods most likely explains the change in direction of the coffee shop variable in Model (10).
This finding may very well relate to the different ways in which gentrification is patterned across racial lines. Whereas poorer White and Hispanic neighborhoods tend to be gentrified by Whites, Black neighborhoods are more likely to be gentrified by middle– or upper–class Blacks. This also means that gentrifying White neighborhoods (such as Wicker Park in Figure 4) are in closer spatial proximity to other White or Hispanic communities. Thus, while the socioeconomic status of a community might change dramatically, the ethnic and racial composition might not. Black neighborhoods—even those with declining crime rates and those that are gentrifying—do not attract or develop coffee shops at the same rate as White/Hispanic neighborhoods and are, therefore, unlikely to experience the similar crime reduction trends found in White and Hispanic neighborhoods. As it stands, Black neighborhoods—even gentrifying Black neighborhoods such as Chicago's Bronzeville—continue to have high rates of crime and violence (see Kirk and Papachristos 2011). The absence of this symbol of gentrification, as well as the preexisting high levels of crime, may be the product of several factors, including: racially discriminatory practices of corporations, banks, and public investment (Wacquant 1989; Yinger 1995); the general lack of amenities and retail establishments in poor Black neighborhoods (Small and McDermott 2006); differences in Black and White patterns of gentrification (Hyra 2008; Pattillo 2007); differences in consumption patterns; or other neighborhood processes that influence crime. In addition, Black gentrifying neighborhoods in Chicago tend to be spatially proximate to other high–crime Black communities and, thus, do not receive the same ecological benefits of White/Hispanic gentrifying neighborhoods.
Discussion and Conclusion
This study examines the relationship between gentrification and crime by constructing a new measure of gentrification—the spatial and temporal diffusion of coffee shops across a city. The novelty of this approach is threefold. First, our measure of coffee shops captures an aspect of gentrification that is discussed in the qualitative literature but has rarely been quantified. Second, our measurement of coffee shops offers an alternative to census–based indicators that are measured intermittently and, as Sampson (2009) shows, tend to exhibit very little change at the neighborhood level over time. In contrast, the number of coffee shops provides an on–the–ground measurement of how lifestyle amenities—which many agree are crucial to gentrification's success—increase over time and across space. If coffee shops are established in particular neighborhoods and not others, then tracking this process helps confirm precise patterns of gentrification with a robust and relatively easy to capture variable.
Descriptive analysis confirms gentrification and crime are socially and spatially concentrated phenomena: levels of homicide and robbery tend to be higher in disadvantaged Black neighborhoods, whereas gentrification—but especially, gentrification as measured by coffee shops—tends to be concentrated in higher income areas with non–Black residents who have recently moved into the neighborhood. Furthermore, coffee shops are noticeably lacking in Black neighborhoods, even those with declining homicides.
Longitudinal models provide the most direct evidence regarding the thesis of this paper: the greater the number of coffee shops in a neighborhood, the greater the neighborhood decline of homicide and robbery during the observation period. That is, our measurement of gentrification is strongly correlated with a neighborhood's level of homicide and robbery. With regards to homicide, more coffee does equate with less crime—and the effect is similar for both White and Black neighborhoods. However, the effect of coffee shops on robberies varies significantly by the racial composition of the neighborhood. As with homicide, coffee shops have a negative effect on robberies in White and Hispanic neighborhoods. In majority Black neighborhoods, though, we find the opposite effect: coffee shops are associated with higher levels of robbery. This underscores the qualitative research finding that gentrification in Black neighborhoods takes a different form than gentrification in White neighborhoods—in this case, Black neighborhoods do not attract coffee shops, or rather, coffee shops are not opening in gentrifying Black neighborhoods, a finding consistent with research on other neighborhood–level resources (e.g., Small and McDermott 2006).
Our study is not without limitations, two of which are worth mentioning here. First, our use of census indicators and coffee shop variables captures some—but decidedly not all—gentrification processes. Excluded from our analysis are other (related) gentrification processes—such as city planning, the displacement of residents, the demolition of public housing, and individual tastes and residential preferences—that may very well interact with the variables considered in our analysis. Gentrification is a complex and dynamic process. While our coffee shop measure maps onto one dimension of gentrification, we readily acknowledge that it misses others. As such, we see this study as an incremental improvement upon prior quantitative gentrification research. Second, given the divergent trends in increasing coffee shops and declining crime rates, there is a possibility that both trends are related to an unobserved third variable. While our use of fixed effects models attempts to control for such unobserved factors, future research would do well to consider further exploring these trends.
Gentrification is a politicized and controversial urban phenomenon. Though we find a relationship between gentrification and crime, by no means are we suggesting gentrification as a feasible urban policy to lower crime rates. Many high–crime neighborhoods do not have the structural or spatial characteristics that fuel gentrification or attract the interest of external corporate investors. Moreover, the qualitative literature has demonstrated that the harsh consequences of gentrification include the displacement of the urban poor, especially in poor Black neighborhoods (Abu–Lughod 1999; Rymond–Richmond 2007; Smith 1996). In other words, while gentrification may be “good” for crime rates, it may be “bad” for the people it displaces. Future research would do well to consider how such processes unfold in less racially segregated locations beyond Chicago, as well as why crime goes down in gentrifying neighborhoods, such as the displacement of the urban poor, the deterrent effect of increased policing, or new economic opportunities. Conversely, future scholars in this field should ask why crime rates remain high in certain Black neighborhoods, even when they are gentrifying or experiencing other sociodemographic shifts associated with declining rates of crime and violence.
Supporting Information
Supporting Information, CICO_1371 - More Coffee, Less Crime? The Relationship between Gentrification and Neighborhood Crime Rates in Chicago, 1991 to 2005
Table A1. Descriptive Statistics for the 1990 Census and Crime Variables
Supporting Information, CICO_1371 for More Coffee, Less Crime? The Relationship between Gentrification and Neighborhood Crime Rates in Chicago, 1991 to 2005 by Andrew V. Papachristos, Chris M. Smith, Mary L. Scherer, and Melissa A. Fugiero, in City & Community
Table A1. Descriptive Statistics for the 1990 Census and Crime Variables
Supporting Information
Supporting Information, CICO_1371 - More Coffee, Less Crime? The Relationship between Gentrification and Neighborhood Crime Rates in Chicago, 1991 to 2005
Table A2. Bivariate Correlations of 1990 and 2000 Census Variables
Supporting Information, CICO_1371 for More Coffee, Less Crime? The Relationship between Gentrification and Neighborhood Crime Rates in Chicago, 1991 to 2005 by Andrew V. Papachristos, Chris M. Smith, Mary L. Scherer, and Melissa A. Fugiero, in City & Community
Table A2. Bivariate Correlations of 1990 and 2000 Census Variables
Footnotes
Acknowledgments
The authors would like to thank Cassiopeia Galfas, David Hureau, David Kirk, Andrea Leverentz, Jenny Piquette, Don Tomaskovic–Devey, Shawn Trivette, Christopher Wildeman, Christin Glodek, and the anonymous reviewers for feedback on earlier versions of this manuscript. Special thanks to Richard Block, David Cort, and Diane McKinney for their assistance in acquiring the necessary data.