
Abstract
Opt–e–scrip, Inc., has developed a patented test for determining the efficacy of drugs in individual patients so that doctors can prescribe the drug that really works for each person. In addition, test results show that older, less expensive drugs are often as or more efficacious than the newer, expensive drugs pushed by manufacturers. It, thus, benefits physicians, patients, and drug benefit payers. However, the company has had difficulty entering the market, given its complexity and their lack of resources. The test remains a product in search of an application and a customer willing to pay for its usage.
Overview
Huser and Reitberg came from the pharmaceutical industry: Huser from marketing, and Reitberg from R&D. Both were convinced that the industry could give, and its customers should be getting, better value from prescription drug therapy.
To be approved by the U.S. Food and Drug Administration (FDA), a new drug had to be proved safe and effective through studies in which one group of patients received the test drug while a second group usually received a placebo. 1 The patient groups used in the testing were typically homogeneous (usually younger, healthy, white, and, historically, male)—ignoring the fact that drug response could be very idiosyncratic, varying widely among different patients. To prove efficacy, the test group's response to the test drug was required to be statistically higher than the placebo group's response to the placebo for these homogeneous test groups (S. Toker, MD, personal communication, May 17, 2007). The testing did not prove that the test drug was more effective than competing (perhaps cheaper) drugs (Meier, 2004, p. C1). Nor did it prove that that the test drug would work in any one particular patient, or even that it would work in a majority of patients. Hence, when a doctor prescribed a drug, there was no certainty that this was the best medication for that patient.
Opt–e–scrip, Inc. sought to measure a person's response to a drug by utilizing an individual test that would compare a test drug and a control drug; the patient would take both, and the results would show the patient's own drug reaction. The objective was to help physicians and patients find the best drug therapy and, at the same time, steer patients away from expensive new therapies if they were not beneficial.
Product, Potential, Pricing, and Primary Benefits
The personalized medicine test (PMT) typically contained two competing prescription medications—a name brand drug and a less expensive therapeutic substitute (a generic version of an older name brand drug that treated the same condition but had gone off patent). The medications were only for chronic ailments—requiring long–term, perhaps life–long, therapy. The PMT could also pair a drug and a placebo or different doses of the same drug.
The drugs were blinded (encapsulated so that the patient did not know what he or she was taking), and their order in the kits was randomized to preclude any order bias. A questionnaire tracked the patient's response to the drugs in terms of the alleviation of symptoms and of any side effects. How long the patient took each medication was determined by the drug's pharmacokinetics (how the drug works in the body). Multiple crossovers from one drug to the next were used to substantiate the drug's impact on the patient by essentially re–testing the effect.
The use of the kit began with a physician's prescription, as would the use of any drug. The prescription was submitted to a mail–order pharmacy, which, in turn, mailed the kit to the patient with instructions and a questionnaire. After the patient completed the kit (1–2 months, depending on the drugs involved), OES analyzed the data and delivered a report to the physician, who then recommended a therapeutic course of action based on the patient's drug reactions (Figure 1).

The PMT Kit. Blister Cards, With Blinded and Ordered Test Drugs, are Packed in the Box With Questionnaire
OES held patents on kits for 24 chronic–care categories. The company's Private Placement Memorandum (PPM) noted that the U.S. retail market for these categories was over $87 billion in 2001 with 1.4 billion prescriptions written. 2 The company had developed usable kits for three of these categories: anti–ulcerants for chronic heartburn or gastrointestinal esophageal reflux disease (GERD); analgesics for pain from osteoarthritis; and antihistamines for allergic rhinitis. These categories had retail sales of approximately $23 billion in 2001. OES selected them for the initial kits based on their market's size and the presence of major drugs and on the ease of developing kits (see Table 1). In addition, OES had developed written protocols (rules for the timing and order in which the test drugs would be taken) for four other categories, with retail sales of approximately $25 billion: depression, diabetes, hypertension, and attention deficit/hyperactivity disorder.
OES PMT Category Data
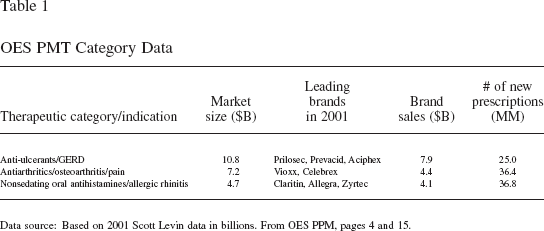
Data source: Based on 2001 Scott Levin data in billions. From OES PPM, pages 4 and 15.
OES sold its kits at the price generally paid for the same number of doses of the brand name drug being tested (roughly $200 on average for the initial kits). At this price, the payer should be price–indifferent between a prescription for the brand name drug and the PMT. According to OES, its pricing would yield an estimated gross margin of 25% or more with large–scale production.
The company claimed that its product offered two distinct benefits: (1) a “totally objective and systematic assessment of the best medication for each patient, optimizing the patient's clinical outcomes” (hence the company's name); and (2) an “apparent high therapeutic substitution rate in favor of less expensive drugs, which could dramatically reduce prescription drug expenses” (PPM, p. 3). OES data from early beta–testing of the initial three chronic–care categories showed that from 41% to 87% of patients were either indifferent between the name brand and less expensive therapeutic substitute or actually preferred the substitute (Table 2). 3
OES Beta Test Results

Actual sample size was 35 people per category. This was extrapolated to the larger sample size noted here (163, 105, 113) based on multiple crossovers of the test drugs (retesting of the drugs multiple times in the kit).
Switch rates indicate the percent (with 90% confidence) of beta–test patients that demonstrated superior or parity performance of the generic drug over the branded drug.
Patient compliance indicates the percent of beta–test patients completing the PMTs to the point where accurate predictions could be made.
From OES PPM, page 4.
Industry Issues
The company believed that the dual benefit of the PMT was important, enabling patients, physicians, and payers to get more value from prescription drug therapy, especially in light of three issues which they thought currently compromised care: the low response rates of major drugs, the spiraling cost of drug therapy, and the conflicts of interest that affected the prescription drug market.
Issue (1): Low Drug Response
Drug efficacy ranged from high in some categories to dismal in others. According to data obtained by OES, the nonresponse rates of drugs marketed at the time in the categories for which OES had patents included 46–77% for Paxil (depression), 36–44% for Claritin (allergic rhinitis), 20–35% for Celebrex (osteoarthritis), and 10–15% for Prevacid (GERD). 4 Overall, as noted by the former president of Genzyme Genetics, “drug efficacy averages 50 percent” (Blagg, 2008, p. 20).
The issue of drug response was further complicated by the placebo effect: when a placebo provided a measurable benefit in the patient. According to a feature article in The New York Times Magazine, 35–75% of patients in studies of new drugs benefited from taking a placebo, and sometimes this placebo response exceeded the active drug response (Talbot, 2000). A Wall Street Journal columnist called the placebo effect “the loony aunt the pharmaceutical–industrial complex prefers to keep locked in a barn” and raised the question as to whether “half of the drug's effectiveness is placebo response.” The article indicated that there are “arguments on both sides . . . . After 50 years of testing its products . . . against placebos, the drug industry still doesn't have a handle” on this question (Jenkins, 2001, p. A19). 5
Issue (2): Spiraling Costs
Spending on prescription drugs was increasing rapidly. U.S. retail pharmaceutical sales grew over 15% in 2002 to $162 billion, with an annual compound growth rate of almost 17% since 1997, and were later projected to reach roughly $500 billion in 2012 (Plunkett, 2006). An analysis by The New York Times indicated that three factors contributed to this escalation: an increase in the number of prescriptions (due substantially to an aging population), a shift to higher–cost drugs, and a general increase in drug prices (Pear, 2001).
The growth rate was expected to decelerate somewhat over the next decade, as the drug pipeline was slowing and a number of major branded drugs were expected to lose patent protection. Expiration of patents would give less expensive generic brands the opportunity to take a larger share of those markets (Pharmaceutical Preparations, 2006). In fact, by 2002, generic drugs had surpassed branded drugs to make up a majority of the U.S. market by the number of prescriptions sold (Hensley, 2004). However, according to OES, despite this higher utilization rate overall, name brand drugs still accounted for the majority of prescriptions in many categories. Data provided confidentially to the company by a large regional health insurer on two of the categories for which OES had kits (allergic rhinitis and GERD) showed that the generic drugs accounted for only 7–8% of prescriptions for this insurer's members.
Issue (3): A Labyrinthine and Conflicted Market
The market for branded pharmaceutical drugs was complex and complicated, typically involving eight or more parties in drug manufacturing, distribution, coverage, and payment. In addition, the goals of these parties were often in conflict and not always focused on optimizing patient care. A major factor in both the market and its conflict was the pharmaceutical company, which used various tactics to influence key customers: notably, the pharmacy benefit managers (PBMs), doctors, and consumers. Footing the bill for the employee drug plan, employers were often caught in the middle.
As explained in the Appendix, the PBMs managed prescription drug plans for payers—employers or the insurance companies they hired. They decided which drugs would be covered by the plan and how (which drugs would be put on the formulary, on which tier—generic, preferred, non–preferred—and with what co–pay). Pharmaceutical companies worked very hard to get their products on the preferred list. One technique was to offer rebates to the PBMs, which might not be passed along to or even known by the payer. The rebates could be substantial and tied to performance, such as increases in sales and market share of the discounted drugs. Documents and testimony in a lawsuit against Medco, a large PBM, stated that Medco “was paid more than $3 billion in rebates in the late 1990s to promote sales of certain drugs” (Freudenheim, 2003, p. C1) and that these “deals . . . drive up health care costs for employers and consumers” (p. C3).
Physicians acted in theory as gatekeepers and advocates for their patients. However, pharmaceutical companies also worked hard to get doctors to support their drugs. Their sales detailers visited medical practices, providing free product samples, complimentary items, and lunches, leading some doctors to complain of “being besieged in their offices” (Hensley & Martinez, 2005, p. A1). The companies also organized dinner presentations to physicians by medical specialists. Some leading medical practitioners described these presentations as “championing certain medicines” (Meier, 2004, p. C1) and as “sales talks” rather than informational sessions (Hensley & Martinez, p. A1). A professor at Harvard Medical School claimed, “Drug companies are adept at barraging doctors . . . with slick messages touting their most expensive products—even if they are no better than older, more affordable standbys” (Avorn, 2006, p. A.15).
Consumers customarily relied on the expertise of their physician to recommend the best therapy. Increasingly, however, pharmaceutical companies used advertising to influence consumers directly. Spending on such advertising exceeded $3 billion in 2003 (Leading DTC Spenders, 2004), well beyond the $2.6 billion spent in 2001, which was up 500% versus 1997 (Jenkins, 2001). According to The Wall Street Journal, “the importance of direct–to–consumer advertising in building drug brands by spurring patient demand is beyond debate” (Hensley, 2004, p. R9).
For the employer, a drug benefit plan was a substantial cost; the more generous the plan (more expensive drugs on the preferred list and lower co–pays), of course, the greater its cost. Drug benefit plans were only part of employers‘ rapidly increasing burden of health–care coverage (Abelson, 2002). Research cited by Michael Porter and Elizabeth Teisberg indicated that “96% of CEOs and CFOs are significantly or critically concerned about health care costs” (Porter & Teisberg, 2004, p. 75).
Opt–e–scrip History: The Early Days (Through 2002)
In the early 1990s, Reitberg became intrigued with the idea of using a single–patient drug test to determine drug efficacy and side effects in each patient. He thought such a test would be useful to pharmaceutical companies in developing new drugs and tracking side effects from existing drugs. He approached several companies, but none was interested. According to Huser, “Pharma was concerned that the test could limit the market potential of their drugs and invite issues with the FDA.”
Reitberg introduced the concept to Huser in the mid–1990s while they were working at Novartis Pharmaceuticals, with Huser as President and CEO of Consumer Health and Reitberg as his Vice President of Scientific Affairs. Huser considered the methodology powerful and thought it had substantial potential, especially to benefit what he called “the Three P's”: physicians, patients, and payers. He was aware of a relatively new movement within medical education and practice called evidence–based medicine (EBM): the “use of current best evidence in making decisions about the care of individual patients. The practice of evidence–based medicine means integrating individual clinical experience with the best available external clinical evidence from systematic research” (Sackett, Rosenberg, Gray, Haynes, & Richardson, 1996, p. 71). It seemed to Huser that the PMT was the perfect tool to implement EBM and, thereby, to make a significant improvement in prescription drug therapy. He mulled over the idea of working with Reitberg to market the kits and, over the next several years, investigated the concept with friends in the industry and potential investors.
Opt–e–scrip, Inc. was launched in 2000 with $1,931,000, from family, friends, and the personal savings of Huser and Reitberg. The two founders were also investing sweat equity, receiving stock and options in lieu of salary. Among the early investors were several doctors and a pharmacist who were very enthusiastic about the medical benefits of the OES methodology. In addition, Huser recruited a Board of Directors that included a personal friend, a professional acquaintance, and a former FDA Commissioner—albeit long retired and now in his eighties. He was confident that OES could quickly raise the remaining funds needed to commercialize the idea. (Initially, his intent was to secure $10 million to $20 million. The business environment at the time was very positive, with venture capital [VC] money readily available.) OES rented an office space large enough to house a pharmacy, which Huser and Reitberg thought necessary to fulfill orders, as well as a small operation to assemble kits, plus offices for executives and staff whom the founders recruited from among their professional friends and former colleagues (Figure 2).
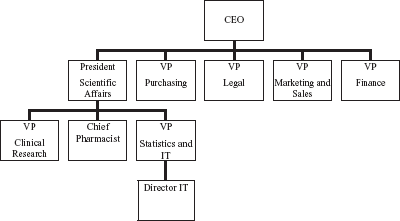
OES Organization Chart and Management Profiles (c. 2000/2001)
Senior Officers
OES proceeded on a four–pronged strategy: applying for patents to cover the PMT process; developing and validating the kits for the chronic–care categories considered most promising; confirming the patient, physician, and insurer acceptance of the concept; and seeking funds from venture capital firms. The first three progressed smoothly.
OES received patents, effective through 2014, and validated PMT kits for allergy, GERD, and arthritis (Reitberg, Del Rio, Weiss, Rebell, & Zaias, 2002; Wolfe et al., 2002). They located, after much searching, equipment to make the kits on a small–scale basis. Two waves of concept testing among patients taking drugs in the kit categories (50 per category; 150 in total) determined that most patients would be interested in trying the PMT (68% on average), would ask their doctor about it (77% on average), would use it if prescribed (88% on average), and believed that it would be valuable to them (75% on average). There were also in–depth interviews with physicians prescribing medications for the three kit conditions. Eight of the 18 physicians interviewed were very favorable to the concept, indicating a high likelihood of using at least one of the PMTs in their practice. The report from the market research company that collected the data indicated that the OES system was a viable proposition among physicians, particularly among specialists; it further noted that trial interest was strong as compared with similar studies they had conducted. OES also sponsored research among health insurance executives, interviewing top managers from 13 companies. The research summary was positive, concluding that the PMT was attractive to these executives. However, the summary also noted that OES would need to make it easy for plan administrators and doctors to implement the PMT and would need to demonstrate cost savings that justified its use.
Separately, an article in the Journal of the American Medical Association provided what Huser considered the AMA's implicit endorsement of the PMT. Specifically, the article indicated that a single patient test—referred to as a N–of–1 test 6 —was first in a hierarchy of suggested evidence to be used by the physician for treatment decisions (Guyatt et al., 2000).
Moreover, in January 2002, OES entered a contract with RxWest, a small PBM that Huser and Reitberg considered an important strategic partner. Under the agreement, RxWest provided OES with a licensed mail–order pharmacy operation that would assemble and dispense OES test kits to all 50 states, eliminating the need for OES to set up and operate its own assembly site and pharmacy or navigate the legalities of shipping drugs across state borders. With the proper equipment, RxWest would have the capacity to assemble 20,000 kits per month for 60 different PMTs. It could also provide claims processing and collection for OES and would carry the costs of drug inventory and accounts receivable. Furthermore, RxWest indicated its interest in marketing the kits to new clients.
Raising venture capital proved more difficult. The bursting of the “dot com bubble” devastated many VC funds. The attack on the World Trade Center added further misery to the financial markets. Fund managers became extremely conservative, preferring to buy into the tried and true rather than introduce more risk with a new, potentially disruptive technology. They noted two major concerns with OES: the difficulty of securing cooperation from important players to commercialize the PMT and the lack of any proof of its potential. When VCs did express interest, Huser thought, it was basically to acquire OES's patent and packaging rights while giving little if any return to investors. Huser also sought funding from various potential partners, such as large pharmacies, PBMs, and even the internal venture capital arm of a major pharmaceutical company. While there were several nibbles, no one swallowed the bait. One former high–level Medco executive noted that “the concept is brilliant.” However, discussions typically yielded only a request to keep in touch and let them know when OES had revenues. By the end of 2002, OES had closed its office to conserve funds (which had been spent primarily on salaries but also for rent, office and kit–assembly equipment, research, and legal services). Half of OES's original staff had left the company, and the others now worked part time from home.
Opt–e–scrip History: On to Test Market (2003–Early 2004)
During the summer of 2003, Huser secured agreement from Independence Blue Cross (IBC) and its PBM, Medco, to begin a market test in the Philadelphia area. This opportunity was largely due to Huser's personal connection with an IBC board member and was partially funded by a $250,000 loan (convertible to stock) from a Huser family member. With annual drug spending of about $1 billion, IBC covered more than 4 million people, or 65% of potential patients in the Philadelphia area, where Medco also was a significant market force. For this test, OES would market the PMT to the local physicians most likely to be prescribers, Medco would process the claims, and IBC would provide coverage to its customers that submitted them. RxWest would assemble and dispense the kits. OES would analyze and report results to the physicians.
OES contracted with a medical education supplier to deliver eight informational dinner meetings with physicians. The 53 doctors who attended were largely internal medicine and general practitioners, although a few were specialists. The cost of the eight meetings ran about $2000 each. Each doctor received a $100 honorarium to attend the dinner and $300 if he or she dispensed four kits within 4 weeks afterward. After that introductory period, OES would not be able legally to compensate doctors directly for dispensing kits. 7 Huser hoped that after dispensing four kits, a doctor would be familiar with them and appreciate the kits‘ patient benefits, and therefore would be self–motivated to continue prescribing them.
The company achieved a 19% trial rate, with over 70% of those doctors prescribing again (2–20 kits each) as of March, 2004. Among private practice doctors, the trial rate was much higher—44%—and yielded revenues of about $5,000. By far, the best response was from groups to whom Huser himself spoke to save the speaker's stipend; he received a standing ovation from the doctors in one group. The modal number of kits dispensed was 3–4 per physician, despite follow–up phone calls from Huser and personal service from the OES staff. The one physician who dispensed 20 kits was very enthusiastic about the program and volunteered to speak with doctors and other interested parties (and later did so with one VC).
During this time, OES also hired a boutique investment–banking firm, founded by a friend of Huser, to intensify their search for new capital in return for a 6% finder's fee. The consequent PPM requested an investment of $8 million to commercialize the venture, assuming initially an expansion of the IBC test with more insurers and more physicians in the Philadelphia area. The PPM (with the assumptions and financials shown in Table 3) was circulated to VC firms in the pharmaceutical arena, but there were no takers.
Selected Financial Documents (Abridged from OES PPM, pp. 6 and 24)

Net paid in capital in 2003 was the original investment. Year 1 represents an increase of $5,250,000 ($5,000,000 from new funds and $250,000 from converting the 2003 loan to stock). Year 2 represents another increase of $3,000,000 in new funds (for a total of $8,000,000).
Meanwhile, once marketing support was discontinued in the test market, the doctors largely stopped prescribing the kits, and the test was terminated. Huser found the experiment frustrating but informational. He drew these conclusions:
It was difficult to get cooperation from the PBM. Medco could not or would not set up its internal systems to process the claims efficiently. Huser thought that Medco considered OES a “disruptive nuisance.”
It was difficult to get cooperation from IBC. The people with whom Huser interfaced for the test could not or would not set up the appropriate reimbursement procedures or even endorse the use of the kits.
The only doctors who were significantly interested in participating were those in private practice, not those affiliated with hospitals, clinics, or academic institutions. The latter did not typically follow the patients over a long–term cycle of care, and, hence, could not dispense a follow–up prescription for the drug that offered the best therapy.
It was difficult to get physicians to continue prescribing. Once they were not compensated, they were not very willing to use the kits, with some literally asking: “What's in it for us?”
In general, OES had to deal with, motivate, and satisfy too many intermediaries.
Concurrently, it became clear that RxWest was not going to dispense kits on its own. While they may have used the idea of OES to market to new members, they had never actually implemented the benefit.
Huser was very concerned about the physicians‘ lack of motivation to continue prescribing. Without their support, he feared the kits would never be used.
Opt–e–scrip History: New Options and New Management (2004 Continued)
Huser began to consider other approaches that would essentially “mandate” the PMT. At this point, he saw two options: get employers to require the PMT as part of their drug benefit; or get the government to require it for Medicare and Medicaid patients and, hence, make it best practice for all doctors.
His first effort was to gain employers‘ support. He believed that they would be very interested in the cost savings OES could provide. It was well known that U.S. automobile manufacturers, and specifically General Motors (GM), were struggling with the cost of employee health–care benefits. Huser made several attempts to contact human resource executives at GM, even using a highly placed relative of OES's investment banker. The response to every attempt was that GM's PBM, Medco, set the plan's formulary. Based on his test experience with IBC, Huser thought that a follow–up with Medco would not be productive: “We are too small; there is just not enough organizational presence to get on their radar screen.” And the prospect of approaching other employers was too daunting for the understaffed OES.
Instead, OES approached the federal government for funding and to use the kits in the Medicare program. The Medicare Modernization Act had been enacted in 2003 and would be implemented in 2006. The act mandated a new drug benefit for seniors, to be provided through private insurance companies. Secondarily, it stipulated that private payers involved with the Medicare drug benefit must have in place a medication therapy management service for patients taking chronic–care drugs to evaluate and monitor their response to drug therapy and to ensure use of the most cost–effective drugs.
Huser was excited by this new law. It seemed to him that the government would want very much to reduce the potentially enormous prescription drug costs of Medicare: Part D, as the new benefit was called. Huser noted that the benefit's annual cost had been estimated at between $20 billion and $50 billion (later revised up to approximately $100 billion [Pear, 2007]), with chronic–care drugs accounting for a substantial piece of that cost. He also saw the PMT as a way to deliver the medication management service. He anticipated a possible partnership in which Medicare could help fund the expansion of the kits to all 16 major chronic–care drug categories and require their use.
OES hired a prominent Washington public relations (PR) firm to obtain an audience with Medicare and promote federal legislation to fund OES. OES paid the PR firm a retainer of $10,000 per month for 5 months during the second half of 2004. As a result, OES gained entry to the Agency for Health Care Research and Quality (AHRQ), part of the Center for Medicare Services. In the subsequent meeting, OES pushed for a demonstration project to be funded by Medicare; AHRQ offered only the possibility of funding a small pilot program that OES considered redundant and inadequate. Despite several hopeful moments, OES's success with Congress was similar. At one point, it looked like $500,000 in funding for OES would be part of an upcoming bill, but that funding was later eliminated. During discussions with AHRQ and Congress, Huser noted, “no one faulted the premise of OES.” Everyone was “verbally supportive, just not financially helpful.”
For new management, Huser turned to a former colleague and member of the Board, Tom Moore, to take over day–to–day management and fund–raising as COO. Huser would be sending his second child to college in the fall of 2004, and his personal finances were a wreck after years without compensation: “Frankly, I needed a paying job.” Moore had significant experience and contacts, as former worldwide head of health care for a major consumer goods company and former CEO of a biotech company. Moore was given stock options as payment, much like the remaining OES staff.
What to do Next
By the end of 2004, Moore and Huser had commitments for an additional $1,050,000 from private investors, largely from a friend of the Huser family who was a major executive at a large medical device company. Hopes and enthusiasm ran high once again, although it was clear to Moore and Huser that OES had to get broader funding to market effectively.
Huser wanted OES to pursue a new strategy with this infusion of funds. By this point, the company had approached pharmaceutical companies, a PBM (RxWest), insurance carriers (various members of Blue Cross–Blue Shield), employers (in particular GM), and the government (Congress and AHRQ), each without success. He was now considering two new strategies: turning OES into an insurance carrier or a PBM.
If OES were a health insurer, it could require the use of the kit by its PBM and promise employers and their employees better drug therapy as a result. OES also could compensate doctors and give them incentives to continue prescribing the PMT. OES could reap the cost savings that would come when covered patients moved to less expensive, generic medications, as the earlier test results promised. However, Huser foresaw a number of legal, financial, and marketing issues. He would certainly need lawyers to research insurance licensing and regulations, as insurance companies were licensed and regulated separately by each state. For example, each state required certain financial reserves to cover claims; the amount depended on the type of insurance provided and the number of people covered. In New Jersey, he estimated, OES's required reserve could be $1 million or more; OES would need additional capital to meet this requirement. In terms of marketing, while the health insurance industry was dominated by the big five, OES would compete in the prescription–only market niche. Huser knew of only one such competitor in New Jersey, and that company focused on serving municipal governments. That company was very successful, enough so that its CEO was self–funding his run for state governor. But, Huser worried, “Even competing with small niche players, already entrenched in the market, might be too difficult and expensive for us.”
The second strategy was to transform the business into a PBM that could require the PMT for the categories in which kits were available. OES would target a minor segment of the market that the large PBMs were less inclined to serve—the small, self–insured employer. He thought that these groups would be most interested in the cost savings possible with OES and therefore willing to require their employees to use the OES kits. OES would solicit business initially via direct mail and hire a back–office company to process the retail claims and work with retail pharmacies. RxWest would handle mail order requests. Huser believed that the best way to compete was to sell total transparency, passing along to the employer all rebates and substituting a straightforward administrative fee. This was a fairly new idea, and although the large PBMs were developing some contracts based on this premise (Wessel, Wysocki, & Martinez, 2006), Huser suspected that they did not like to do it.
There was an obvious third option that loomed like a specter before Huser: Perhaps he should just shut down the business? He could use the new funds to dissolve the enterprise and try to sell what he considered its only asset—the PMT patents; any remaining money would go back to investors. However, this was something he did not want to embrace. For one, he did not relish facing his supporters with failure. And, more important, despite past problems, he was convinced that the PMT was “simply too good a technology not to have a significant role to play.” With new funds to fuel a new strategy, he thought that OES could grow into a successful business. As he prepared to celebrate the close of 2004 and the advent of the new year with friends and colleagues, he was excited to celebrate as well the close of one chapter of OES and the beginning of a promising new one.
Footnotes
1.
This would not be the case in conditions that involved serious risk to the patient's health (e.g., cancer or AIDS); in such cases, a new therapy would be tested against the current “standard of care” being used by medical practitioners.
2.
The PPM was written by OES in July 2004 to elicit funding from private investors; the data referred to here are from the 2001 Scott Levin Prescription Audit.
3.
The company indicated that the lower switch rate in anti–ulcerants noted here was due at least partially to how this test was constructed. The test was conducted among patients already using Prilosec, a proton pump inhibitor (PPI) drug. At the time, there was no low–cost PPI drug to compare with Prilosec; instead, the test used Zantac, an H2 blocker, which had a different “mechanism of action” (methodology) for treating GERD. In essence, the kit was testing, not “apples and oranges,” so to speak, but perhaps “Gala apples” versus “Granny Smith.”
4.
These data were sourced from New Drug Applications—referred to in the industry as an NDA. These were applications to the FDA by pharmaceutical companies for approval of their new drugs and included data from multiple controlled studies on how a drug performed versus a placebo. Nonresponse rate refers to the percent of patients who received no efficacy (symptom relief) from the drug. The opposite of the nonresponse rate is the efficacy rate. If the nonresponse rate of a drug is 40%, then the efficacy rate is 60%.
5.
Examples (based on the NDA data noted) help clarify the point being made by Jenkins. Claritin had an average drug efficacy rate of 60%, offset by an average placebo efficacy rate of about 40%; one could argue that the true drug response rate was only 20%. The highly effective Prevacid had an efficacy rate of up to 90%, offset by a placebo efficacy rate of up to 40%; one could argue that the true drug response was only 50%.
6.
Academicians referred to the single patient test as an N–of–1 test, because the N, or sample size, was one person.
7.
According to Huser, “Fraud and Abuse” regulations made direct compensation for the doctors to continue prescribing impossible. Basically, the only party that could compensate doctors ongoing would be an “at risk” party (i.e., payers).
Appendix: The Pharmaceutical Drug Market
For greater understanding of the multiple players involved, the pharmaceutical drug market can be thought of at three different levels: the parties involved in the manufacturing and sale of the medication (referred to here as “physical drug distribution”); the parties involved in providing the patient's prescription benefit (referred to as “benefit distribution”); and the prescription distribution that starts the process. This is illustrated in the chart below and described more thoroughly in the text that follows.
Note to Instructors for Opt-e-scrip,Inc.
Key Issues and Discussion Points
The OES case highlights important entrepreneurial and management strategy issues. Specifically, it provides the springboard for a deep discussion of how the nature of the industry; the combination of opportunity size, company resources, and team capabilities; and the company's valuation by outside investors all affect its ability to enter the market and be successful. Case analysis should be organized by and grounded in these issues and close with an assessment of the company's options at the end of the case in light of this analysis.
The following questions can be used to lay the groundwork for discussion. These questions are intended as preparatory work and should be given in advance to help the student focus as he or she reads the case.
Potential Audiences and Uses
The case is most applicable to an MBA course where the focus is specifically on entrepreneurship and management strategy. The challenges in the case offer a unique vantage point for a number of learning objectives, most importantly:
Suggested Teaching Approach
The analysis of this case should make use of constructs developed by Timmons and Spinelli (2004) on opportunity identification and development. An industry analysis should be performed by using Porter (2008). For more specific information on the challenges in the U.S. health care industry (and, by extension, in the pharmaceutical industry, which is part of it), Porter and Teisberg (2004) provide insight into the highly entwined and anticompetitive relationships within the industry. These sources should provide important tools of analysis to explore the opportunities and obstacles experienced by the entrepreneurial team, as they seek to gain market entry to the industry. The company valuation requires the use of Internal Rate of Return and Discounted Cash Flow calculations. In addition, independent research by the students on the pharmaceutical industry and industry trends would be valuable to update and extend the case content. An industry expert could be helpful to deepen the students‘ understanding and analysis of the case, including a physician, an academician in the field of health care, or someone from a pharmaceutical company, PBM, or insurance carrier. The instructor, however, needs to be aware and make the students aware of the potential hidden (or not) agendas and biases of these parties.
Role of the Authors
Eleanor Ann Huser started the original case study for Opt–e–scrip, Inc. in 2001, with most of the work completed in 2004–2006. She was the CEO's wife and had witnessed the company progress through its birth and the subsequent, challenging stages of development. As a professor and former marketer specializing in new product development, she was intrigued by the prospect of bringing such an apparently needed technology to market. The PMT seemed a rational and innovative means of tackling the issues of making better informed choices regarding medicines and potentially lowering the escalating spending on pharmaceutical drugs. The human story of the company's trials and tribulations in trying to commercialize the technology also seemed to be an important cautionary tale with rich learning for students interested in entrepreneurship. Ethné Swartz became involved with rewriting the case study in late 2006. She was essential in providing theoretical expertise in strategy, entrepreneurship analysis frameworks, and company valuation. The case was tested in her graduate entrepreneurship and strategy classes. The case and the teaching note benefited from the divergent perspectives that each author brought to the analyses and content of the documents.
The authors found the task of presenting data about the U.S. pharmaceutical industry a significant challenge. While much of the case material came from extensive interviews with the CEO and the OES Private Placement Memorandum, the authors wanted to insure that the case was accurate and, therefore, pursued outside information, combing published industry data, consulting their professional and social network of industry experts, and also personally reaching out to the FDA to verify important information regarding drug research and efficacy rates.