
Abstract
Background
The disability-adjusted life year index is used extensively to compare disease burden among diseases and locations, but difficulties remain in accurately estimating the nonfatal stroke burden in years lived with disability.
Aims
To improve stroke-related years lived with disability estimates in Western Australia for 2000, by improving the accuracy of component inputs: nonfatal (28-day survivor) incidence, disease duration and disability (severity) weights.
Methods
Nonfatal stroke incidence and the mortality difference between prevalent cases and the general population were estimated from linked hospital and mortality data using the Western Australian Data Linkage System. Dismod software used these inputs to model disease duration. Disability weights were estimated from population-based stroke survey data, using indirect health valuation methods and adjusting for prestroke disability. Years lived with disability were calculated from the three components.
Results
The annual age-standardised nonfatal incidence (n = 1985) was higher ***In males (121/100 000) than females (96/100 000). The duration varied between 35.8 (females 15–24 years) and 3.4 years (males 85+ years). The mean pre-stroke-adjusted disability weight was higher at 4-months (0.38) than at 12-months (0.31). The age-standardised rate of nonfatal burden in males (302/100 000; 95% CI 290–314) was significantly higher than that in females (250/100 000; 95% CI 240–260). The nonfatal proportion of stroke burden (males 45%; females 37%) was higher than estimated in previous studies.
Conclusion
This study illustrates that previous reports most likely underestimated disability burden as a contributor to the total stroke burden in Australia. Methodological refinements will contribute to burden of disease studies elsewhere.
A comparable measure of health outcomes in populations is needed to support the evidence-based priority setting in health. To this end, the Global Burden of Disease (BoD) Study introduced a framework for quantifying population health in which premature mortality and loss of health from nonfatal conditions were combined into a single metric – the disability-adjusted life year (DALY) (1). In countries with good vital registration data, estimation of years of life lost (YLL), the mortality component of a DALY, is relatively straightforward. However, accurate estimation of years lived with disability (YLD), the nonfatal component of a DALY, requires more extensive analyses of data from multiple sources (1). In this framework, YLD for each disease are calculated as the product of incidence, average duration and severity. The first two parameters are not always available and are derived using specialised computer software (1 2). The third parameter, a value-based adjustor for disease severity called a disability weight (DW), is obtained using health valuation methods (1 3 4).
Data on the occurrence of stroke are reasonably reliable if complete hospital admission data are available and can be complemented with information on nonhospitalised cases. There are several difficulties in estimating stroke burden. To begin with, true stroke incidence should reflect ‘first-ever’ strokes in the year of interest, and yet this information is not routinely recorded. Second, the risk of dying in those surviving the acute period following stroke is not well described. While a number of follow-up studies have quantified this risk, it tends to be reported for all ages combined and by age at the time of the stroke event rather than the age of death (5–11). Finally, global DW reflects the health loss for a single health state. Without adjustment for comorbidity, disability in the population can be over-estimated, although recent BoD studies have applied post hoc corrections to adjust for independent and/or dependent probabilities of co-morbidity (12–14).
In this regard, two unique data collection systems operating in Western Australia (WA) are available to address many of the difficulties in estimating stroke burden. The first of these is the WA Data Linkage System (WADLS), one of a handful of comprehensive population-based health data linkage systems worldwide, using probabilistic matching to link data from seven core statutory datasets including death registrations and public and private hospital separations (15). Hospital data provide a near-complete record of stroke cases in WA, with an admission proportion of 90% in the main city, Perth (16 17). The ability to link within-hospital data and hospital and death data allows the investigation of the incidence and mortality experience of stroke cases. The other data source is the Perth Community Stroke Study (PCSS) (16–18), which consists of a series of population-based studies fulfilling standard criteria for an ‘ideal’ stroke incidence study, including the use of multiple overlapping sources and diagnostic verification (19). In particular, the PCSS 1989–1990 study collected detailed disability-related information before and after the stroke event (18 20).
In this study, we used the WADLS and PCSS data to estimate the disability burden from stroke (ischaemic and haemorrhagic combined) in WA in 2000. The specific objectives were to:
estimate incidence of (total and nonfatal) first-ever stroke events estimate the excess mortality and average duration for first-ever stroke determine DWs for stroke, adjusting for prestroke disability, and calculate YLD for stroke in WA.
Materials and methods
Because of the high initial case fatality following stroke events (9), we modelled disability separately among those who had died within 28 days of stroke and those who survived this early period. The contribution to the overall disability burden by fatal cases is likely to be minimal as the duration of illness is short. Duration in non-fatal cases was derived by applying a mathematical model (DisMod II) to incidence, excess mortality rate (EMR) and remission information relating to 28-day stroke survivors (2). This model has been used extensively in BoD research to derive consistent epidemiological data from diverse sources.
Incidence of postacute survivors of first-ever stroke
Between July 1988 and June 2002, all admissions with acute stroke or stroke sequelae as either the principal or the secondary diagnosis were extracted from the WA Hospital Morbidity Data Collection, which houses all routinely collected private and public hospital admission data, including diagnostic, demographic and procedural information continuously since 1970. Codes for acute stroke based on guidelines for monitoring the incidence of cardiovascular diseases in Australia (21) were then mapped to ensure that the changeover from International Classification of Diseases (ICD) versions 9–10 was valid. Through linkage within the hospital dataset, cases of first-ever acute ischaemic and haemorrhagic stroke for the year 2000 (ICD10 codes I60, I61, I63 and I64) were identified using a 12-year lead in to check for prior stroke hospitalisations, minimising prevalence pooling (22). Hospital coded data were not considered robust enough to differentiate between stroke subtypes.
Twenty-eight-day survivors of first-ever stroke were identified after checking linked mortality records. Admission proportions from the 1995–1996 PCSS were used to adjust the total first-ever stroke counts for out-of-hospital strokes and to estimate the proportion of out-of-hospital 28-day survivors. Uncertainty intervals for 28-day incidence were calculated using simulation modelling in @Risk software, taking into account stochastic error as well as uncertainties around admission proportions and out-of-hospital death proportions (23).
Excess mortality rates and duration
We defined ‘excess mortality’ as the absolute risk of mortality in prevalent cases over and above the all-cause background mortality risk. This represents advancement over previous EMRs calculated using an incident approach (24). Prevalence in 28-day survivors was defined as individuals who were admitted for stroke between 1988 and June 2002 and were alive during a 5-year ‘observation’ period between July 1997 and June 2002. The mortality risk was calculated from person-years of follow-up and deaths recorded during the observation period. Deaths were attributed to age at death and person-years to the appropriate age over the follow-up period. Uncertainty intervals (95%) were estimated in @Risk, assuming that the observed deaths followed a Poisson distribution. Incidence and EMR (as an approximation of the case-fatality rate) were entered in DisMod II, with a further assumption of no remission to derive estimates of duration by age and gender (2 23).
Disability weights
Disability weights allow for quality adjustment of years lived with a disease, being numerically equal to the complement of preference-based quality-of-life (QOL) weights (DW = 1–QoL weight). Australian BoD studies (25 26) utilised DW developed for a Dutch study (4) in preference to the global DW that were produced for the 1996 Global BoD study (1). In contrast to the Global DW, which produced a single DW for stroke incorporating an implicit severity distribution, the Dutch DW allow region-specific severity distributions to be applied to DW for ‘mild’, ‘moderate’ and ‘severe’ stroke, thereby capturing more representative regional averages. In the Dutch study, conditions and severity states were valued using person-trade-off methods (3 4) alongside health descriptions based on a standardised generic health-related quality-of-life instrument, the EQ5D+ (27). Originally designed as the EuroQol with five health-related dimensions (28) covering mobility, self-care, usual activities, pain/discomfort and anxiety/depression with a three-level ordinal scoring system, a sixth dimension – cognitive function – was added to the instrument to increase the comprehensiveness of the domains (27). Subsequently, a multiple regression model based on 153 Dutch DW and their matching EQ5D+ dimension profiles was developed and validated for the first Australian study (25) to allow predictions of DW for conditions when no DW were available. Predicted weights were constrained to one. In our study, this regression model, published in the first Australian report (25), was applied to the disability experience of Perth cases to predict DW for stroke, adjusting for prestroke disability (24).
Disability data for incident stroke cases identified in the 1989–1990 PCSS (18) were mapped to the health-related dimensions of the EQ5D+ instrument. The PCSS data covering five domains were collected by a single interviewer at baseline, 4-months and 12-months (20). An outline of the mapping is given in Table 1. Mobility and self-care dimensions were evaluated using scores on the Barthel index (29). Scores on the Frenchay activities index (30), which measures higher levels of activity, were standardised using the age-specific prestroke mean and standard deviation. The ‘usual activities’ dimension was determined for each individual from the difference in standardised scores before and after stroke. Results from the Mini-Mental State Examination (MMSE) (31) determined scores for cognitive function. Where MMSE scores were missing (31% of 4-month and 18% of 12-month survivors), proxy reports of cognitive impairment and/or dementia were used.
Mapping of Perth Community Stroke Study (1989-1990) disability variables to six dimensions of the EQ5D+
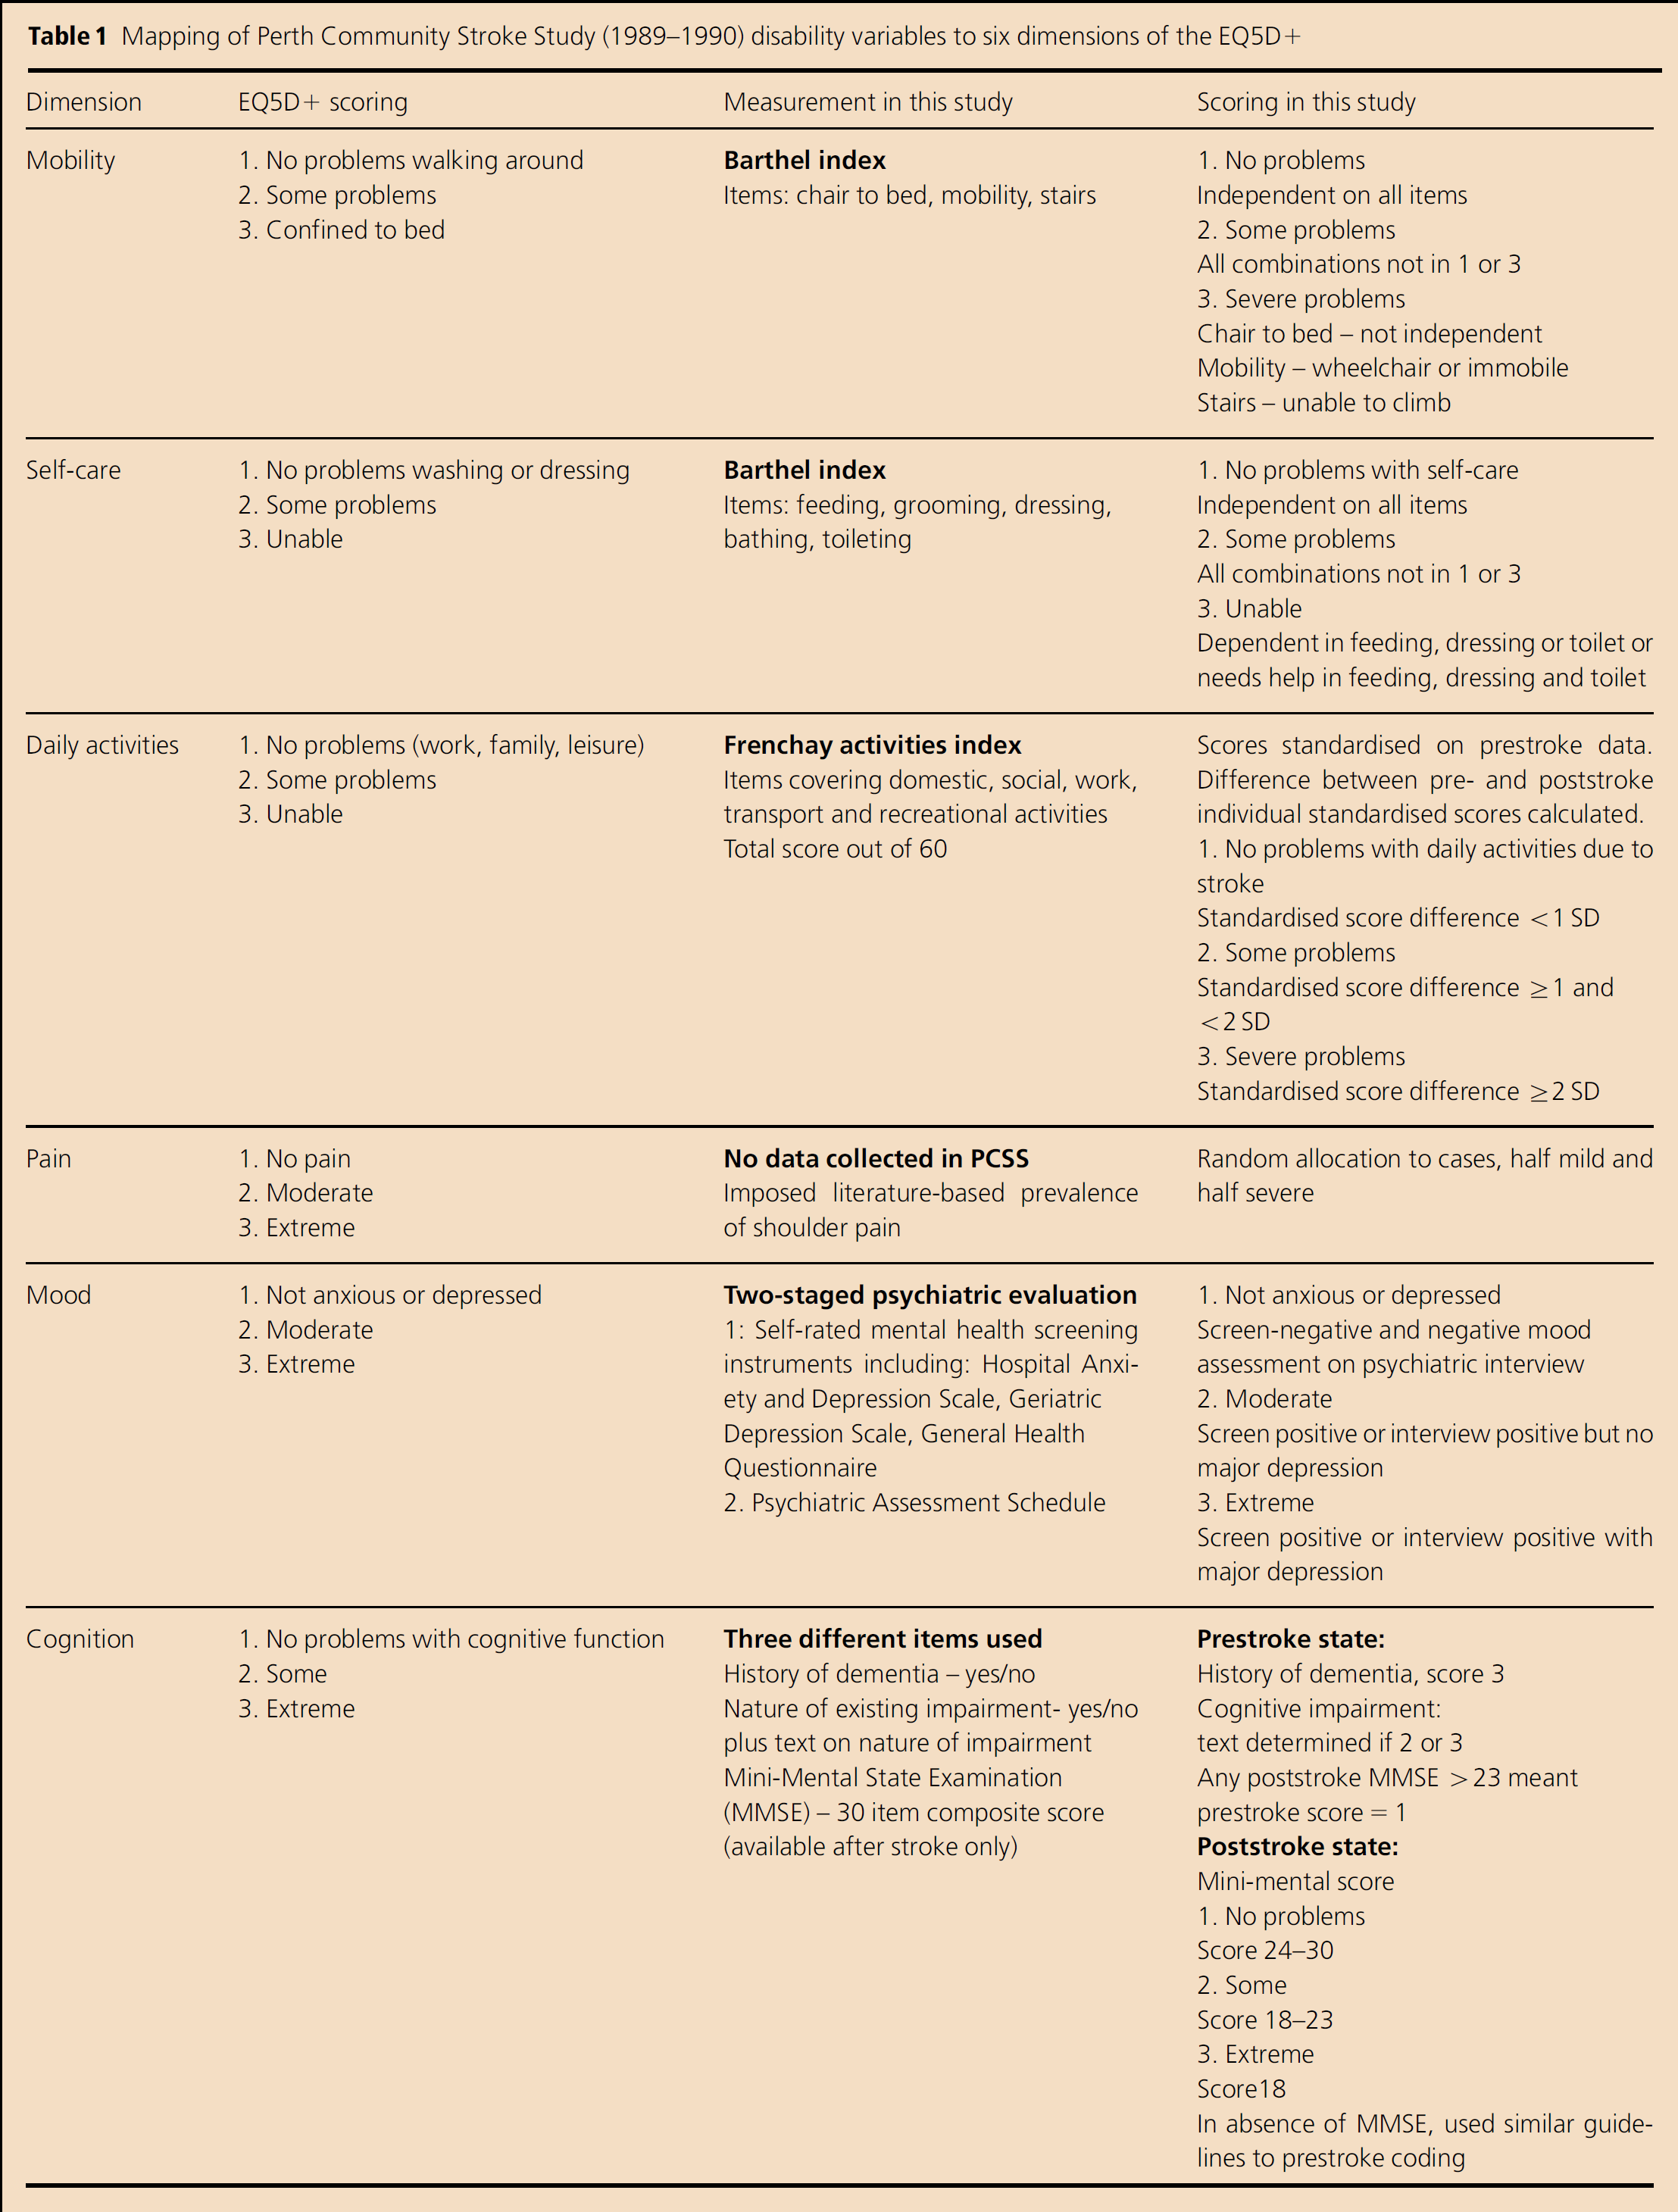
Anxiety/depression scores were based on the results of the psychiatric component of the PCSS (32), where self-administered mental health-screening questionnaires were completed using the Hospital Anxiety and Depression Scale (33), the Geriatric Depression Scale (34) or the General Health Questionnaire (35). At 4-months, cases were followed up in a psychiatric interview using the Psychiatric Assessment Schedule (PAS) (36), while at 12-months, only screen positives on all three measures and those with confirmed disorders at 4-months were followed up. In our study, the anxiety/depression dimension was evaluated using a positive screen and/or a positive psychiatric diagnosis of anxiety or depression on the PAS as an indication of a mood disorder. A psychiatric diagnosis of major depression was the criterion for severe mood disorder.
As no data were systematically collected on pain, a prevalence of 20% stroke-attributable pain was used to estimate the expected number of cases, based on studies of shoulder pain after stroke (37 38). One in five cases were randomly allocated to having pain, with each half categorised as having ‘moderate’ or ‘severe’ pain.
The three-level ordinal scoring system was applied to each dimension for each individual at three time points: prestroke (n = 251), 4-months (n = 182) and 12-months (n = 164) poststroke. Rather than apply mathematical adjustments for comorbidity to DW at the aggregated level for a range of conditions as was done in the first Australian (25) and more recent global studies (14), poststroke dimension scores in the current study were ‘adjusted’ taking into account prestroke levels, using individual-level data. Where dimension scores were the same before and after the stroke, adjusted scores reflected ‘no problems’ in that dimension due to stroke. Thus, where a case was confined to a wheelchair before and after the stroke (mobility score = 3), the adjusted score = 1 as there had been no functional loss due to stroke. Where pre- and poststroke scores differed, the adjusted score took into consideration the ordinal shift in categories. Thus, a person who had some cognitive problems before (score = 2) and severe problems after the stroke (score = 3), the adjusted score = 2, reflecting some but not all, functional loss due to stroke. The Australian-developed regression model (25) was applied to the six adjusted dimension scores for each individual to predict individual-level DW at 4-months and 12-months, allowing the calculation of mean age-specific ‘pre-stroke-adjusted’ DW at 4-months and 12-months poststroke.
Years lived with disability
Age- and gender-specific YLD were calculated from the incidence and duration of 28-day survivors. Pre-stroke-adjusted DWs at 4-months were used for YLD in the first year and DW at 12-months for subsequent years. YLD were discounted (or deflated) at 3% to take into account society's preference for short-term benefits. This complies with the standard approach adopted in the Global BoD Study (1 13 39), which applies an arbitrary discounting rate of 3% while in most economic analyses the discount rate ranges between 3% and 5%. Uncertainty intervals were calculated using simulation methods in DisMod II taking into account uncertainty distributions for incidence and EMR (2). YLD were added to previously published YLL estimates (40) to obtain the total DALYs.
Results
Incidence
An estimated 2489 people aged 15-years and over in WA suffered a first-ever stroke in 2000, which generated an annual age-standardised rate (WHO standard) of 134 per 100 000 for males and females combined [95% confidence interval (CI): 129–140/100 000].
One in five (20%) cases were estimated to have died in the acute period, with a small difference between males (19%) and females (21%). The nonfatal incidence (28-day survivors) increased with age. The age-standardised rate was significantly higher for males (121/100 000; 95% CI 114–129) than females (96/100 000; 95% CI 90–102) (Table 2).
Total stroke incidence and 28-day survivor incidence rates: Western Australia 2000
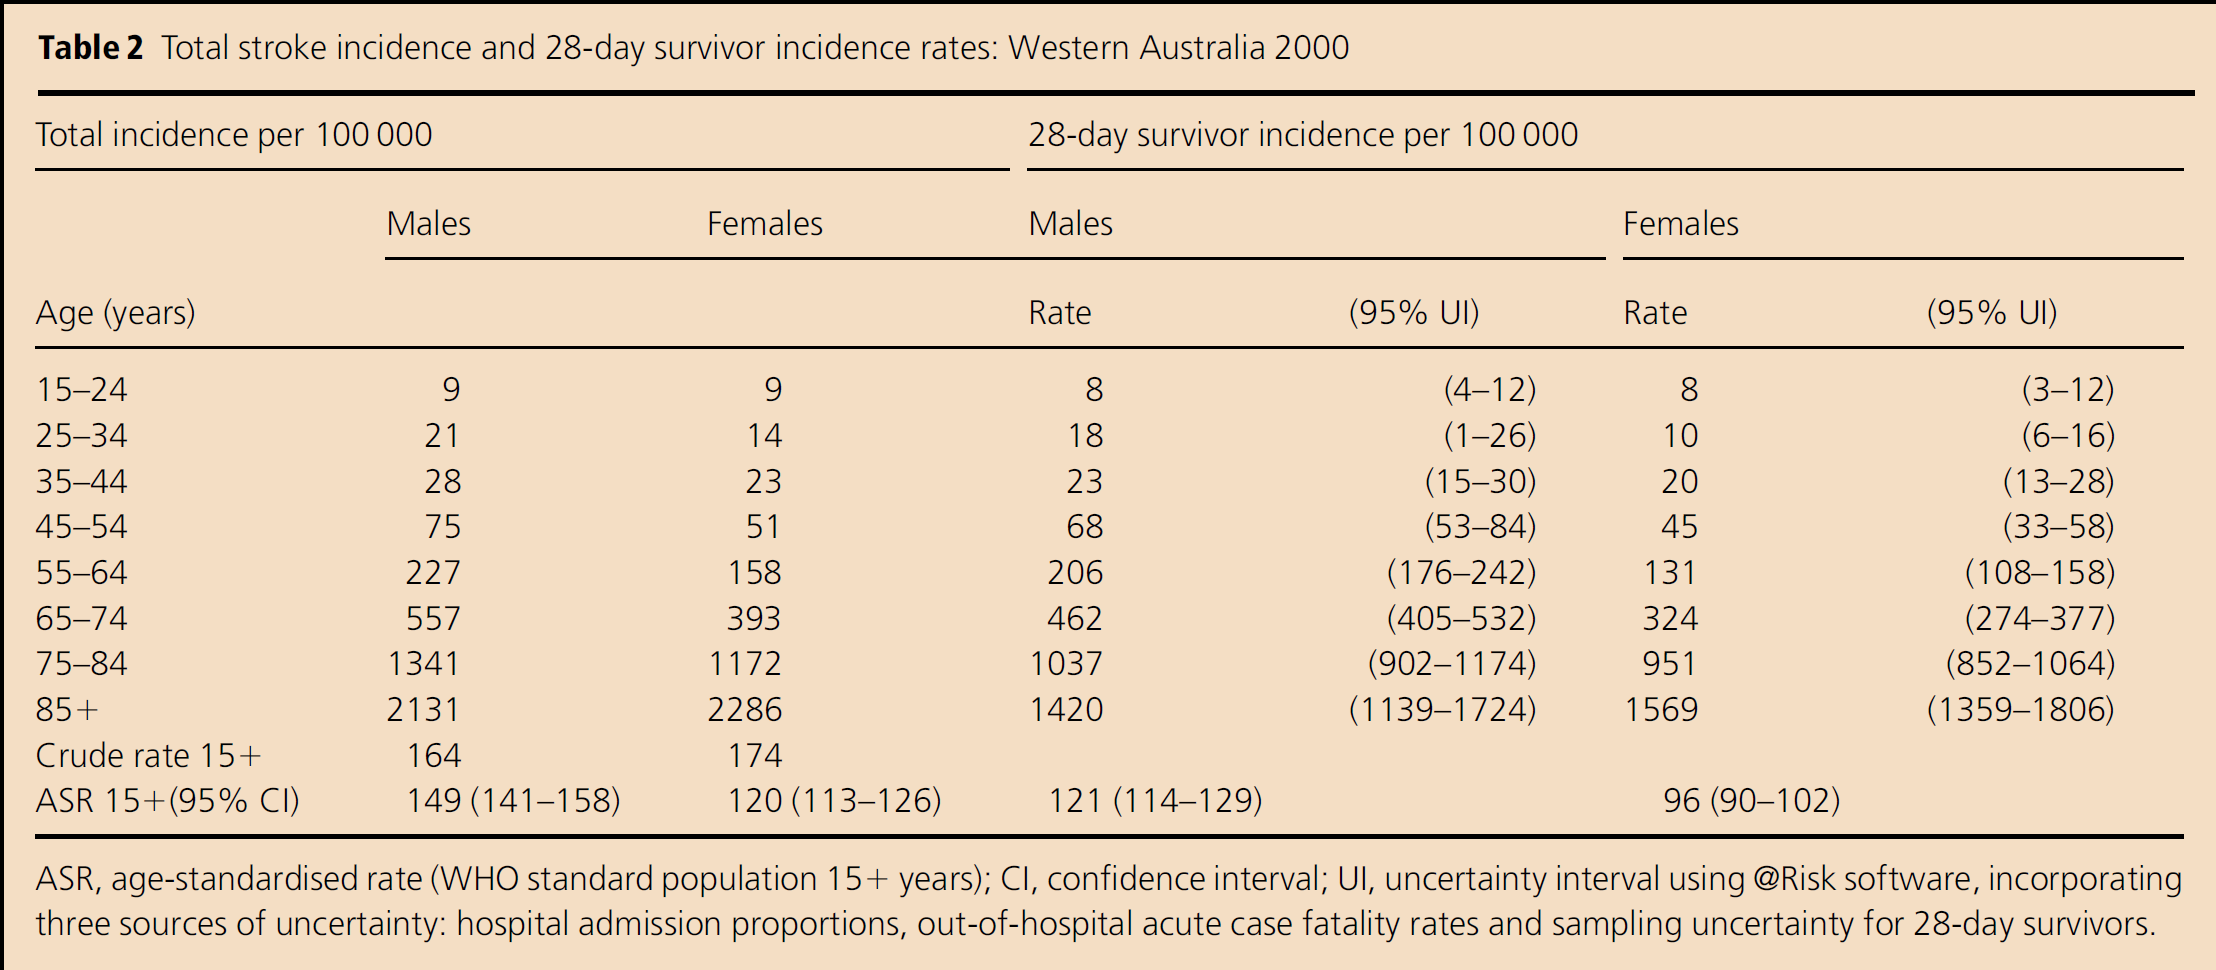
ASR, age-standardised rate (WHO standard population 15+ years); CI, confidence interval; UI, uncertainty interval using @Risk software, incorporating three sources of uncertainty: hospital admission proportions, out-of-hospital acute case fatality rates and sampling uncertainty for 28-day survivors.
Excess Mortality Rates
A total of 21 388 adult 28-day survivors of stroke who had ever been hospitalised since July 1988 for stroke were alive for all or part of the 5-year observation period. Forty per cent (8557) had their first-ever hospitalisation for acute stroke in that period. There were 3537 male and 3572 female deaths among prevalent stroke cases arising from 33 254 and 29 629 person-years of follow-up, respectively. The EMR increased with age, with no significant difference by gender (Table 3).
Excess mortality rates (EMR) in prevalent stroke cases and DisMod II duration estimates, by age and gender: Western Australia 1997–2002
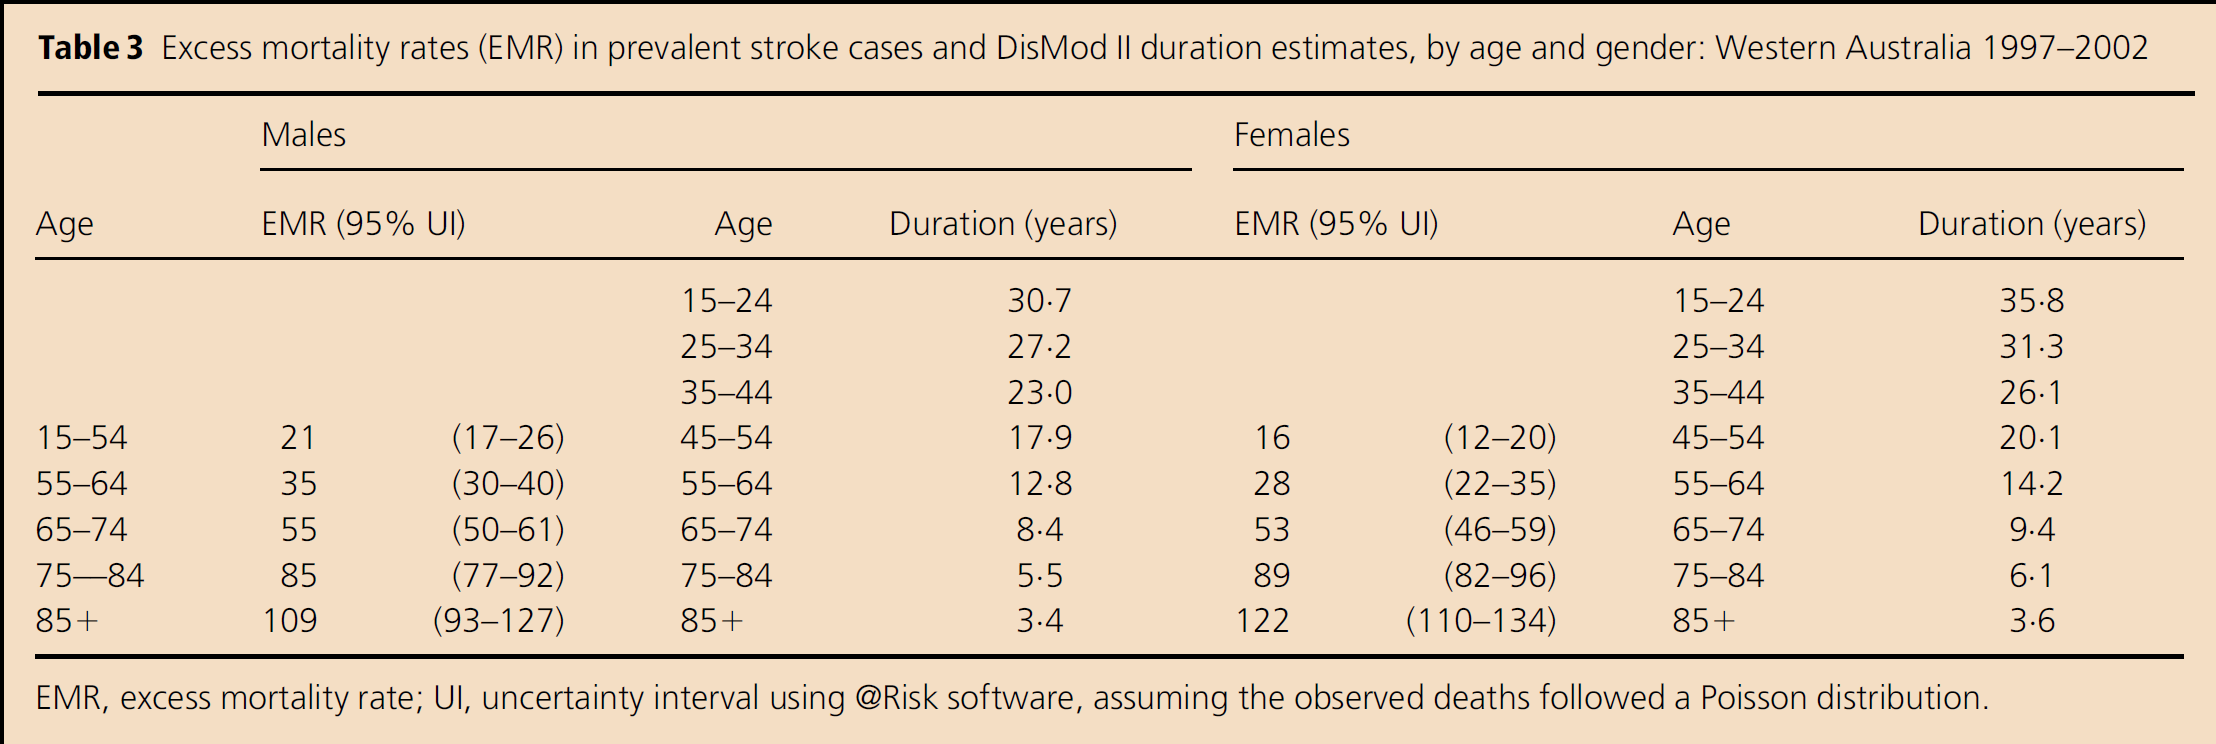
EMR, excess mortality rate; UI, uncertainty interval using @Risk software, assuming the observed deaths followed a Poisson distribution.
Duration
Under the assumption of zero remission, duration estimates derived in DisMod II were determined mainly from mortality. The average stroke duration varied between 35.8 (females 15–24 years) and 3.4 years (males 85+ years), decreasing with age and being consistently higher in females (Table 3).
Disability weights
One in five survivors experienced no stroke-related disability (DW = 0) at 4-months, increasing to one in three cases by 12-months. Figure 1 shows that the pre- and poststroke mean DW increased with age, age differences being less marked when taking into account prestroke disability. Differences between the mean DW, adjusted for prestroke disability, for all ages combined at 4-months (0.38; 95% CI 0.35–0.42) and 12-months (0.31; 95% CI 0.27–0.35) poststroke indicate an overall improvement in function among the surviving group over that period (Table 4) as well as greater survival among those with lesser disability.
Mean disability weights (DW) for stroke, adjusted for prestroke disability, by age group and follow-up period: Perth 1989–1990
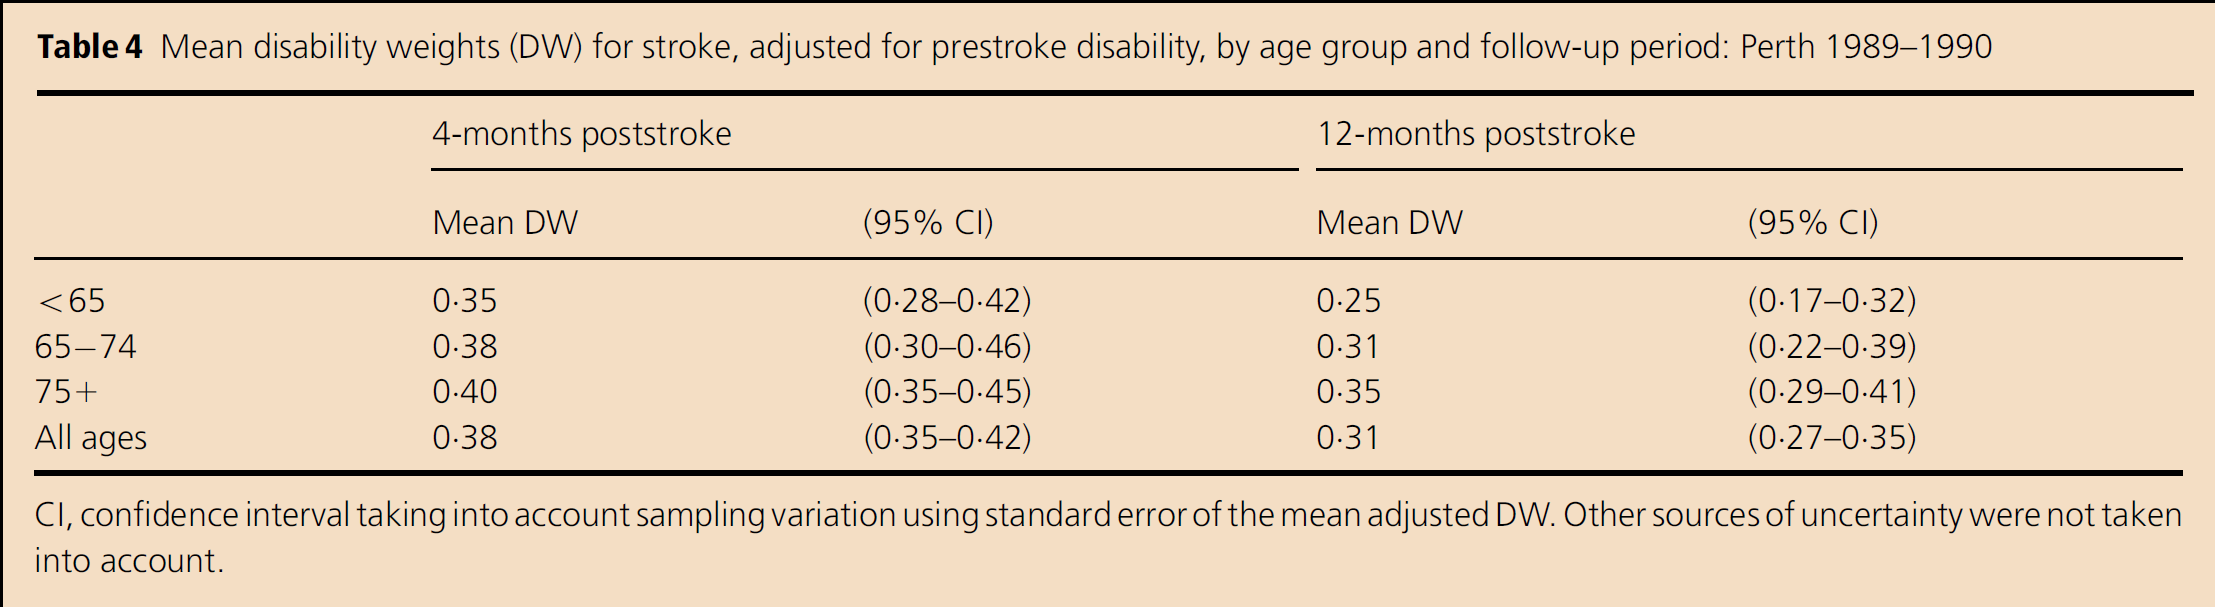
CI, confidence interval taking into account sampling variation using standard error of the mean adjusted DW. Other sources of uncertainty were not taken into account.
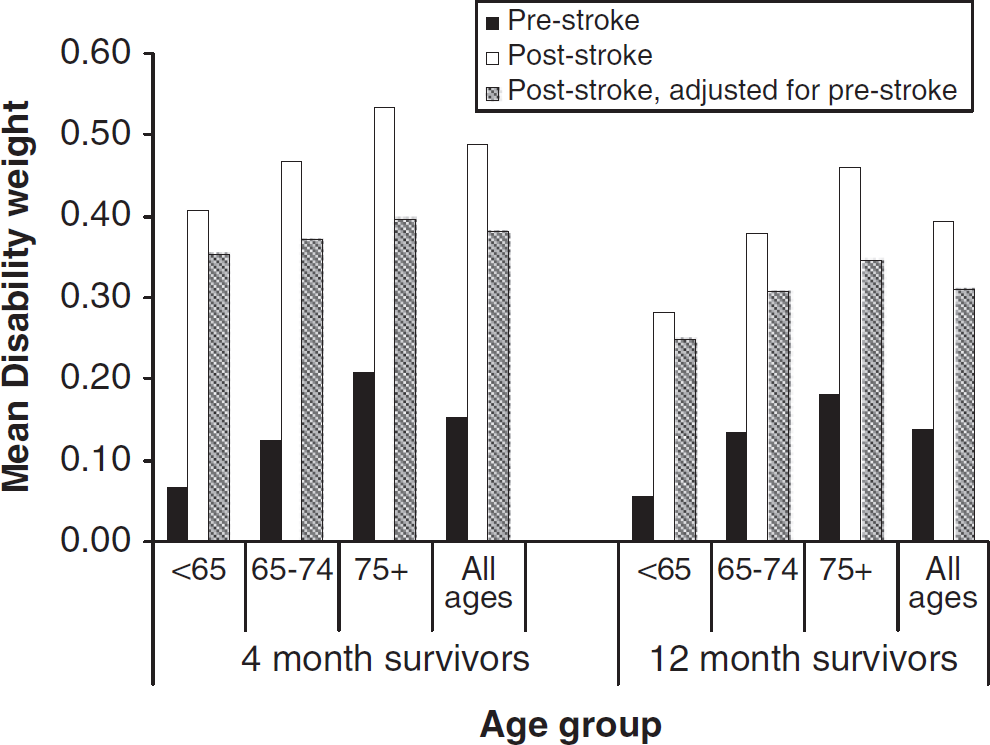
Mean disability weights in first-ever stroke survivors, by age group and time of follow-up: Perth Community Stroke Study 1989–1990.
Years lived with disability
Males and females contributed similarly to total stroke YLD (4750) (Table 5). Female rates were significantly lower than male rates in the 55–74 age groups, resulting in significantly higher age-standardised YLD rates in males (302/100 000; 95% CI 290–314) than in females (250/100 000; 95% CI 240–260). In the 15–64 age group, disability burden comprised 66% of the total stroke male burden and 49% of female burden. By age 85 years and over, disability accounted for 21% of male and female stroke burden. The proportions of total stroke burden contributed by disability, 45% and 37% for males and females, respectively, were substantially higher in this study compared with those based on previous Australian estimates of stroke burden (25) (Table 5).
Years lived with disability: counts, rates and as proportion of total stroke burden, by age group and gender: Western Australia 2000
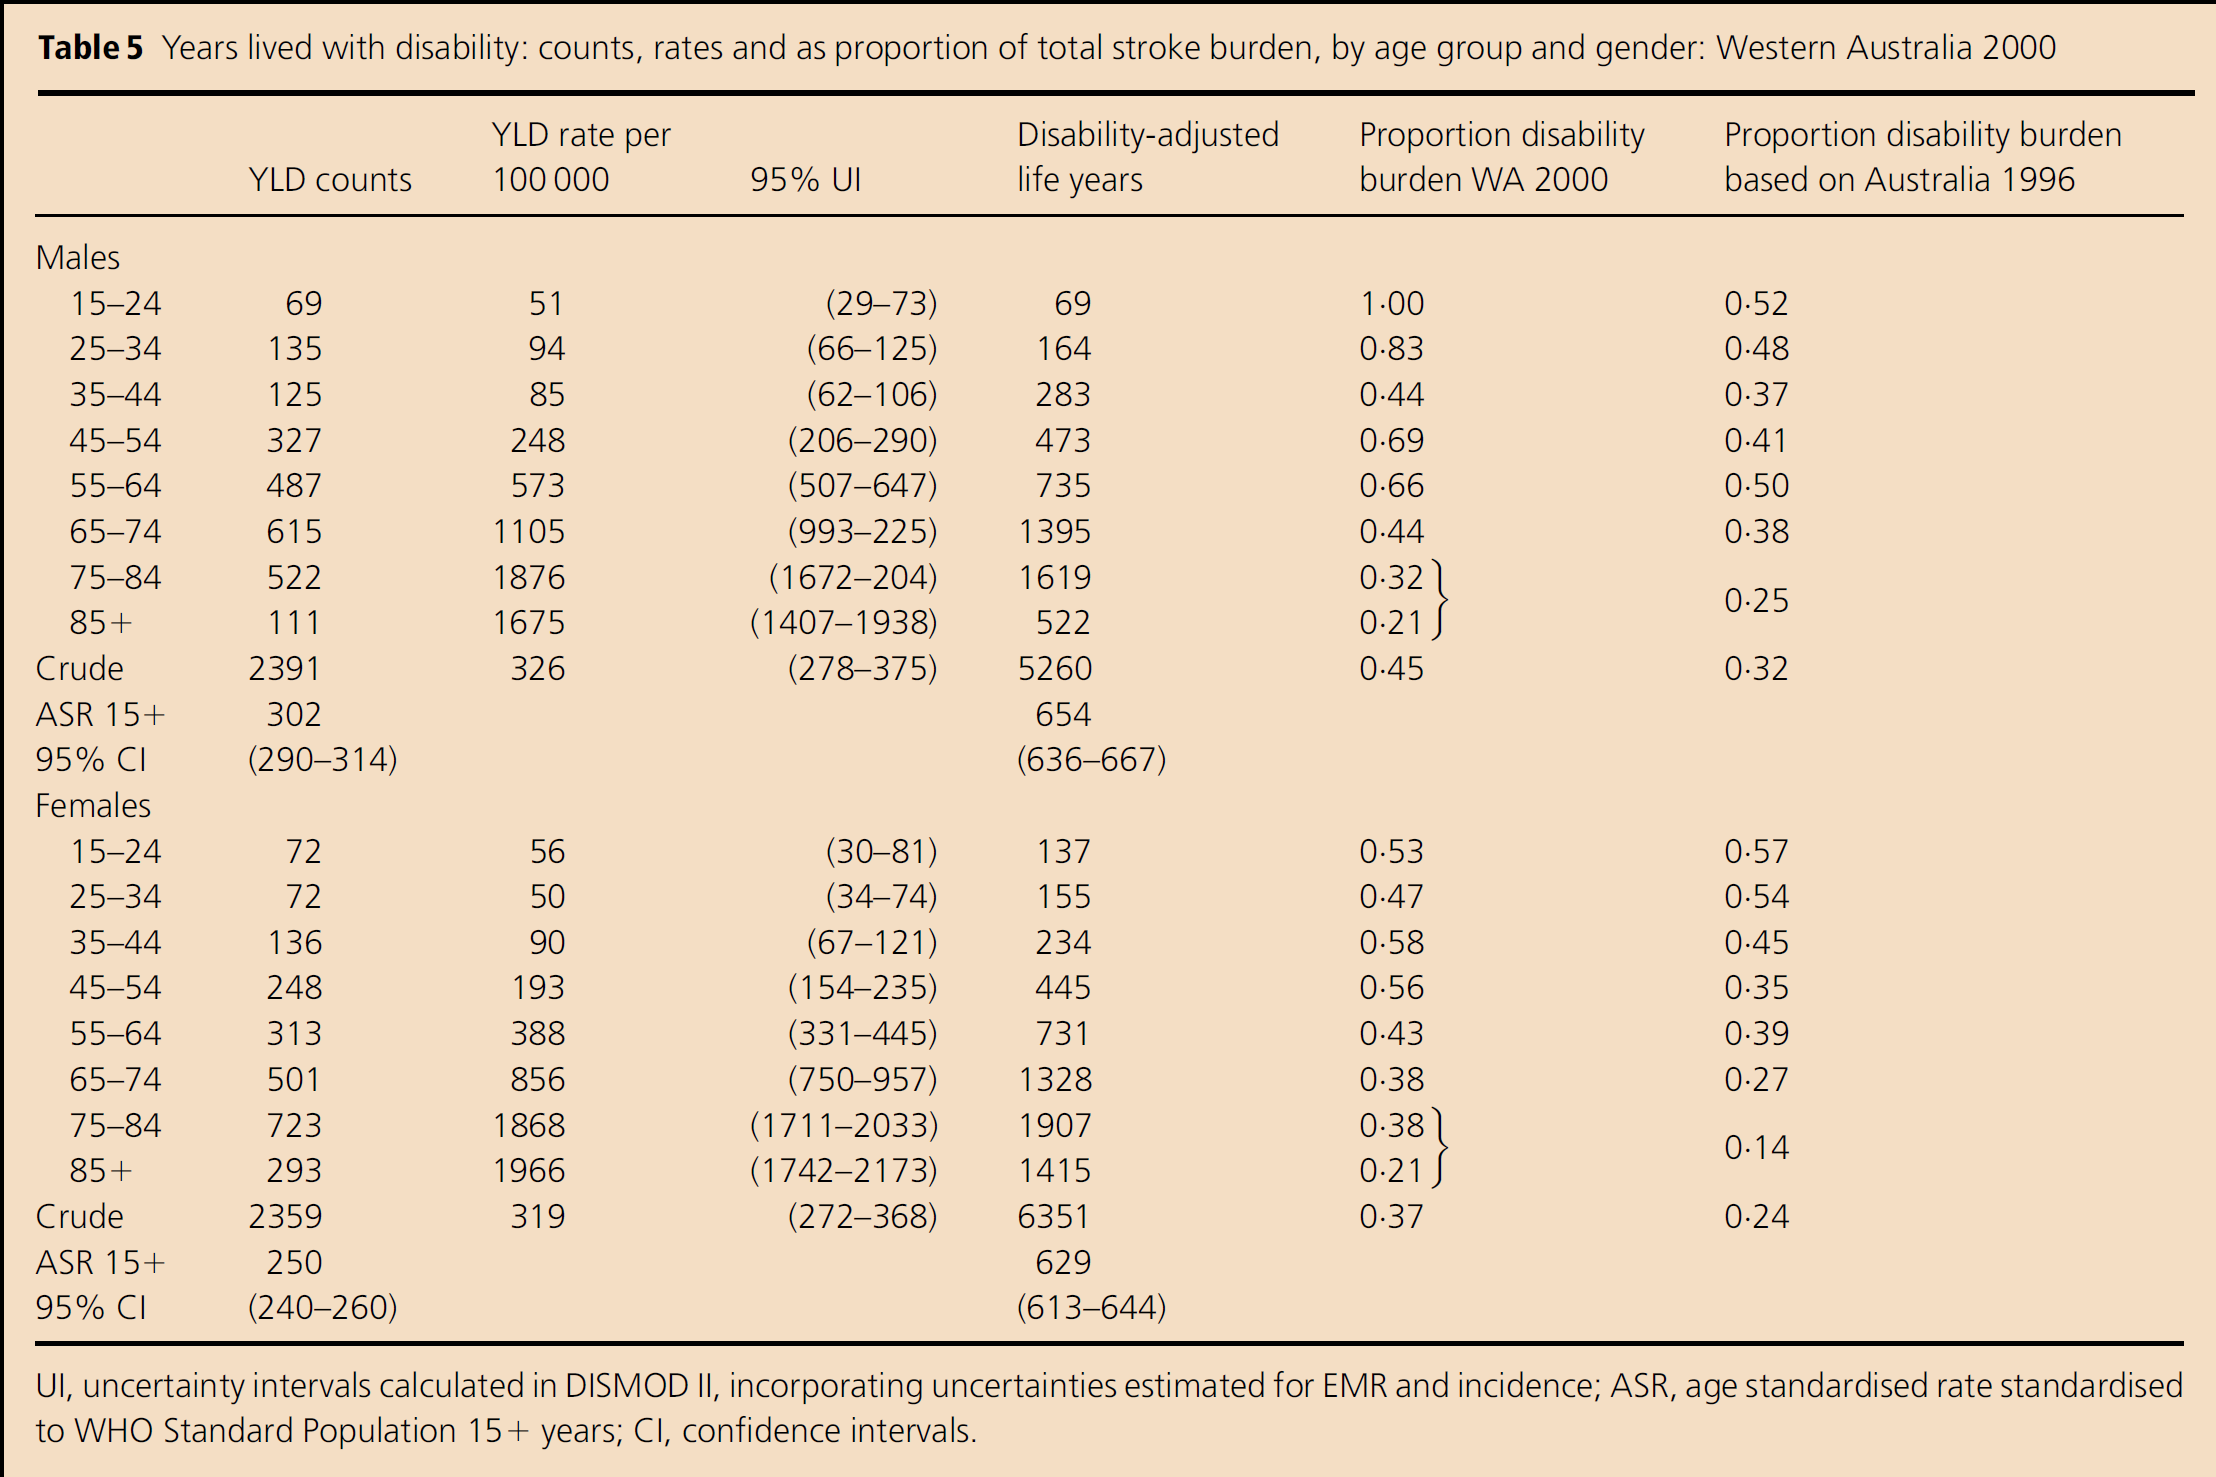
UI, uncertainty intervals calculated in DISMOD II, incorporating uncertainties estimated for EMR and incidence; ASR, age standardised rate standardised to WHO Standard Population 15+ years; CI, confidence intervals.
Discussion
Our study illustrates that previous reports are likely to have underestimated by over 30% the burden from disability as a contributor to the total stroke burden in WA. Some of the variation from previous estimates can be attributed to methodological differences in estimating the three YLD components. As the incidence estimates for WA (2000) using 1996 Australian BoD methods were of a magnitude similar to those using linked data methods, despite greater previous reliance on literature-based assumptions, it is unlikely that incidence contributes substantially to differences in YLD estimates. Our alternative approach to EMR resulted in a lower duration of disability in survivors at younger ages (e.g. WA 2000 estimated durations of 30.7 and 35.8 years for males and females 15–24 years compared with 37.5 and 43.9 years, respectively, in the 1996 Australian report), with the difference reducing with increasing age and reversing among older females. It is therefore likely that this would lower rather than increase YLD among males and younger females. However, the parameter having the greatest bearing on YLD estimates is the higher DW used in this study (0.31 compared with the estimate of 0.17 for Australia 1996 (25), despite adjusting weights for prestroke disability. The average DW for stroke in Australia was apparently under-estimated for the 1996 study, mainly due to less precise estimates of the severity distribution of disability in the population.
This study involves the first application of the WADLS specifically to the needs of the BoD approach. The use of this powerful data source enabled the estimation of all-of-state nonfatal incidence and EMRs based on relatively large sample sizes, filling in gaps that conventional ‘ideal’ small-area population-based stroke studies have not addressed. The quality of the links has been evaluated in audits and validity studies, where it was estimated that <0.3% of links were incorrect. (41) Prevalence pooling can inflate estimates of disease incidence. (22) Compared with a 12-year lead-in, we found that clearance periods of five and 10 years misclassified 2.4% and 0.3% of prevalent cases as incident, respectively (24 42). Thus, prevalent pooling is unlikely to have been a serious problem in our study. State-wide linkage of multiple data sets means that the WADLS can be used for estimating the burden of a number of other diseases in the future.
Compared with other Australasian population-based studies, the overall age-standardised incidence was lower than in Melbourne (1996–1997) (43) and higher than in Perth (2000–2001) (16) but similar to Auckland (2002–2003) (44) rates. Our rates using the linked data approach were comparable if somewhat higher when validated for cases from the geographical area covered by the PCSS in 2000–2001. The somewhat reduced internal validity of the linked data approach can be offset by the increased external validity of results representing WA as a whole. Nevertheless, until the WADLS can access datasets that can reliably capture nonhospitalised strokes, estimates will rely on population-based studies to provide information on stroke cases managed completely outside hospital. The assumption that the admission proportion from Perth applies to WA as a whole was evaluated by examining:
the proportion of annual registered stroke deaths that had been hospitalised with stroke in that year, and a review of acute death proportions in hospitalised cases.
Neither investigation indicated differences between different levels of remoteness. Thus, there is no quantitative evidence that admission proportions vary dramatically around WA.
Excess mortality rate over and above the total population mortality is an underestimate of the actual mortality differential between prevalent and nonprevalent cases. Duration in our analysis will therefore be marginally overestimated compared with an analysis in which true case fatality had been entered into DisMod. However, because the prevalence of stroke survivors is relatively low, the effect on the duration of using EMR is likely to be small. Our data highlight the importance of obtaining age-specific case fatality, as rates increase considerably with age, even when the population mortality risk from other causes is removed. Traditionally, EMR are calculated from longitudinal studies, where estimates are reported by age at the start of the follow-up period. Burden of disease analyses, however, require this information by age at occurrence of death. Such EMRs are not readily available in the literature and this study represents the first published estimates for stroke survivors, albeit for hospitalised stroke cases only.
A novel approach was developed to calculate DW that adjusts for prestroke disability in a population-based sample, drawing on indirect valuation methods. The main finding was that the (all-age) mean DW attributable to stroke was 0.31, 0.08 lower than weights that do not account for prestroke disability (0.39). Our DW for stroke is higher than global (1) (0.25) and the previous Australian (25) (0.17) weights, even with adjustment for prestroke disability. In general, the mean unadjusted QoL weight (1–DW = 0.61) estimated in the current study was lower than most previous estimates in the stroke literature and those used in BoD studies (4 45). Interestingly, the mean QoL weight calculated from a Melbourne population-based sample of 2-year stroke survivors (0.47) (46) was even lower than that the unadjusted weights reported here. A systematic review of QoL weights after stroke (47) suggests that higher QoL estimates are due to the exclusion of mood and pain as dimensions for consideration in valuation processes. Estimates from the current study, as well as the Melbourne study, relied on consideration of multiple dimensions impacting on health-related QoL, thus capturing a fuller spectrum of dimensions than many other studies, thereby partly explaining the lower QoL weights in these Australian studies. Differences in DW at 4-months and 12-months in the current study suggest that higher weights ought to be applied in the first year. This decision is supported by evidence about the natural history of stroke (48).
It would be preferable for future studies to utilise more current data specifically designed for valuation of DW. In the 10 years between the 1990 PCSS data collection and their application to data from 2000, peri- and poststroke care including the use of thrombolysis, statins and blood pressure control (49) has advanced substantially, so that any improvements in stroke outcomes in 2000 may not have been adequately reflected in our DW. However, the even lower QoL weights reported in the 1996–1997 NEMESIS study imply that differences in our average DW and previously reported DW are likely to be indicative of methodological, rather than outcome differences. Despite this, future studies should utilise more current disability data.
The difficulties of retrospective mapping of data to the EQ5D+ domains were compounded by the requirement for stage-dependent scores. Data on mobility, self-care and daily activities were the most reliable, being based on standardised instruments appropriate for self- and proxy reporting. Cognitive function scores were most valid for the poststroke period when they were based on the standardised MMSE. The absence of data relating to pain required literature-based assumptions. A sensitivity analysis showed that different scenarios of pain prevalence (0% and 20%) and severity yielded similar results, indicating that assumptions about pain, a symptom of relatively low prevalence in stroke, will not affect DW drastically.
Depression/anxiety scores were based on self-completed mental health screens and standardised psychiatric assessments. The coverage of the 12-month assessment (85%) was not as complete as at 4-months due to the design of the original psychiatric study. A systematic review of the frequency of depression after stroke (50) calculated a pooled estimate of 33%, with the risk of depression remaining similar at difference stages of stroke recovery. The research on anxiety is sparser, with estimates being in the region of 10% for anxiety without depression (51 52) and substantial mixed anxiety–depression. Our unadjusted prevalence of mood problems, 47% at 4-months and 38% at 12-months, is compatible with these estimates, with the reduction in prevalence over time probably reflecting the reduction in anxiety rather than depression.
It is recognised that the Global BoD framework provides the best estimates of stroke burden in relation to other diseases (53), being used by international and national agencies to quantify the impact of disease on populations and to feed into priority setting and resource allocation (54). Accurate estimates of disability burden are resource intensive, requiring multiple sources of data (55). The methodological refinements from this study have been incorporated into recent Australian BoD studies for the year 2003 (12 56 57) and will contribute to BoD studies elsewhere as the detailed data on the ‘natural history’ of stroke we have described in WA are rarely available in other locations.
Contributors
Judith Katzenellenbogen conceptualised and undertook all aspects of this research as part of postgraduate studies. Theo Vos gave considerable direction to content, methods and write-up of the paper. Stephen Begg provided expertise on existing models for estimating disability from stroke, adjusting DWs for comorbidity and mapping disability instruments to health domains. Peter Somerford provided conceptual and technical support. Craig Anderson collected the original disability data in 1989–1990 and provided stroke expertise to the DW component of the study. James Semmens and James Codde were the academic supervisors of the study and reviewed the manuscript.
Acknowledgements
This study was conducted under the auspices of the Epidemiology branch of the Western Australia Health Department. The WA Data Linkage Unit linked the hospitalisation and mortality data. De-identified data from the PCSS were extracted by staff managing the database. Jan Barendregt provided advice related to mortality inputs for DisMod II.