
Abstract
The operations management literature on mass customization mainly focuses on the questions of whether and how manufacturers can efficiently deliver customization. Researchers have analyzed the trade‐offs between customization and dimensions of operational performance such as delivery times, quality, and costs. However, we argue that providing efficient customization is not sufficient per se to assess the value of mass customization. From this perspective, this paper focuses on complementary mechanisms for creating value: the benefits perceived by individual consumers. Two global components of perceived value within the context of mass customization are identified: mass‐customized product, with three dimensions, and mass customization experience, with two dimensions. The Consumer‐Perceived Value Tool (CPVT) is proposed to empirically measure the five perceived benefits related to the mass‐customized product and to the codesign process from the consumer viewpoint. The psychometric properties of the CPVT are assessed using three samples. The implications of this approach are discussed, along with directions for further research.
1. Introduction
The concept of mass customization was first introduced by Davis (1987) and later developed by Pine (1993), who defined it as “developing, producing, marketing and delivering affordable goods and services with enough variety and customization that nearly everyone finds exactly what they want.” More recently, Salvador et al. (2009) proposed a more pragmatic view of the concept by defining mass customization as “a process for aligning an organization with its customer's needs.”
Research in operations management has mainly investigated this process from the organization's perspective, with the purpose of understanding whether and how manufacturers can deliver customization efficiently (e.g., Hedge et al. 2005, Squire et al. 2006, Yue et al. 2009). The focus of such research has been on assessing the trade‐offs between customization and cost, lead time, productivity, and quality—and identifying the best practices that can mitigate such trade‐offs. By reducing these trade‐offs, companies also decrease the sacrifices made by consumers in order to obtain a mass‐customized product, such as those related to the price premium and delivery time (Agrawal et al. 2001, Zipkin 2001).
However, we argue that providing efficient customization is not sufficient per se: the perceived benefits that consumers derive from a specific mass customization offer are a key component of its success (Broekhuizen and Alsem 2002, Franke and Piller 2003, Rungtusanatham and Salvador 2008, Squire et al. 2004). The failures of some programs can also be attributed to concentrating on production technologies while overlooking consumer value, leading to an inadequate market offering (Ahlström and Westbrook 1999). Therefore, in addition to understanding how to deliver efficient customization, manufacturers that adopt mass customization need to take into account the process whereby this strategy creates value for the consumer (Squire et al. 2006) and to measure the components of this specific value.
The objective of this article is to highlight complementary mechanisms for creating value through mass customization from the consumer viewpoint and to demonstrate the possibility of empirically measuring how these mechanisms operate in a specific field setting. We propose a market‐oriented instrument to assess mass customization programs: the Consumer‐Perceived Value Tool (CPVT). This operational tool aims to identify the sources of value of a mass customization program from the perspective of the consumer. It distinguishes among five perceived benefits provided by the mass‐customized product and the mass customization experience (codesign process). The CPVT is distinct from previous measures of consumer value in operations management. Whereas Squire et al. (2004) evaluated the importance of mass customization attributes and satisfaction, we focus on the perceived benefits of the product and the codesign process. In contrast to Tu et al.'s (2001) measure, our data are obtained directly from the consumer rather than from the opinions of manufacturing managers regarding consumer preferences.
We see two potential contributions of using the CPVT. First, it provides an additional method of determining the appropriate level and type of customization for a specific product in a specific market, which is in line with Da Silveira et al. (2001), who recommended measuring the value perceived by consumers engaged in a mass customization experience. By employing the CPVT, companies can avoid offering irrelevant features that make the product too complex. Second, the CPVT contributes to a better dialogue between operations management and marketing, which is crucial for achieving a holistic understanding of mass customization (Ahlström and Westbrook 1999, Da Silveira et al. 2001). By integrating the concept of value from the marketing literature, the proposed perspective adds to the established understanding of why certain mass customization programs are successful while others fail.
The rest of this paper is organized as follows. In section 2, we discuss how the trade‐off mitigation perspective is employed to analyze mass customization. The definition of value from the marketing literature is then discussed, together with the perceived benefits of mass customization from the perspective of the consumer. Section 3 describes the development of the CPVT, while section 4 presents its psychometric properties. In section 5, we conclude with the implications of this study and suggest directions for further research.
2. Background and Theory
2.1. Mass Customization: The Trade‐Off Mitigation Perspective
Pine (1993) described mass customization as mitigating and ideally eliminating the trade‐offs between customization and other dimensions of operational performance. Based on this approach, several authors have defined the concept as the capacity to quickly produce a relatively high volume of customized products without substantial trade‐offs, as compared with those existing in mass production (e.g., Huang et al. 2008, Liu et al. 2006, MacCarthy 2004, Squire et al. 2006, Tu et al. 2001).
The persistence of the customization–performance trade‐off has been investigated in several empirical studies. For example, MacDuffie et al. (1996) examined the impact of product variety on manufacturing performance through product quality and labor productivity. Likewise, Fisher and Ittner (1999) explored the effects of option content (mean options per car) and option variability (standard deviation in options per car) on plant performance measured in terms of labor productivity. Berry and Cooper (1999) demonstrated that increased product variety can have cost and margin implications when marketing and manufacturing strategies are misaligned. Hedge et al. (2005) identified the thresholds beyond which customization has an adverse influence on two key dimensions of quality: performance and conformance. Squire et al. (2006) examined the impact of customization on four competitive priorities: quality, cost, delivery lead times and reliability, and volume flexibility. They showed that customization can have a negative effect on manufacturing costs and delivery lead times.
This trade‐off mitigation perspective assumes that customers value high variety; therefore, it focuses on how to reduce the sacrifices that customers bear, in terms of quality conformance, price, delivery times, and delivery reliability, for obtaining a customized product. One might conclude, following this perspective, that the mass‐customized product delivers superior utilitarian value due to customization. However, it bypasses other sources of value frequently discussed in the marketing literature (Schreier 2006).
2.2. Mass Customization: The Customer‐Perceived Value Perspective
Value is one of the major concepts in marketing. How to create and deliver superior consumer value is an everyday concern of marketing managers (Woodruff 1997). Zeithaml (1988) defined global value as “the consumer's overall assessment of the utility of a product based on perceptions of what is received and what he is given.” The marketing literature distinguishes this concept from satisfaction (Bolton and Drew 1991, Woodruff 1997). Satisfaction is mainly analyzed as a trade‐off between expectations and the performance of a product.
From an operations management perspective, Tu et al. (2001) provided a measure of “value to consumer” obtained by asking managers to assess “the consumer's degree of satisfaction with the organization's products.” Despite its valuable contribution, this measure does not directly capture value from the consumers' viewpoint. Consumers' values might be better measured directly by the consumers themselves, rather than by the manufacturing managers. Squire et al. (2004) created the “responsive agility tool” to analyze value derived from several types of customization from the consumer point of view. This tool was based on two criteria: importance and satisfaction. The importance criterion indicates whether consumers' value a specification, although it does not explain why. Consequently, managerial implications can be restricted to a go/no‐go choice; there are no suggested ways of increasing the value of a particular type of customization. In addition, this measure equates the concept of value with that of satisfaction.
On the other hand, value results from a trade‐off between perceived costs and perceived benefits to the consumer. Thus, more can be done than simply reducing the costs of customization to deliver consumer value. The proposed CPVT is an operational measure designed to analyze value directly from the consumers. It focuses on the second part of the value trade‐off: all of the benefits that consumers can perceive while customizing a product. Researchers have identified two global sources of value in mass customization: the product and the mass customization experience or codesign process (Fiore et al. 2004, Franke and Piller 2004, Schreier 2006).
Before and during the process of “elicitation” (Kahn 1998) of a mass customization system, customers anticipate the value they will derive from consumption of the product. Three perceived benefits of mass‐customized products have been acknowledged: utilitarian, uniqueness, and self‐expressiveness values. Research on mass customization has largely focused on utilitarian value, which is related to the extent to which a mass‐customized product fits individual preferences (Dellaert and Stremersch 2005, Peppers and Rogers 1997, Squire et al. 2004, 2006, Von Hippel 2001). Utilitarian value integrates both aesthetic and functional fit, depending on the product category (Schreier 2006). Franke and Schreier (2008) found a positive link between this perceived benefit and the willingness to pay a premium for mass customization. However, consumer value is not delivered exclusively as a result of “product fit.” A second value component is the uniqueness value (Schreier 2006). The mass‐customized product can enable consumers to play up their individuality by exhibiting “uniqueness attributes” (Snyder 1992). Fiore et al. (2004) confirmed that the desire to obtain a unique product is one of the motivations behind participation in mass customization programs. Franke and Schreier (2008) identified a positive impact of the perceived uniqueness of a mass‐customized product on the utility consumers derive from mass customization. Self‐expressiveness value comes from self‐concept theory (Sirgy 1982) and corresponds to the benefit of owning a product that reflects one's own image, regardless of whether the consumer wants to assert his/her identity. We assume that mass customization provides an opportunity for consumers to possess products that express their personalities since they can choose from among several options. Self‐expressiveness value differs from uniqueness value along one of the axes proposed by Holbrook (1999): self‐oriented vs. other‐oriented character. The individual is not trying to display his/her difference but instead seeks to own a product that fits his/her self‐image.
To succeed in mass customization, companies have to “support customers in identifying their own solutions” (Salvador et al. 2009). One of the approaches to helping customers determine their solutions is to offer them a configuration toolkit (Franke and Piller 2004, Salvador et al. 2009). The mass customization experience value is concerned with the interaction between the individual and the product design using this specific method of preference revelation. This process has often been considered a source of additional cost associated with customization, even though Piller et al. (2004) stressed “economies of integration.” Asking the consumer to identify the features of a product that he/she wants to change could generate choice complexity (Dellaert and Stremersch 2005) and might result in “mass confusion” (Huffman and Kahn 1998). Nevertheless, marketing scholars have shown that the codesign process can have intrinsic value for the consumer (Franke and Piller 2003). Two perceived benefits of this process have been identified: hedonic value and creative achievement value. Hedonic value denotes the joy and entertainment derived from the experience. In their empirical study, Fiore et al. (2004) supported the link between wanting to have an exciting experience and the willingness to use a mass customization program. In addition, Franke and Schreier (2006b) showed that hedonic value significantly influences the willingness to pay a premium for mass customization. Creative achievement value refers to the “pride of authorship” identified by Schreier (2006). When consumers are given autonomy to personalize their products, they feel a sense of having created something, even though the codesign toolkit may have limited potential. One of the managers of Dell Computers explained that consumers' satisfaction partly stems from their perceived pride in personalizing their computers (Franke and Piller 2003).
Finally, the marketing literature suggests that mass customization may not necessarily be creating enough value for the customer, even though the trade‐off between customization and operational performance is resolved. Specific attention must be given to the perceived benefits of the mass customization offer, in addition to the utilitarian value. Five benefits have been identified. The three benefits related to the product are applicable to any mass customization strategy, whereas the benefits related to the codesign process value are appropriate only for mass customization strategies that include codesign. Table 1 provides detailed definitions of each of these five perceived benefits and their related constructs: the mass‐customized product and the codesign process. One of the contributions of this paper is to determine whether the hierarchical nature of the sources of value proposed in Table 1 is supported by our data.
For mass customization strategies that imply an elicitation process using a configuration tool.
3. Methodology
The CPVT is a scale designed to measure the value consumers derive from a given mass customization program, based on the five perceived benefits identified above.
Its construction follows the basic paradigm of Churchill (1979), as enriched by those of Anderson and Gerbing (1988) and Gerbing and Hamilton (1996). Accordingly, the development method for the CPVT includes four phases: (1) item generation, (2) face validity tests, (3) a pilot study, and (4) validation studies.
3.1. Item Generation and Face Validity Tests (Phases 1 and 2)
Items were generated based on (1) previous marketing literature on value and mass customization and (2) a qualitative study involving the Nike ID program. At the time of the study (2005), this program was one of the most advanced mass customization programs using a configuration toolkit in a Business‐to‐Consumer setting. It allows users to customize and order branded shoes, bags, watches, and other items online. Twenty subjects, differentiated in terms of age (from 14 to 31 years old) and sociodemographic characteristics took part in a preliminary mass customization experience through this program, where they were asked to personalize their preferred product. Their opinions were collected through the verbal protocol method: participants were asked to think aloud both during and after the design task (Hughes and Parkes 2003). The use of this method averts problems inherent in direct questioning (Ericsson and Simon 1993). The method's reliability and validity have been confirmed by several studies showing that verbalization does not significantly modify cognitive processes (Smagorinsky 1989). Lastly, a debriefing phase enabled respondents to elaborate on the topic of mass customization. We used a twofold procedure for analyzing the interviews. First, we conducted a thematic content analysis using Nvivo 2.0 software following the recommendations of Weber (1990) and Weitzman (2003). Theoretical coding involving two coders was used to allocate themes to separate categories that correspond to the five consumer benefits identified in the literature. Benefits that did not fall into the five categories were also categorized using open coding. The consistency of the categorization process was assessed by two coders. Second, a lexical analysis using Sphinx Lexica software allowed us to extract the significant lexicon associated with each benefit category, to integrate the consumers' most frequently used precise vocabulary in item formulation.
An initial set of 36 measurement items was generated, with approximately six items per perceived benefit. We used only positive statements, as the introduction of negatively worded items could create an artifact of response style leading to a spurious dimension (Gerbing and Anderson 1988, Marsh 1996).
The face validity test involved two steps. First, eight researchers in management science were asked to judge the items' relevance (DeVellis 2003). The names and definitions of the dimensions were submitted to each judge, who then sorted the items by dimension. Items that were categorized in the right dimension by at least 75% of the judges were kept. Second, we conducted 12 new consumer interviews based on the verbal protocol method (Fowler 1995). Participants were given a questionnaire and were asked to think aloud. They were then questioned about the clarity of the statements and about their degree of confidence in their answers. At the end of this process, 24 items were retained: 14 for mass‐customized product value and 10 for codesign process value (see Appendix A).
3.2. Data Collection for the Pilot and Validation Studies (Phases 3 and 4)
We conducted two quantitative studies on the Nike ID program, first with 231 and then 567 students. The choice of students is justified by the fact that the 19–25 age bracket falls within the target audience of the Nike ID program. Data were collected in a laboratory setting to ensure that informants truly personalized the product. As an incentive for their involvement, participants were entered in a draw to win the product they had customized.
Respondents were asked to customize their favorite pair of shoes. After the codesign phase, they filled out a questionnaire containing the CPVT scales. To control for different sources of measurement bias, we rotated the items using four versions of the questionnaire. Furthermore, we deleted respondents who gave the same ratings for all the items. At the end of this process, 228 (sample 1) and 546 (sample 2) questionnaires were usable (see Appendix B for the main characteristics of the two samples).
The scales were all in Likert seven‐point format. During the first round of data collection, we used symmetrical scales ranging from “strongly disagree” to “strongly agree.” Respondents generally agreed with the items; all the skewness coefficients were therefore negative, between −0.15 and −1.26. On average, only 15.34% of the answers were between the first (“strongly disagree”) and third (“somewhat disagree”) points on the scale. Asymmetric scales for the second round of data collection (one negative point, one neutral point, and five positive points) were used to obtain more discrimination between respondents and a distribution of answers that approached normality. This procedure was beneficial: the skewness coefficients improved for all of the items (between 0.92 and −0.32).
Finally, a measure of overall consumer value was added to test the criterion‐related validity of the CPVT. The three items follow Zeithaml's (1988) definition of global value, integrating the trade‐offs between perceived benefits of mass customization and two main perceived costs: price and time devoted to specifying product requirements (Agrawal et al. 2001, Broekhuizen and Alsem 2002, Zipkin 2001): OV1, “Finally, customizing a Nike ID pair of shoes is worth what it costs (in time and money),” OV2, “Customizing a Nike ID pair of shoes is worth the time and the money which I can devote to it,” and OV3, “Overall, I consider that personalizing a pair of shoes with the Nike ID program is worth all the energy I put into it.”
3.3. Data Analysis Method
Gerbing and Anderson (1988) argued that the scale development process should begin with an exploratory factorial analysis (EFA) on one sample, followed by a confirmatory factorial analysis (CFA) done on a second sample. Gerbing and Hamilton (1996) updated this process by recommending that another EFA be performed on the second sample before the CFA. In addition, Anderson and Gerbing (1988) suggested that the final model be cross validated using another sample. We followed these guidelines, which resulted in the following three steps. First, the EFA was executed during the first data collection (n 1=228). Then, the second database was randomly split into two subsamples (n 2=228 and n 3=318). A second EFA was run on subsample n 2, followed by a CFA. Finally, a second‐order CFA was performed on subsample n 3 to test the hierarchical structure of the CPVT scale: the product value and the codesign process value. We decided to propose a shortened version of the scale, following Stanton et al.'s (2002) suggestion of using reduced scales for measurement instruments. In addition, Bearden and Netemeyer (1999) identified four advantages to developing a reduced scale: equal weighting of the five concepts, better stability across samples, better internal consistency, and easier and faster administration, leading to less missing value and more space for other variables in the models.
4. Results
4.1. Exploratory Factorial Analyses (n 1 and n 2)
EFA with principal component extraction followed by Promax rotation was performed on the first (n 1=228) and second (n 2=228) samples, leading to five dimensions. Next, the Velicer MAP test and the scree test confirmed the five dimensions in the two samples.
Following Brown (2006), three criteria were used for item purification: (1) communalities higher than 0.5, (2) item loading >0.6 on the proper axis, and (3) item correlation below 0.3 on any other axis. For the first sample, hedonic item H6, “Customizing these shoes was like a game,” was dropped because its communality was <0.5. The 23‐item solution explains >76% of the total variance. Each dimension presents satisfactory internal consistency values (Cronbach's α between 0.85 and 0.92). For the second sample, the following three items were successively deleted because of high cross loadings: Creative Achievement items CA1, “I am very proud to have designed this pair of shoes,” CA2, “By personalizing this pair of shoes, I had the impression of creating something,” and Utilitarian value item U2, “This program enables me to have exactly the pair of shoes I want to have.” This solution explains nearly 79% of the variance. The internal consistency is satisfactory for the five dimensions (Cronbach's α between 0.80 and 0.94). Twenty items were retained at the end of the exploratory analyses.
4.2. First‐Order CFA (n 2)
CFA was then performed on n 2 to assess the reliability and validity of the full 20‐item scale. The model fit the data well based on conventional thresholds (χ 2/ df =2.1, TLI=0.947, RMSEA=0.07, CFI=0.955). Jöreskog's Rhôs were between 0.80 and 0.95, indicating good reliability for the measures of the five factors (Table 2). In addition, they presented satisfactory convergent validity: t‐values for all items are significant (p<0.001), and the constructs share at least 50% of the variance with their indicators (Fornell and Larcker 1981).
UV, utilitarian value; UnV, uniqueness value; SEV, self‐expressiveness value; HV, hedonic value; CAV, creative achievement value.
Discriminant validity was tested using two methods: (1) the Fornell and Larcker (1981) procedure, considered quite conservative by Hatcher (1994) and (2) the chi‐square difference test proposed by Bagozzi and Phillips (1982).
Discriminant validity was not fully supported using Fornell and Larcker's procedure: the squared correlation between creative achievement and hedonic value exceeded the average variance extracted (Table 2).
However, discriminant validity was supported by constraining the correlation between any two constructs to “1.0” and then performing a chi‐square difference test between the constrained and the 10 alternative unconstrained models (Bagozzi and Phillips 1982). Following Anderson and Gerbing's (1988) recommendations, the test was performed for one pair of constructs at a time. The chi‐square value for the constrained model was significantly larger than that for all of the unconstrained models, even for the model collapsing hedonic and creative achievement values (Δχ 2=65.79, p<0.001) and for the model collapsing utilitarian and self‐expressiveness value (Δχ 2=169.46, p<0.001). This provides support for discriminant validity for all five constructs.
Then, a shortened version of our scale was proposed. Following the methodology of Stanton et al. (2002), corrected item‐total correlations were used as an index of internal quality. The set of correlations with the three items composing the “overall consumer value” measurement served as indices of external quality. Finally, based on these internal and external criteria, we retained the three best items per dimension (Table 3). For the creative achievement value, we had only two items that were kept.
UV, utilitarian value; UnV, uniqueness value; SEV, self‐expressiveness value; HV, hedonic value; CAV, creative achievement value.
The validity and reliability of this shortened 14‐item scale was assessed following the same procedure as for the full scale. Detailed results of the scale's psychometric qualities are available in Tables 2 and 4. As for the 20‐item scale, discriminant validity is assessed with the chi‐square difference test for creative achievement and hedonic value (Δχ 2=57.59, p<0.001), but not with the more conservative procedure of Fornell and Larker. Finally, the results of the delta chi‐square test demonstrated that the reduced 14‐item scale is significantly better than the full 20‐item scale (Δχ 2=208.58, Δdf=93, p<0.001).
factor loadings; UV, utilitarian value; UnV, uniqueness value; SEV, self‐expressiveness value; HV, hedonic value; CAV, creative achievement value.
4.3. Second‐Order Hierarchical CFA (n 3)
We hypothesized that the perceived value of mass customization follows a hierarchical structure with two second‐order dimensions: product value and codesign process value (model M1). To establish this hypothesis, we compared model M1 with a single‐dimension hierarchical model (M2). These models are depicted in Figure 1.
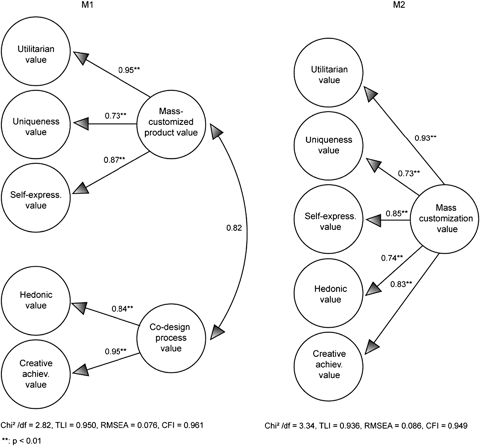
The fit of model M1 is acceptable (χ 2/df=2.82, TLI=0.950, RMSEA=0.076, CFI=0.961) and significantly better than that of model M2 (Δχ 2 M1−M2=39.91, Δdf=1, p<0.001). The two higher‐order factors account for 53–90% of the variance of the first‐order factors. The correlation between the higher‐order factors is 0.82. Table 5 presents the measurement model results for M1.
The metric for each scale was established by fixing one of the construct loadings to 1.
4.3. Criterion‐Related Validity
Criterion‐related validity examines associations between the two second‐order factors of CPVT and overall consumer value. First, the psychometric qualities of the overall consumer value scale were assessed on the second data set (AVE=0.53, Jöreskog's ρ=0.78). Detailed results regarding the validity and reliability of this scale are available from the authors. Second, we tested the relationships between mass customization experience value, product value, and overall consumer value with a structural model. The standardized regression from mass‐customized product value to overall consumer value is statistically significant (β=0.204, t=3.19, p<0.005), as is the standardized regression from codesign process value to overall consumer value (β=0.492, t=5.48, p<0.001). These two second‐order factors of CPVT are thus positively and significantly related to overall consumer value.
5. Discussion, Managerial Implications, and Future Research Directions
5.1. Discussion and Managerial Implications
The findings of the study show that (1) mass customization value from a consumer viewpoint is polymorphous, with five dimensions; (2) it follows a hierarchical structure with two higher‐order dimensions, product value, and experience value; and (3) the value derived from the experience of codesign can have a positive influence on the overall value of mass customization. We have identified five possible perceived benefits, three of which are related to product value—utilitarian value, uniqueness, and self‐expressiveness—and two of which are related to a specific way of revealing consumer preferences (the codesign process)—hedonic and creative achievement. Second‐order confirmatory analyses supported this hierarchical structure. The CPVT offers a flexible way to measure these benefits either in the long or short version. This instrument aims at measuring value directly from the consumer, whereas Tu et al. (2001) measured it through the manufacturers' evaluation of customer perceptions. Finally, in testing the criterion validity of this scale, we show that for the particular product category we studied, the codesign process has a stronger influence on global value than the product itself does. This result reinforces the hypothesis of several authors who argue that the codesign process is not just a cost for the consumer. In addition, the emphasis on hedonic and creative value is consistent with Pine and Gilmore's (1998) conception of “experiential economy” and with the search for more hedonic and creative experience in the everyday life of the contemporary consumer. We could raise further questions concerning the process value derived from other methods that reveal consumer preferences. It may well be that the value perceived by the customer is increased by not offering codesign, for instance when the codesign value is offset by choice complexity or when consumers do not have much time to devote to the process. It could be worthwhile to divide consumers according to their preferred methods for determining their own solutions and to target specific methods toward different consumers based on these preferences.
We foresee several applications of the CPVT for analyzing the perceived value of a specific mass customization program and for comparing different configuration scenarios, as well as the level of customization and type of customization in terms of perceived value. In all cases, the CPVT can ultimately be merged with current operation management tools focusing on manufacturing trade‐offs. The outcome will be a measure of perceived benefits as seen by the consumer that can be weighed against the overall company trade‐offs. Companies can thus decide whether to offer a mass customization program and choose the appropriate settings (e.g., degree of customization, type of customization, and price) of the selected program. The proposed tool also has the potential to measure the value of a configuration toolkit. A configuration tool should maximize consumer hedonic value and creative achievement value.
To apply the CPVT, users must first survey a representative sample from the targeted consumer group. Then, to ensure a reliable measure of consumer value, companies should integrate consumers into the customization process before they fill out the CPVT questionnaire. This is an important point because of the strong relationship between mass‐customized product value and the elicitation process. Concerning toolkits, the value that consumers derive from the codesign process could influence the value they obtain from the product—this “do‐it‐yourself” effect has been partly depicted by Franke and Schreier (2006a). In addition, we can also posit that the value that consumers derive from the codesign process will not last as long as the value conferred by the product itself.
5.2. Limitations and Future Research Directions
The limitations of this study concern the specific mass customization offer that we studied, as well as several methodological points.
The proposed conceptualization of mass customization value has two components: mass‐customized product value, which is common to all of the mass customization approaches, and value gained from the experience of customization, which is specific to strategies that include codesign. In addition, we worked on the Nike ID program, which is an example of “partial customization” (Duray et al. 2000) with a specific method to reveal customer preferences. It would be worth testing the proposed model on other types of customization programs. Then, the CPVT tool could be adapted first by using only one or both of the two components and second by marginally modifying the items according to the program. The tool is easily adaptable for different customization contexts. For example, item Un4, “With this program, I could design (name of the product) that others will not have,” could be rewritten for other preference elicitation methods as follows: “With this program, I could have (name of the product) that others will not have.” Furthermore, the products considered in our study are sold in a Business‐to‐Consumer setting. We assume that the specific value assigned to the codesign process would be lower for an industrial customer, since the product is not bought for the customer. Then, it seems, the proposed conceptualization of mass customization value would be more relevant in a Business‐to‐Consumer context. Finally, the products considered here are publicly consumed products, i.e., products that can be seen by others (Bearden and Etzel 1982). In this case, the influence of uniqueness value on overall value is probably higher than for private consumer goods. A study focusing on private consumer products and/or more utilitarian goods, such as computers, could be relevant.
From a methodological point of view, discriminant validity between hedonic value and creative achievement value is supported with the chi‐square difference test but not by Fornell and Larcker's (1981) procedure. Further research should be conducted with this possible threat to discriminant validity in mind. In addition, we retained only two items for creative achievement value.
Lastly, the CPVT is only a first step toward a more global measurement instrument that can help companies optimally select and adapt customization programs to consumers' needs. Mass customization characteristics, such as cost effectiveness and fast responses, are not integrated into our conceptualization and measurement tool. The CPVT focuses on consumer‐perceived benefits of mass customization, whereas cost effectiveness and fast responses have to do with the second component of the perceived overall value trade‐off: costs for the consumer, notably price, and delivery times. Thus, manufacturers must configure their resources simultaneously to increase the perceived benefits—the CPVT is a step in this direction—and to reduce consumer‐perceived costs, as Squire et al. (2004) have suggested. Further research should therefore examine these perceived costs in depth and propose a measurement tool to assess them directly based on the consumer to better understand this trade‐off in mass customization from a consumer viewpoint.
Footnotes
Appendices
Acknowledgments
We are very grateful to the guest editors for their extremely relevant comments, which led to significant improvements in the structure and content of this paper. In addition, we would also like to thank the associate editor and four referees for their very helpful suggestions.