
Abstract
We study two prevailing types of take‐back schemes for electrical and electronic equipment waste recycling: monopolistic and competitive. We address key market and operating factors that make one scheme preferable to the other from the viewpoints of recyclers, manufacturers, and consumers. To this end, we model competitive decision making in both take‐back schemes as two‐stage sequential games between competing manufacturers and recyclers. Deriving and computing equilibria, we find that the competitive take‐back scheme often accomplishes a win–win situation, that is, lower product prices, and higher recycler and manufacturer profits. Exceptionally, recyclers prefer the monopolistic scheme when the substitutability level between the manufacturers' original products is high or economies of scale in recycling are very strong. We show that consolidation of the recycling industry could benefit all stakeholders when the economies of scale in recycling are strong, provided that manufacturer's products are not highly substitutable. Higher collection rates also render recycler consolidation desirable for all stakeholders. We also identify a potential free rider problem in the monopolistic scheme when recyclers differ in operational efficiency, and propose mechanisms to eliminate the discrepancy. We show that our results and insights are robust to the degree of competition within the recycling industry.
1. Introduction
The establishment of efficient and effective take‐back schemes is critical for increasing the recovery, reuse and recycling of end‐of‐life products, and reducing landfill. This is particularly important for electrical and electronic equipment waste (WEEE), which is the fastest growing waste stream. The main WEEE categories are large household appliances (e.g., washing machines and driers), cooling and freezing appliances, small household appliances (e.g., vacuum cleaners and telephones), CRT devices (e.g., TV sets and monitors), and lighting equipment. In the EU alone, WEEE grows at a rate of 3–5% per year, about three times faster than average waste. Furthermore, the fact that 90% of this waste is still landfilled or incinerated poses a health risk to society and environmental damage (Savage 2006). In response, the EU enacted Directive 2002/96/EC on WEEE, together with Directive 2002/95/EC, to restrict the use of certain hazardous substances in electrical and electronic equipment (RoHS) in order to reduce WEEE and the detrimental environmental effects of such products throughout their life cycles. Similar legislation or regulations are being implemented or planned in other countries including Japan, Canada, and the United States. In the United States, 24 states had passed statewide legislation on e‐waste recycling as of 2010 (Electronic TakeBack Coalition 2010). According to Electronics Product Stewardship Canada, currently six provinces have legislation mandating WEEE recycling (
The WEEE Directive in the EU holds producers/importers responsible for taking back and recycling end‐of‐life products, and sets mandatory target rates for the recycling and recovery of WEEE. However, the decisions regarding the organization and logistics of the take‐back schemes are left to Member States. Two distinct types of nationwide take‐back schemes are observed in the EU (and other countries in the world): monopolistic and competitive. Under the monopolistic scheme, a single nonprofit organization monitors and allocates the collected WEEE to recyclers, and calculates and charges the treatment and transportation costs that each member manufacturer/importer has to bear. This system is used in countries including Belgium, the Netherlands, and Sweden. On the other hand, countries including Germany and Austria have opted for the competitive scheme. Under the competitive scheme, manufacturers/importers are free to establish their own partnerships with the recyclers. For example, in Germany, this is permitted insofar as the market share of manufacturers/importers included in the scheme does not exceed 33% (Perchards 2005). However, in the United States and Canada, there is no national legislation and the decision to implement monopolistic or competitive take‐back schemes is left to the discretion of individual states or provinces. For example, in the state of Washington, a competitive scheme is being used (Woellert 2006), whereas in Ontario, Canada, a monopolistic scheme was established in September 2007 (Ontario Electronic Stewardship 2009). Japanese legislation, on the other hand, tends to follow the EU directive, and has organized a nationwide take‐back system consisting of two competing schemes (INFORM 2003).
As the preceding discussion highlights, there are different views regarding the preferred system. Those who support the monopolistic system argue that, under a single nationwide scheme, economies of scale can be exploited fully, which is particularly important for small countries (e.g., the Netherlands) where volumes are not sufficient to create a viable market for multiple competitive systems (Savage 2006). Proponents of the competitive scheme, on the other hand, believe in the laws of competition in order to reduce costs. According to European Recycling Platform, Austria, with a population about half of the Netherlands, has succeeded in reducing treatment/logistics costs for WEEE to the scale of 1/6 by moving away from a monopolistic to a competitive scheme (
In this paper, we recognize the presence of multiple stakeholders in WEEE recycling, i.e., consumers, manufacturers, recyclers, as well as regulators. Our primary objective is to analyze and compare the two prevailing types of take‐back systems from their different viewpoints, and to identify the key factors that determine a desirable take‐back scheme for each stakeholder. Synthesizing these, we hope to identify win–win conditions for each take‐back scheme, which can serve as the basis for legislators/regulators in determining which type of scheme to adopt. The basic industrial setting we analyze consists of two competing (groups of) recyclers, and two (groups of) manufacturers who compete in the original product market. Note that we use the term manufacturer generically to refer to the original manufacturer or importer. We assume that WEEE recycling costs display economies of scale. We model monopolistic and competitive schemes as two‐stage, noncooperative games and derive the equilibrium recycling fees, product prices, and recycler and manufacturer profits for each scenario. Analyzing and comparing the equilibria, we seek answers to the following main research questions: How do key market and operating factors influence the equilibrium prices and profits under each take‐back scheme? When is one take‐back scheme preferable to the other for each of the stakeholders? Are there conditions under which a win–win can be accomplished for all of the stakeholders?
The primary focus of this paper is on the alternative WEEE take‐back schemes. We observe that the desirable take‐back scheme is dependent on the structural characteristics of the downstream recycling industry. Hence, we extend our basic model to also address the issues below:
What is the impact of consolidation/monopolization of the recycling industry? Is it preferable for all stakeholders? What type of scheme is more desirable in this setting? How does a discrepancy in the recyclers' operational efficiency (i.e., their ability to exploit economies of scale) influence equilibrium outcomes and preferences for each scheme? How does the intensity of competition in the recycling market influence equilibrium outcomes and preferences for each scheme?
The remainder of the paper is organized as follows: The most relevant academic literature is reviewed in section 2, and the basic analytical framework used for addressing our research questions is developed in section 3. We present the equilibrium analysis and a comparison of monopolistic and competitive take‐back schemes in section 4. Then, we turn our attention to the impact of the recycling industry on the take‐back schemes. Each of the subsequent three sections tackles one of the secondary research questions listed above. In section 5, we investigate the impact of recycling consolidation, while section 6 focuses on the case where operational efficiency of recyclers differs. In section 7, we extend our basic framework and examine the effects of the intensity of competition within the recycling industry. In closing the paper, section 8 summarizes our results and highlights policy implications. For expositional clarity, all technical details and detailed proofs of the propositions are collected in supplemental appendices.
2. Literature Overview
A variety of closed‐loop supply chain structures are observed in practice. An earlier classification is found in Thierry et al. (1995), which classifies closed‐loop supply chains based on the form of product recovery, namely, repair, refurbishing, remanufacturing, cannibalization, and recycling. Fleischmann (2003) extends the classification by introducing two variables: the driver for product recovery (economic vs. legislation), and the owner of the recovery process (manufacturer vs. third party). Based on Fleischmann's (2003) definition, our study focuses on WEEE recycling that is outsourced to recycling companies (third party), driven by the WEEE Directive (legislation driven), while manufacturers are legally and financially responsible for the recovery process.
Recently, the competition and coordination related issues in closed‐loop supply chains have attracted some attention (see Debo et al. 2005 for an early review). The most relevant stream comprises the two papers that deal with strategic collection issues and (reverse) supply chain structures. Savaskan et al. (2004) study a monopolist manufacturer's choice between alternative collection channel structures: (i) direct from product holders, (ii) via an existing retailer, and (iii) subcontracting to a third party. Savaskan and Van Wassenhove (2006) present an extension to the case of competing retailers. Both papers deal with the collection of products from end users for the purpose of remanufacturing, which results in cost savings for the manufacturer. In contrast, we focus on the recycling of collected end‐of‐life products, which brings in different stakeholders and dynamics. Recyclers enter as major players, and collected items represent additional costs to the manufacturer. There are other salient characteristics of this environment that set it apart from these papers (e.g., economies of scale in recycling costs, and the existence of a nonprofit organization allocating WEEE). Owing to these characteristics of WEEE recycling, our research focuses on quantity of returned products that recyclers receive rather than quality of those as being observed in the remanufacturing industry (Ferguson et al. 2009, Galbreth and Blackburn 2010).
Some recent articles examine decentralized WEEE management and recycling systems. Sodhi and Reimer (2001) formulate optimization models for each member of an electronics recycling network and calculate the model using data from the US recycling industry. The authors focus on formulating the relationship between different members of the e‐cycling network. In their models, prices and transportation costs are exogenously defined, and competition between members is ignored. Nagurney and Toyasaki (2005) formulate a multitiered e‐cycling network model with a variational inequality formulation in a Cournot oligopsony game. The formulation provides the endogenous equilibrium prices and material flows between tiers. Hammond and Beullens (2007) extend the work of Nagurney and Toyasaki (2005) and develop a closed‐loop supply chain model for WEEE in a Cournot pricing game with perfect information. They numerically find that minimum recovery targets stimulate manufacturers' reverse chain activities. Nagurney and Toyasaki (2005) and Hammond and Beullens (2007) assume that competition occurs only along tiers, but not between tiers. Our models explicitly consider competition between tiers as well as within a tier. Most recently, Walther et al. (2008) develop a decentralized coordination mechanism for allocation of WEEE and choice of disassembly levels to independent WEEE recycling companies.
A fast‐growing stream of works investigates the effects of take‐back legislation, in particular in the context of WEEE. Atasu et al. (2009) develop a stylized economic model that includes consumers, producers, and governments (social planner) as decision makers, emphasizing social total welfare implications. They examine recovery targets and conclude that these targets should take into account both recovery economics and environmental impact. They also show that intense competition leads to higher targets. Jacobs and Subramanian (2009) incorporate the possibility of sharing the take‐back related costs between the producers and suppliers, and discuss the ensuing profit and social welfare effects. On a different front, Plambeck and Taylor (2007) study auditing (product testing) for RoHS compliance in a competitive setting. Also, a line of recent papers explores the new product design and introduction implications of take‐back legislation (e.g., Atasu and Subramanian 2010, Plambeck and Wang 2009, Subramanian et al. 2009, Zuidwijk and Krikke 2008). These studies do not specifically model the differences between monopolistic and competitive schemes as well as the function of the nonprofit organizations. Additionally, important industry characteristics such as economies of scale in recycling activities, the possibility of recycler consolidation, as well as discrepancy of operational efficiency among recyclers are not considered.
Our paper represents a formal game‐theoretic approach to the analysis of alternative industry take‐back structures for WEEE recycling, including both forward and reverse flow of goods and multiple decision makers. The next section provides a detailed discussion on our modeling framework.
3. Modeling Framework
In this section, we describe the industry structure utilized in our basic analytical framework, present the main modeling assumptions, and derive the profit functions of the manufacturers and the retailers. We revisit some of our key assumptions and discuss possible extensions in our concluding remarks.
We assume that there are two recyclers (recycler i, i=A, B) and two manufacturers (manufacturer j, j=1, 2) in the market. Each recycler and manufacturer can be viewed as a single firm or a consortium of firms. In the latter case, representing the consortium as a single decision maker is clearly a simplification. Nevertheless, this industry structure allows us to model the competition among manufacturers and recyclers in a stylized manner. We note that the two‐manufacturer assumption is reasonable for countries where there are only a few consortia of manufacturers (e.g., Japan), whereas the two‐recycler assumption is realistic for countries where the infrastructure for WEEE recycling has been built relatively recently (e.g., Ireland, Portugal, Poland). The products are collected from the market at the end of their useful lifetime. As in most real‐life cases, we assume that the local authorities are responsible for picking up and/or setting up designated drop‐off locations for WEEE. The products collected at the drop‐off centers are then sent to the recyclers.
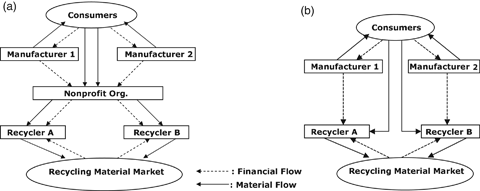
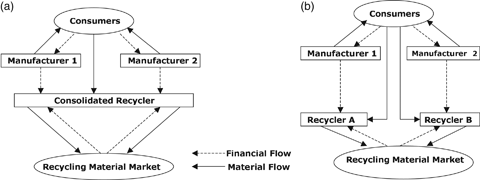
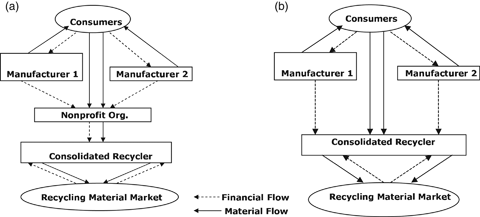
A schematic representation is provided in Figure 1 for both monopolistic and competitive take‐back systems. In both cases, the manufacturers compete in the consumer market in terms of original product prices. The recyclers, on the other hand, receive the collected end‐of‐life returns (i.e., WEEE) and set competitive recycling/treatment fees that take into account the impact on manufacturers' product prices, demands, and the amount of WEEE. In the case of the monopolistic take‐back scheme, the nonprofit organization is responsible for contracting with the recyclers and allocating WEEE, and charges the resulting cost to each manufacturer according to market shares (e.g., NVMP in the Netherlands). In the case of the competitive take‐back scheme, the recyclers and manufacturers still have to register with a regulatory (nonprofit) organization that monitors recycling activities (e.g., WEEE‐System in Denmark and the Clearing House in Germany). These organizations track the amount of WEEE collected at municipal drop‐off points and/or consolidation sites, and ensure that each take‐back scheme takes responsibility for recycling the collected WEEE in proportion to its market share (Grunow and Gobbi 2009). As these organizations are not involved with the allocation and financing of WEEE to the recyclers, we omit them from our framework. In the competitive scheme, each manufacturer makes an exclusive contract with a single recycler. Exclusive contracting is in line with the general view that it is cheaper to contract with a single recycler on a large WEEE amount than to contract with many recyclers on smaller transaction amounts because of economies of scale (Savage 2006). The resulting industry structure is a duopoly of competing take‐back schemes (e.g., as observed in Japan, Charter 2005).
The industry structure discussed above enables us to capture the essential nature of competition among manufacturers and recyclers, and the cardinal characteristics of both take‐back systems in a tractable manner. We remark that the exclusive contracting assumption in the competitive scheme implies that the recyclers do not directly compete for WEEE in the recycling market (they compete indirectly, through their contracted manufacturers, as shall be seen later). A related consideration for the monopolistic take‐back schemes is how the nonprofit organization decides to allocate WEEE to recyclers and how it sets the recycling fees to be charged to the manufacturers. We assume that the nonprofit organization passes on fair recycling/treatment costs to the manufacturers; i.e., it sets membership fees at a level sufficient to cover these costs and does not attempt to make profits. Article 81 of the EC Treaty stipulates that the nonprofit organization may not utilize an allocation rule that distorts competition between recyclers without justification (see
We model competitive decision making in both take‐back schemes as a two‐stage sequential decision game, where the recyclers act as the Stackelberg leaders. We make this modeling choice mainly for tractability. It also conforms with the fact that in WEEE recycling, manufacturers are typically price takers. This is because they have an obligation to recycle end‐of‐life products, and they have to use the services rendered by the recyclers.
Each recycler determines the level of recycling fee that she charges per unit of WEEE collected. Recyclers compete noncooperatively, while taking into account manufacturers' reactions to recycling fees. Each manufacturer sets the sales price for his product. Manufacturers compete noncooperatively, while taking into account the recycling fee set by the nonprofit organization (monopolistic take‐back scheme) or by their contracted recycler (competitive take‐back scheme).
We use the backward induction method to calculate the equilibrium solutions for both take‐back schemes. We now provide a description of the demand model, and derive the recycler and manufacturer profits.
Let us introduce the k to specify the type of the take‐back scheme, k=m (monopolistic take‐back scheme) and k=c (competitive take‐back scheme). We denote the price of manufacturer j, j=1, 2 in scheme k as  . The consumer demand model we use is a linear model with substitution effects. Specifically, given the prices, the demand of manufacturer j is given as
 be the total amount of product demanded in take‐back scheme k.
We do not address collection decisions in this paper. Accordingly, the fixed and variable (i.e., logistics) costs associated with setting up facilities for collection and transporting WEEE from end‐users to drop‐off/consolidation sites are not included in our framework. We assume that both take‐back schemes achieve a given target collection rate τ (0≤τ≤1). In the monopolistic take‐back scheme, the nonprofit organization uses a fixed allocation rule for collected products, where recycler A receives a fraction λ (0≤λ≤1) and recycler B receives the remainder 1−λ fraction. Let  denote the recycling fee (per unit WEEE) charged by recycler i in scheme k The nonprofit organization charges the average recycling fee
 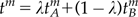 per unit of collected WEEE to each manufacturer. Note that it does not matter whether the manufacturers are charged for each collected WEEE or for each new product put on the market. In the latter case, one would redefine the t
m
as t
m
τ. Accordingly, the total cost of recycling/treatment of WEEE is shared by each manufacturer according to market share, and the nonprofit organization makes no profit. Similarly, in the competitive scheme, manufacturer 1 bears the unit fee
per unit of collected WEEE to each manufacturer. Note that it does not matter whether the manufacturers are charged for each collected WEEE or for each new product put on the market. In the latter case, one would redefine the t
m
as t
m
τ. Accordingly, the total cost of recycling/treatment of WEEE is shared by each manufacturer according to market share, and the nonprofit organization makes no profit. Similarly, in the competitive scheme, manufacturer 1 bears the unit fee  set by recycler A, and manufacturer 2 bears the unit fee
  set by recycler B.
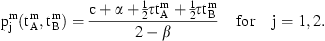
At the second stage, each manufacturer seeks to maximize his profit, which consists of the net sales revenue minus the WEEE treatment cost. Let c denote the unit cost of production, which we assume to be the same for both manufacturers. Manufacturer j's optimization problem for the monopolistic scheme can then be stated as 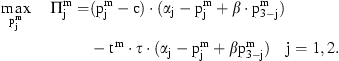
 and optimization problem is analogous to (1), except that the recycling fee t
m
is replaced with
and optimization problem is analogous to (1), except that the recycling fee t
m
is replaced with  for j=1 and
  for j=2. For both take‐back schemes, it is easy to verify that
  is concave in
  , resulting in unique equilibrium manufacturer prices
  for a given pair of recycling fees
  .
.
Let  be the amount of WEEE received by recycler i in scheme k. Clearly, in the monopolistic scheme, recycler
  amount of WEEE, which is the allocation ratio λ times the total WEEE collected
  . Recycler B receives the remainder of the WEEE, i.e.,
  . In the competitive scheme, each recycler receives the WEEE of her contracted manufacturer; i.e.,
  and
and  .
.
In the first stage of the game, recyclers competitively set unit WEEE recycling fees that influence the equilibrium manufacturer product prices and the resulting WEEE amounts  . Let r denote the revenue each recycler earns from a unit of recycled WEEE. The recyclers incur logistics costs for transporting WEEE from designated drop‐off/consolidation points and treatment costs for recycling each WEEE unit. We assume a functional form for the total of these costs (henceforth referred to as recycling cost) that displays economies of scale. The recent work of Bohr (2007) on the economics of electronics recycling shows that this is the case in most practical situations. Given the WEEE amount
  the recycling cost is modeled as
 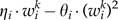 for i=A, B and k=m, c. Here, η
i
is the unit recycling cost in the absence of scale economies, and θ
i
is the economies of scale factor. It is plausible that despite economies of scale, the marginal recycling cost is always positive; i.e.,
for i=A, B and k=m, c. Here, η
i
is the unit recycling cost in the absence of scale economies, and θ
i
is the economies of scale factor. It is plausible that despite economies of scale, the marginal recycling cost is always positive; i.e., 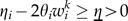 . Hence, the recycling cost is increasing and concave in
  . Notice that the average recycling cost
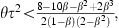
  is also positive. In addition, we make parametric assumptions to guarantee the concavity of recycler's objective function under each scheme, which also ensure nonnegative equilibrium market demand. The detailed derivations of these parametric conditions are presented in supporting information Appendix S1. Effectively, these assumptions state that the economies of scale factor cannot be too large. The central requirement here is
  for i=A, B where
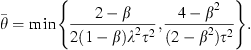
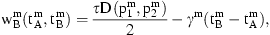
On the basis of the above, the recycler i's profit function  and optimization problem can be stated as
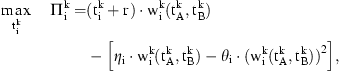
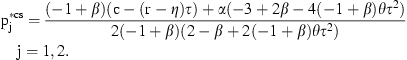
 . The resulting unique equilibrium manufacturer prices are
  and
and  . In the following section, we derive the exact expressions for the equilibrium fees and prices.
4. Equilibrium Analysis and Comparisons
In this section, we derive the equilibrium recycling fees and product prices under monopolistic and competitive take‐back schemes, and present a sensitivity analysis of the equilibria. We then proceed with a comparison of the equilibria. Our primary objective is to develop a general understanding of the desirability of each take‐back scheme. For this reason, we focus on a symmetric scenario, which enables us to compare the two schemes on an equal footing and simplifies exposition. In the symmetric case, the manufacturers have equal market sizes  , and recyclers have identical cost structures
  .
.
4.1. Monopolistic Take‐Back Scheme
We analyze the sequential game using backward induction. At each stage, we first derive the reaction functions of the players and then solve for the Nash equilibrium. Because the recyclers are identical, we assume that the nonprofit organization allocates WEEE equally (i.e, λ=1/2), and thereby avoids unjustified discrimination of the recyclers.
Consider the second‐stage game and a given pair of recycling fees  and
and  . For any price
  of manufacturer 2, manufacturer 1 determines his best response
  ) from (1), which results in the reaction function
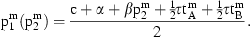
In the first stage, recyclers set their fees based on the WEEE they receive, 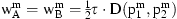 . In particular, given recycler B's fee
  , recycler A determines her best response
  from (3), which results in the reaction function
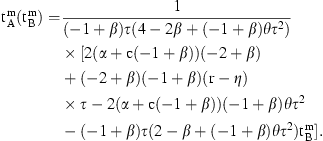

 and
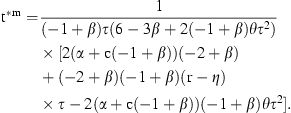
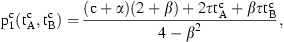
and  into (5), we obtain the equilibrium manufacturer prices
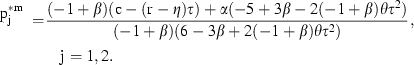
4.2. Competitive Take‐Back Scheme
We obtain the equilibrium solution of the competitive scheme in a similar fashion. In the interest of space, we do not repeat the detailed derivation, and present only the key expressions. As before, we first derive the manufacturers' reaction functions 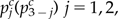
 and derive Nash equilibrium recycling fees
  and
and 

 and
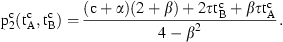
and  into (10) and (11), we obtain the equilibrium manufacturer prices
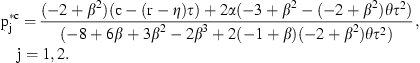
4.3. Sensitivity Analysis
Before undertaking a detailed comparison, we first investigate how key operating and marketing characteristics shape equilibrium fees, product prices, as well as manufacturer and recycler profits under the two take‐back schemes. The impact of parameters that can be ascertained analytically are presented in Proposition 1. Here, the signs + and − represent an increase and decrease in equilibrium, in response to a marginal increase of the corresponding parameter, respectively. The sign ± indicates that the equilibrium can increase or decrease depending on the values of other parameters. The precise conditions are specified at the bottom of the table in Proposition 1. Note that the proofs of our propositions are provided in supporting information Appendix S4.


 +if
+if
 –otherwise.
  +if
+if
 −otherwise.
  +if
+if
 –otherwise.
The effects of parameters are quite intuitive. When the economies of scale factor is not extremely strong, the directional changes are the same for monopolistic and the competitive take‐back schemes. Specifically, an increase in the market size α shifts demand upwards, which enables the recyclers and manufacturers to increase prices and improve profits. Increasing the profitability of recyclers (i.e., higher economies of scale factor θ or lower fixed marginal cost η or higher revenue r) enables recyclers to reduce fees while improving profits. Consequently, the manufacturer also reduces prices and garners higher profits. When the economies of scale are very strong, however, some effects are reversed for the competitive scheme. This is because the impact of recycler decisions is more strongly coupled with that of manufacturer decisions in the competitive scheme. In particular, when recyclers enjoy very strong economies of scale (high θ), the enhanced competition leads to significantly reduced recycling fees and margins, which also reduce recycler profits. A larger market size α increases the amount of WEEE, which amplifies the economies of scale impact, and gives the same effect.
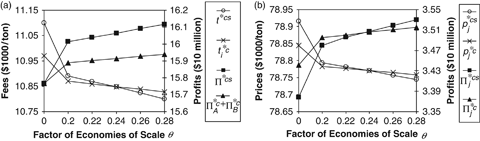
The effects of other parameters, demand substitution factor β, and collection rate τ, cannot be ascertained analytically, but have to be verified numerically. The results we have obtained from all numerical runs are consistent. We note that the data used in numerical tests and illustrations throughout the paper are grounded in real‐life industrial information reported in different case studies. See supporting information Appendix S2 for details. Figure 2 depicts the impact of the substitution factor β and collection rate τ on the recycling fees and product prices for both schemes. In each case, we vary the parameter in question in its respective range, while keeping all other parameters constant at their base levels shown in supporting information Appendix S2 (i.e., α=65,000, β=0.25, c=62,000, r=9,200, τ=0.3, η=1,000,
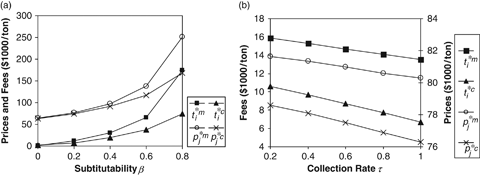
Our numerical analysis also reveals a healthy profit stream for the recycling industry. These results are in accordance with the recent developments in Europe where the WEEE recycling industry is expanding and some of the major players in the manufacturing industry, including IBM and Panasonic, are exploring the possibility of building their own recycling plants (JETRO 2006).
4.4. Comparison of Monopolistic and Competitive Take‐back Schemes
We start by comparing the recycling fees and recyclers'profits under the two schemes.
P for i=A, B. Furthermore, if
 and
and  , recyclers attain higher profits under the competitive scheme, otherwise they prefer the monopolistic scheme. Here,
 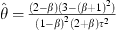 .
.
Proposition 2 shows that the recyclers in the monopolistic scheme have less incentive to set lower fees than recyclers operating under the competitive scheme. This is because the impact of a recycler's fee on the manufacturer prices is stronger under the competitive system. This can be easily seen from the reaction functions (4) and (9). Indeed, in the monopolistic scheme, the reaction function (4) of each manufacturer depends on the average fee, whereas in the competitive scheme, it depends directly on the fee charged by his contracted recycler. Consequently, the nonprofit organization, by charging the average recycling fee to the manufacturers, reduces the price effects of each recycler's fee, which induces recyclers to increase fees.
Proposition 2 also highlights that both the product substitution factor β and the recycling economies of scale factor θ are important determinants of the recyclers' profits and hence their preferred take‐back scheme. Note also that the threshold economies of scale factor  increases as β decreases from its threshold
  . That is, the recyclers would prefer the competitive scheme for higher values of θ as the product substitutability decreases. On the other hand, when product substitutability is high (i.e.,
  ), the monopolistic scheme is preferred by the recyclers regardless of the degree of scale economies in recycling. In a similar vein, when economies of scale in recycling are sufficiently strong (i.e.,
  ), recyclers prefer the monopolistic scheme regardless of the degree of product substitutability.
We now turn our attention to the product prices and manufacturers' profits under the two schemes.
P for j=1, 2. Manufacturers always prefer the competitive system to the monopolistic system, i.e.,
  for j=1, 2.
The order of product prices in Proposition 3 follow a double‐marginalization argument; i.e., higher recycling fees in the monopolistic scheme result in higher product prices. However, unlike the recyclers, the manufacturers preference for the type of take‐back scheme is unconditional. Despite higher product prices, the manufacturers' profit margins are lower under the monopolistic scheme. Higher product prices also yield lower demand, and therefore the manufacturers always prefer the competitive take‐back scheme.
In summary, our analysis identifies the competitive scheme as the generally more favorable take‐back scheme. Specifically, the consumers (who face lower product prices) and manufacturers (who earn higher profits) are always better off under the competitive scheme. A win–win outcome for all stakeholders, however, is possible only when the degree of substitutability of the products is relatively low and scale economies in recycling are not very strong. Otherwise, recyclers would prefer to operate through a nonprofit organization in the monopolistic scheme.
5. Recycler Consolidation
As the amount of generated WEEE increases and with new and more strict legislation enforcing mandatory collection and recovery, the WEEE recycling industry has been experiencing considerable growth. For instance, the number of WEEE recyclers in the United States (500 recyclers and 19,000 employees in 2005) grew about 10% since 2003 (International Association of Electronics Recycling 2006). In this environment, some level of consolidation is almost inevitable, creating a few large firms offering national WEEE recycling services. This also increases the potential for exploiting economies of scale in recycling activities. For example, in the United Kingdom, there has been considerable consolidation among major recycling companies. Many of the 21 recycling companies have merged over the last decade, resulting in 13 major recycling companies, and further consolidation is anticipated over the next few years. (AMA Research 2006). Indeed, there are concerns that the small number of recyclers will increase the risk of consolidation and monopolization of the recycling industry and will drive costs up (de Koster et al. 2005).
In this section, we provide an economic analysis of consolidation (i.e., monopolized recycling industry), and identify conditions under which this is beneficial to each stakeholder. We introduce the k=cs to differentiate the decisions and profits under consolidation. As a competitive scheme is generally the more favorable scheme, we take it as the basis of the comparative analysis in section 5.1. Note that when the consolidated recycler charges the same fee to each manufacturer, there is no difference between competitive and monopolistic take‐back schemes. In section 5.1, we show that this is indeed optimal when the manufacturers have identical market shares. When the manufacturers differ in size, however, a window of opportunity opens in the competitive scheme for the consolidated recycler to charge different fees to manufacturers and seek discrimination. In section 5.2, we present a comparison of the monopolistic and competitive schemes under recycler consolidation with asymmetric manufacturers.
5.1. Recycler Consolidation under Competitive Take‐Back Scheme
We build our analysis on the symmetric framework studied in the previous section. Figure 3 depicts the consolidated recycler scenario as well as the competitive take‐back scheme with competing recyclers (also depicted in Figure 1(b)).
When the recycling industry is consolidated, the recycler receives the total WEEE in the market, i.e., 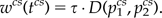 The consolidated recycler's profit function Π
cs
and optimization problem becomes
The consolidated recycler's profit function Π
cs
and optimization problem becomes 
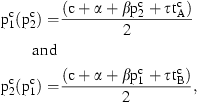
 to both manufacturers

Based on the comparison of equilibrium prices and profits, the following proposition focuses on the recycling market.
P . Furthermore, if β<0.85 and
  , then the consolidated recycler charges a lower fee, i.e.,
  , i=A, B. Otherwise,
  , i=A, B. Here,
 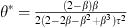 .
.
The consolidated recycler receives the WEEE generated in the entire market, which translates into lower recycling costs due to economies of scale. Consequently, the consolidated recycler makes more profit. On the other hand, lack of competition in the recycling industry provides less incentive for the consolidated recycler to reduce fees. Therefore, despite incurring lower unit costs, the consolidated recycler charges lower fees only when the economies of scale factor is sufficiently high and product substitutability is low. We present the immediate implications on product prices and manufacturer profits in the next proposition.
P , the manufacturers charge lower prices and earn larger profits under consolidation, i.e.,
  and
and  , j=1, 2. Otherwise,
  and
and
 , j=1, 2.
Manufacturer profitability depends on the cost of WEEE treatment, as charged by the recyclers. Proposition 5 establishes that lower fees under consolidation translate into lower product prices and higher manufacturer profits, and vice versa.
Similar to the symmetric recyclers case in section 4.4, Propositions 4 and 5 highlight that both β and θ are important determinants of the desirability of consolidation. Specifically, consolidation of the recycling industry leads to win–win outcomes for consumers, manufacturers, and recyclers when the manufacturers' products are not highly substitutable and the economies of scale in recycling operations are sufficiently strong. Otherwise, only recyclers benefit from the reduced costs under consolidation. Observe that the threshold economies of scale factor  decreases as β decreases from its threshold 0.85. That is, consolidation in the recycling industry would become preferable to the consumers and manufacturers at lower values of θ as the product substitutability decreases. This implies that when the degree of substitution between the products is low, but a similar technology can be used for recycling (such as TVs and computer monitors, refrigerators, and freezers), consolidation is desirable for all stakeholders. As a matter of fact, Belgium has already used a single recycling firm for each of the four WEEE categories (Future Energy Solutions 2003). Note also that
  is decreasing in τ. That is, as the collection rate τ increases, consolidation of the recycling industry is preferred at a lower level of θ. This is intuitive since higher collection rates increase the available WEEE, which makes it easier for the recyclers to exploit economies of scale and hence favors consolidation.
5.2. Recycler Consolidation with Asymmetric Manufacturers
In what follows, we give a brief account of the impact of allowing discrimination of manufacturers.
Suppose that manufacturer 1 has a larger market share than manufacturer 2, i.e., α
1>α
2 (see Figure 4). As before, we use the cs to denote the competitive scheme under consolidation, and introduce the csm to denote the monopolistic scheme under consolidation. As the recycler is allowed to charge different fees to manufacturers in the competitive scheme, we represent the equilibrium recycling fee charged to manufacturer i as  , i=1, 2. The equilibrium recycler profits are denoted as
  k=cs, csm and the equilibrium manufacturer profits are denoted as
  k=cs, csm and i=1, 2. The equilibrium expressions are presented in supporting information Appendix S3.
P
The recycling fees set by the consolidated recycler are such that
The consolidated recycler prefers the competitive scheme,
The product prices are such that
The manufacturers' profits are such that
 ,
, ,
, , and
, and
 .
.
It is evident from Proposition 6 that, under the competitive scheme, it is in the best interest of the consolidated recycler to discriminate between manufacturers as she garners more profit. This is achieved by protecting the smaller manufacturer, by charging him lower recycling fees. In the monopolistic scheme, an average recycling fee is set, putting the smaller (larger) manufacturer at a disadvantage (advantage). Indeed, as parts 3 and 4 elucidate, the differentiated recycling fee structure in the competitive scheme translates into lower (higher) product prices for the smaller (larger) manufacturer. Consequently, the smaller (larger) manufacturer prefers the competitive (monopolistic) take‐back scheme. Proposition 6 confirms that in countries with nationwide monopolistic take‐back schemes and highly consolidated recycling industries (e.g., the Netherlands), small manufacturers/importers would put pressure on the nonprofit organization under the premise that the membership fees do not fairly reflect the market sizes and result in financial burden for them (Savage 2006).
6. Asymmetric Recyclers: Impact of Recycling Technologies and Operational Efficiencies
Our discussion, so far, assumes that the recyclers have identical cost structures. This means that they are relatively similar in size and in terms of technological/operational capabilities. In reality, unit costs can differ because of available capacities, the technologies adopted, and the recycler's ability to exploit economies of scale. In this section, we focus on this scenario. Specifically, we assume that recycler A operates more efficiently than recycler B, and hence has a lower unit cost. We capture the differing unit cost structures via the economies of scale factors, θ A >θ B . We note that similar results hold when the discrepancy is due to unit costs η i . The manufacturers, on the other hand, have identical market shares α 1=α 2≡α.
We first highlight a potential free rider problem that can arise in the monopolistic take‐back scheme when the WEEE is allocated according to the fixed allocation rule defined earlier.
P ). Then, recycler B sets a higher recycling fee and earns more profit than recycler A.
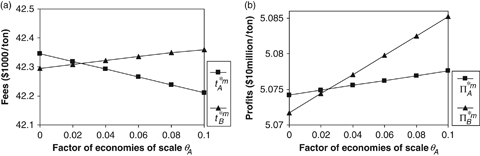
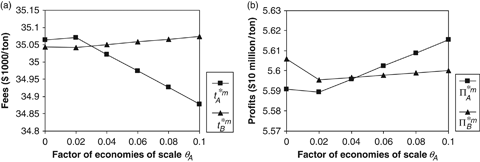
Proposition 7 shows that the recycler with weaker economies of scale (higher cost structure) free rides on the cost reduction efforts of the efficient recycler. Note that by charging the average recycling fee to the manufacturers, the nonprofit organization subsidizes the costs of the inefficient recycler. A fixed WEEE allocation rule, where the recyclers are guaranteed their WEEE shares regardless of the fees they charge, creates an incentive for the recycler with weaker economies of scale to increase her fee. The recycler with a lower cost structure sets a lower recycling fee to partially compensate for this, but suffers from reduced profits. We further illustrate the free rider phenomenon in Figure 5. In this example, we have set λ=1/2, θ B =0.025, and β=0.15, while the other parameters are set on their base values. We varied θ A from [0,0.1]. Clearly, for θ A >θ B , recycler A charges lower fees and garners less profits than the free rider recycler B.
The above discussion highlights that in a fragmented recycling industry where cost structures and the abilities to exploit scale economies among the recyclers differ significantly, it is essential for the nonprofit organization to enhance competition among recyclers and avoid free riding behavior. This can be achieved by adopting a WEEE allocation rule that is linked to the recycling fees charged (the lower the recycling fee, the more WEEE allocated). We now introduce one such fee‐based allocation rule.
Let us assume that the nonprofit organization charges a weighted average of the recycling fees to the manufacturer as membership fees 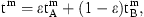
 i.e., the collection rate times total number of products sold to the market by the manufacturers. Under the fee‐based rule, we assume that the collected WEEE is allocated to recyclers A and B as
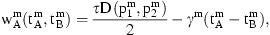
The equilibrium fees, product prices, and profits for the monopolistic scheme under fee‐based allocation can be found using the approach presented in section 4. The expressions are quite lengthy and are rather unrevealing in nature, so we omit the derivations and instead use numerical experiments to illustrate the main effects of this allocation rule. Note that, under this rule, depending on the value of ɛ, the nonprofit organization can face a deficit or surplus. Although this is observed in some countries including the Netherlands, Belgium, and Sweden (Future Energy Solutions 2003), in order to remain consistent with our framework and to compare models on an equal footing, for every problem instance in our numerical study, we choose ɛ so that the nonprofit organization breaks even.
Figure 6 depicts recycling fees and profits under the fee‐based allocation rule for the same data used in Figure 5, with γ m =0.01. Evidently, when the nonprofit organization induces stronger competition in the recycling market, the free riding complication is resolved—the more efficient recycler sets a lower fee, but earns higher profits. This result also holds for other γ m values.
7. Impact of Competition in the Recycling Industry
Our basic framework assumes that the recyclers do not compete for WEEE allocation in the recycling market; the recyclers compete with each other through the impact of their recycling fees on the manufacturing market. The preceding section broached the importance of inducing competition in the WEEE recycling industry for the monopolistic scheme. There still remains the question of how such competition would impact the competitive scheme and the preferability of each take‐back scheme. To this end, we first develop a comparable model for the competitive scheme in which the manufacturers are allowed to sign contracts with both of the recyclers and allocate WEEE based on their fees. We then compare the monopolistic and competitive take‐back schemes in this extended setting. Throughout this section, we assume that the manufacturers have equal market sizes (i.e., α 1=α 2≡α) and recyclers have identical cost structures (i.e., η 1=η 2≡η and θ 1=θ 2≡θ).
In practice, manufacturers consider a multitude of factors in addition to cost when they contract with their strategic partners. This suggests that even if the fees charged by the recyclers are the same, a manufacturer might harbor a stronger preference for one particular recycler due to some practical factor not captured in our model (e.g., proximity, long‐term collaboration potential). Our extended framework incorporates this flexibility. Specifically, we assume that manufacturer 1 prefers recycler A and assigns her a base allocation of σ× 100% of WEEE (0.5≤σ≤1). The rest (1−σ) × 100% of the collected WEEE is assigned as recycler B's base allocation. Note that σ is an exogenous parameter. The actual amount of waste transshipped reflects the differences in the fees set by the recyclers (the higher the fee, the lower the WEEE allocation) in the same spirit as Equations (17) and (18). Letting γ
c
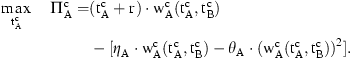
denote the sensitivity of WEEE allocations to the fees, manufacturer 1's profit and optimization problem is given as 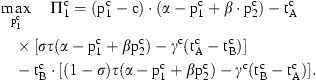
As before, the first term in (19) represents the net sales revenues, while the last two terms correspond to the recycling costs that manufacturer 1 bears from recyclers A and B, respectively. In a similar vein, manufacturer 2 prefers recycler B and assigns her a base allocation of σ× 100%, while the rest is allocated to recycler A. The resulting profit for manufacturer B can be derived analogously.
In this extended framework, each recycler receives WEEE from both manufacturers. Specifically, recycler A receives 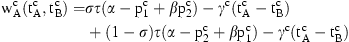
We analyze the resulting two‐stage game led by the recyclers using backward induction. The analytical expressions that characterize the unique equilibrium are quite complicated and lengthy, and are therefore omitted. For the same reason, we carry out further sensitivity analysis and comparisons numerically. We use the same base data set as in supporting information Appendix S2 with the additional base parameters σ=0.5 and γ
c
=0.01. We set
Our numerical study confirms that the impact of operating and marketing factors (see Proposition 1) on equilibrium decisions and profits remain the same when the recyclers directly compete for WEEE in the recycling market. In the interest of space, we focus our attention on the impact of parameters that are unique to the extended framework.
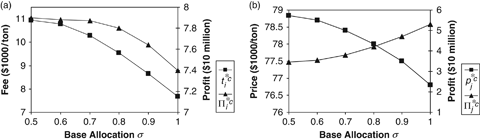
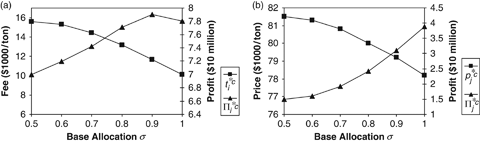
Figure 7 illustrates the effects of the base allocation σ on the equilibrium fees and prices as well as profits for a highly competitive recycling market (characterized by a high level of γ c ). Note that when a recycler becomes more reliant on the WEEE business coming from a particular manufacturer (σ increases), their decisions become more tightly coupled, and her market power to increase WEEE amounts weakens. This forces her to compete more fiercely in price. As evident from Figure 7(a), when manufacturers induce strong competition among recyclers (high γ c ), recycler fees are beaten down significantly as σ increases, and reduced margins lead to lower profits for the recyclers. Manufacturers, on the other hand, benefit from the low fees to cut product prices, increase demand, and improve their profits. Clearly, the incentives for striking exclusive partnership are misaligned; manufacturers prefer to deal more exclusively with a specific recycler, while the opposite is true for recyclers.
In order to put these results in better perspective, we also investigate the impact of σ in a slack recycling market (γ c is zero or approximately zero). Figure 8 illustrates these results. Observe from Figure 8(a) that as the base allocation σ increases, the recycling fees still decrease even when the recyclers have guaranteed allocations. As before, when recyclers become more dependent on a particular manufacturer's WEEE, they try to steal business from each other through the impact of their decisions in the original product market, forcing them to reduce fees. Initially, the reduced fee (and consequent lower product prices) brings more WEEE business to recyclers and improves their profitability. However, when the recyclers' business depends too much on one manufacturer (σ becomes too high), the impact of reduced margins outweighs the increased demand and WEEE, causing recycler profits to decrease. That lower fees result in lower prices and increased demand make it always desirable to the manufacturer, as seen in Figure 8(b).
Putting these results together, it is evident that manufacturers prefer to deal with a single dedicated recycler for WEEE treatment regardless of the intensity of competition within the recycling industry. A more exclusive relationship is desirable (to some extent) to recyclers, provided the intensity of competition for WEEE allocation is low. Otherwise, recyclers prefer to deal with multiple manufacturers and WEEE streams. Comparing Figures 7 and 8, it is also possible to verify that a higher degree of competition in the recycling industry (γ c =0.01 vs. γ c =0) drives fees and prices down, improves manufacturer profits, but eats into recycler profits. Note that these results are based on a symmetric model. We conducted additional numerical experiments, where both manufacturers have the same base allocation to one particular recycler. We observe that our main results hold true for such asymmetric cases as well.
7.1. Comparison of Monopolistic and Competitive Schemes
In this section, we compare the monopolistic and competitive schemes numerically, and test the validity of our comparative results in sections 4 and 5 in the extended setting. For the monopolistic scheme, we assume that the nonprofit organization adopts the fee‐based allocation rule as shown in section 6. Accordingly, the recycling fees charged by the nonprofit organization to manufacturers follow (16), while WEEE allocations to recyclers follow (17) and (18). In order to compare the two schemes on an equal footing, we assume that the base allocations of each recycler in the competitive scheme are σ=0.5. Our numerical experiments are based on the same data set used in the previous section.
We first investigate the impact of the intensity of competition for WEEE in the recycling market. For this experiment, we set the fee sensitivity parameters γ m =γ c =γ, and vary γ. Figures 9 and 10 illustrate the effects on equilibrium fees, prices, and profits. Clearly, as γ increases, the enhanced competition between recyclers for securing WEEE allocation results in reduced recycling fees and reduced product prices under both schemes. This improves manufacturer profitability (Figure 10[b]). Observe, however, that the impact on the recycler profits is nonmonotone. As γ increases, the reduced product prices generate higher product demand and WEEE for each recycler, which offsets the reduced margins initially. However, when competition intensifies between the recyclers (high γ), the fees are reduced extensively, causing recycler profits to decline (Figure 9(b)). On the basis of Figures 9and 10, we can make the following general observations:
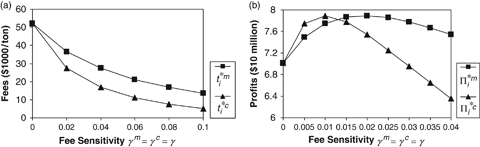
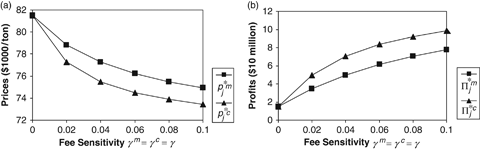
O
O such that, for
 , recycler profits are higher under the competitive scheme. Otherwise, recycler profits are higher under the monopolistic scheme.
Observations 1 and 2 elucidate that when γ is relatively low, our conclusions obtained under the basic framework (Propositions 2 and 3) remain valid. That is, the competitive take‐back scheme results in a win–win for consumers, manufacturers, and recyclers (provided product substitutability is not high, which is the case in this example, β=0.25). On the other extreme, when γ is high, the recyclers are better off under the monopolistic scheme because the nonprofit organization moderates the degree of competition. We note that these results hold even if the recyclers have different technological capabilities and unit recycling cost structures. Also, when the intensity of competition under the two take‐back schemes is different (i.e., γ c ≠γ m ), a higher value of γ c in relation to γ m improves the desirability of the competitive take‐back scheme from the viewpoints of manufacturers and consumers, while decreasing that of recyclers, as expected. The reverse is true when γ c takes a lower value relative to γ m .
As the preceding discussion highlights, the structural results on the desirability of each take‐back system are highly dependent on the intensity of competition for WEEE allocation. For this reason, the amount of WEEE available for recycling, and hence the collection rate τ, also have a bearing on the results. This is particularly important for the intermediate range of γ. A low level of τ implies that recyclers have to compete more for the limited supply of WEEE, which naturally shifts preferences toward the case with high γ. In contrast, when τ is high, there is less incentive for recyclers to engage in intense competition for WEEE allocation, shifting preferences toward the case with low γ. For the more extreme scenarios of low or high levels of γ, however, shareholder preferences are robust with respect to the collection rate τ.
Next, we explore the effects of the other key parameters (β and θ). In the following series of numerical experiments, we vary β and θ in their respective ranges while the remainder of the parameters are kept constant at their base levels (here γ m =γ c ≡γ=0.01).
Figure 11 depicts the impact of product substitutability β on fees, prices, and profits. Note that in Figure 11(a), we vary β in a smaller range [0.475, 0.575] in order to clearly show the crossing of recycler profits under monopolistic and competitive schemes.
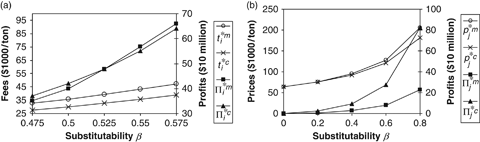
O such that for
 the recycler profits are higher under the competitive scheme. Otherwise, recycler profits are higher under the monopolistic scheme.
O
Observation 3 confirms the validity of Proposition 2. Specifically, recycler preference is driven by the degree substitutability β and economies of scale factor θ. Note that  when θ is high, i.e., the recyclers would prefer the monopolistic scheme under strong scale economies regardless of the level of product substitution. Also, Observation 4 confirms the validity of Proposition 3, i.e., the lower recycling fees translate into lower product prices under the competitive scheme and increase manufacturer profits. Jointly, these observations substantiate the fact that a win–win outcome for all stakeholders is possible when the products are relatively less substitutable and the scale economies are not strong. Otherwise, the recyclers would prefer to operate through a nonprofit organization in a monopolistic take‐back scheme. We remark that these observations hold true for other levels of γ.
Next, we investigate the effects of recycler consolidation in our extended framework. At a given level of β, Figure 12 illustrates the impact of the economies of scale factor θ on fees, prices, and profits under the competitive scheme with and without consolidation.
O such that, for
  , the consolidated recycler charges a lower fee. Otherwise, the consolidated recycler charges a higher fee. The consolidated recycler's profit is always larger than the sum of competing recyclers' profits.
O , manufacturers charge lower prices and earn larger profits under consolidation. Otherwise, manufacturers charge higher prices and earn lower profits under consolidation.
Observations 5 and 6 confirm the validity of Propositions 4 and 5. Clearly, consolidation is always beneficial to the recycling industry as it allows economies of scale to be exploited fully. When the economies of scale factor is above a threshold ( in this example), consolidation in the recycling industry leads to lower fees, lower prices, and higher manufacturer profits (provided that products are not highly substitutable). Consequently, when the economies of scale in recycling costs are sufficiently strong, consolidation leads to win–win outcomes for consumers, recyclers, and manufacturers.
Collectively, the above six observations extend the conclusions drawn under our basic framework (Propositions 2, 3, 4, and 5) to the generalized setting where recyclers have to compete directly for securing WEEE from the manufacturers. Hence, we can confidently conclude that our insights are robust to the intensity of competition within the recycling industry.
8. Summary and Discussion
In this paper, we present an analytical framework to analyze and compare monopolistic and competitive take‐back schemes for recycling end‐of‐life electrical and electronic equipment. Both types of schemes are observed in practice, and the opposing views regarding the desirability of each scheme are detailed. We find that aligning the incentives of all stakeholders is not always possible. Consequently, achieving a nationwide consensus on organizing WEEE take back and recycling can be difficult and may pose challenges for policy makers. Our analysis shows that manufacturer and consumer preferences are always aligned. These, however, need not coincide with recycler preferences. Hence, regulatory bodies might need to trade off the benefits and the losses of different stakeholders before adopting a particular type of take‐back scheme. Our results point out not only the specific industry characteristics that would lead to win–win outcomes for all stakeholders, but also the conditions that would lead to conflicts among the stakeholders. These conditions can provide critical guidance to policy makers as they decide on the adoption of a particular type of take‐back scheme.
Specifically, our analysis indicates that consumers and manufacturers generally prefer the competitive scheme as it results in lower product prices and higher manufacturer profits. Recyclers' preferences, however, depend critically on product substitutability and economies of scale in recycling costs. When both these factors are at relatively low levels, the recyclers prefer the competitive scheme as well, resulting in a win–win outcome for all stakeholders. Otherwise, it is advantageous for the recyclers to work with a nonprofit organization that serves as a buffer from the highly competitive manufacturer market. Indeed, our results also suggest that when the products are highly substitutable, the recyclers are likely to prefer the monopolistic scheme irrespective of the scale economies in recycling costs.
On the other hand, when the products are not highly substitutable and there are sufficient scale economies in recycling, consolidation of the recycling industry becomes desirable for all stakeholders. Otherwise, regulatory bodies will have to carefully assess the possible benefits/costs to each stakeholder before taking measures to encourage/discourage consolidation in the recycling industry. High collection rates favor consolidation as well. Our study also cautions policy makers that when one recycler dominates or monopolizes the recycling market, she may be tempted to discriminate between manufacturers by charging different fees under the competitive scheme. This could ignite additional conflicts of interest among the parties.
When the recycling industry comprises firms with different technologies and operational efficiencies, it is essential for the nonprofit organization in the monopolistic scheme to allocate WEEE based on recycling fees that enhance the competition among the recyclers. Failure to do so would result in free rider problems. We show that inducing competition among recyclers for WEEE allocation is actually beneficial for all stakeholders under both the competitive and monopolistic schemes, provided the intensity of competition does not exceed moderate levels. This results in lower fees, lower product prices, and increased profits for manufacturers and recyclers. Furthermore, the preferability of each scheme from the viewpoints of consumers, manufacturers, and recyclers remains the same. Inducing intense, cut‐throat competition, however, could be problematic. In this case, recycler fees are beaten down significantly (especially under the competitive scheme), eroding the margins of recyclers and their profits. In such an environment, recyclers would be tempted to act cooperatively (i.e., communicate and agree on fees to quote) and resist the pressure to reduce fees. They would also prefer to operate under the monopolistic scheme, while manufacturers and consumers would prefer the competitive scheme.
Our study shows that in the competitive scheme, manufacturers prefer to deal more exclusively with a dedicated recycler for WEEE treatment. By making a recycler more dependent on her WEEE stream, the manufacturer can actually strengthen his market power over the recycler. More exclusive contracting is acceptable to recyclers, at least to some extent, only when they have guaranteed WEEE allocations from manufacturers (i.e., the intensity of competition among recyclers for WEEE is low). Otherwise, recyclers would prefer to compete for WEEE allocations from multiple manufacturers.
In closing the paper, we highlight three avenues for future research based on possible relaxations of some key assumptions of our modeling framework. First, our framework involves two manufacturers and two recyclers, both of which can be viewed as consortia of firms. We model each consortium as a single decision maker. It is not uncommon for manufacturers to form consortia when they deal with recyclers, but normally each manufacturer in the consortia makes independent production and pricing decisions. An interesting extension of our framework would be to allow multiple manufacturers (i.e., decision makers) in each consortium. This would intensify the competition in the product market, and likely force down the product prices and manufacturer profits. We would expect, however, our main results regarding the preferability of each scheme and its key drivers to remain valid.
Second, collection‐related decisions and costs play an important role in the success of WEEE recycling programs. These costs, which may exhibit economies of scale, are not considered in our framework. In some WEEE take‐back implementations, collection costs are borne by the manufacturers, while in others the financial responsibility is on the municipalities or end‐users. It would be worthwhile to extend our framework to study alternative collection channel choices and financing options, as well as the impact of economies of scale in collection costs.
Finally, our current model focuses on a scenario in which manufacturers outsource their recycling activities to third‐party recyclers. In reality, some manufacturers internalize their recycling activities. An interesting subject of future research would be to investigate the conditions under which vertically integrated WEEE treatment and recycling is more profitable from the manufacturer viewpoint.
Footnotes
Acknowledgments
This research is supported by Social Sciences and Humanities Research Council of Canada through a team grant to the second and third authors. During the final stage, the first author was supported in part by the Natural Sciences and Engineering Council of Canada. The authors greatly appreciate the comments of three referees and the associate editor, which were very helpful in improving the paper.